Builder Legends Overview
Apply a map legend to show symbols and text that describe your data in CARTO Builder.
A legend displays symbols and text about your data in a fixed position on your map, and is an essential part of how viewers understand your published visualization.
Legend templates in Builder are automatically generated when you style By Value, and are driven by the color and size options applied to the map layer. You can modify legend details, create customized legends using HTML code directly from Builder, and show or hide legends on your map.
This guide provides an overview of the different types of legends that are available, and explains how legends interact with other map features in Builder.
Auto-Generate Legends with Style Options
This section guides you through the process of selecting different style options in Builder (from the STYLE tab) to enable different types of legends that can be managed through the LEGEND tab of your map layer.
- Import the template .carto file packaged from “Download resources” of this guide and create the map. Builder opens with San Francisco street data as the first layer, and San Francisco tree data as the second layer.
Click on “Download resources” from this guide to download the zip file to your local machine. Extract the zip file to view the .carto file(s) used for this guide.
The objective is to style both map layers to create two color legends, and one size legend.
Gradient legend (color)
-
Select the SF Streets layer.
The STYLE tab opens by default.
-
Style the map layer by color:
- Click the By value option for STROKE COLOR.
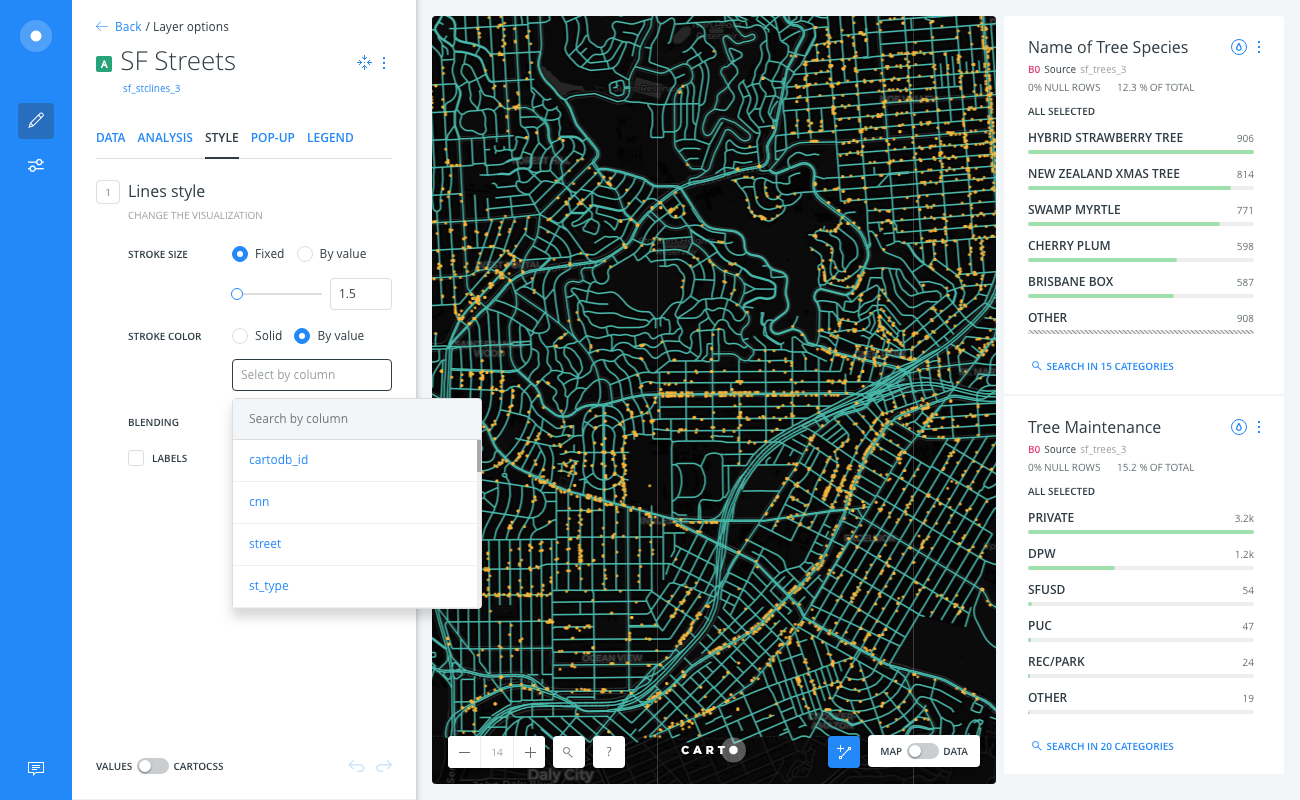
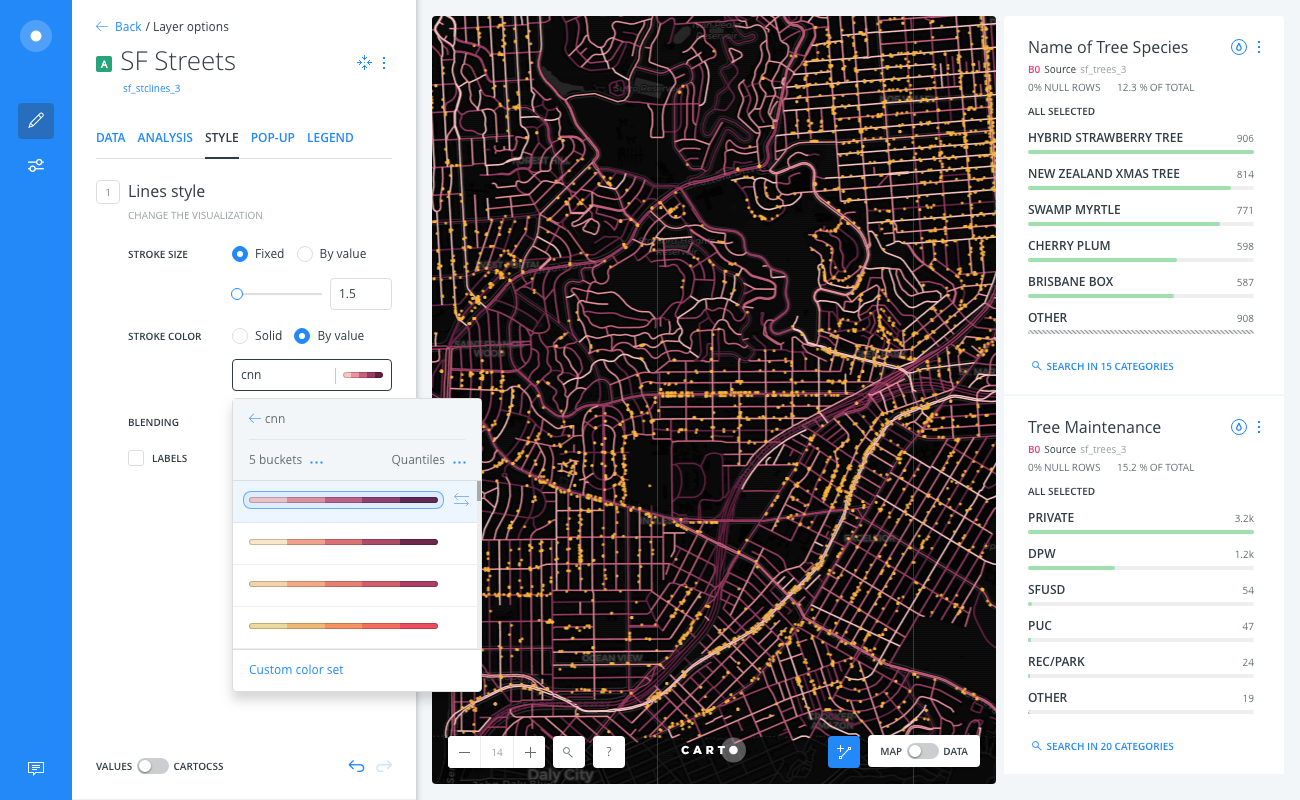
- Select the numeric column
cnnfrom the map layer. This column indicates the intersections from the street data. The color scheme picker appears.
-
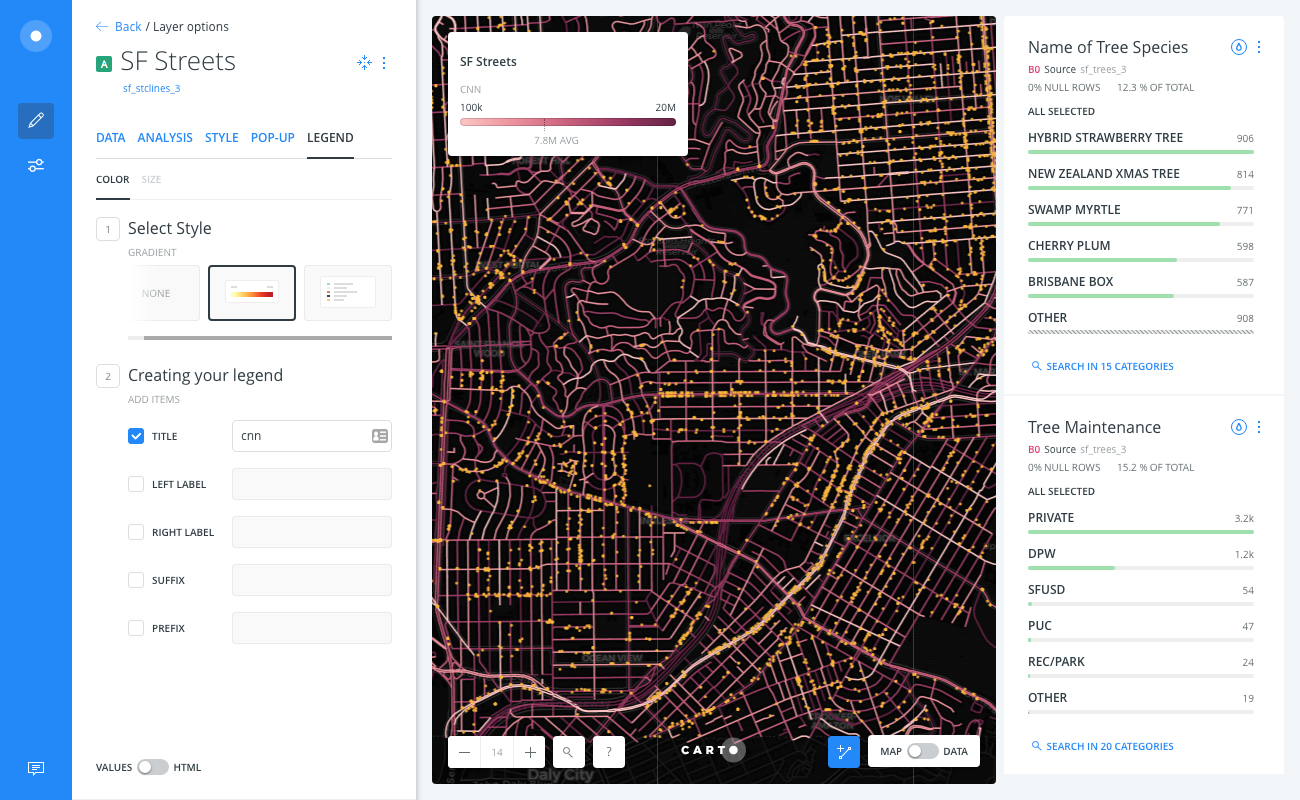
Enable the Gradient legend:
- Click the LEGEND tab of the selected map layer.
- Choose the Gradient style from the COLOR subtab.
Category legend (color)
-
Navigate back to the LAYERS list and select the SF Trees layer.
The STYLE tab opens by default.
-
Style the map layer by color:
- Click the By value option for POINT COLOR.
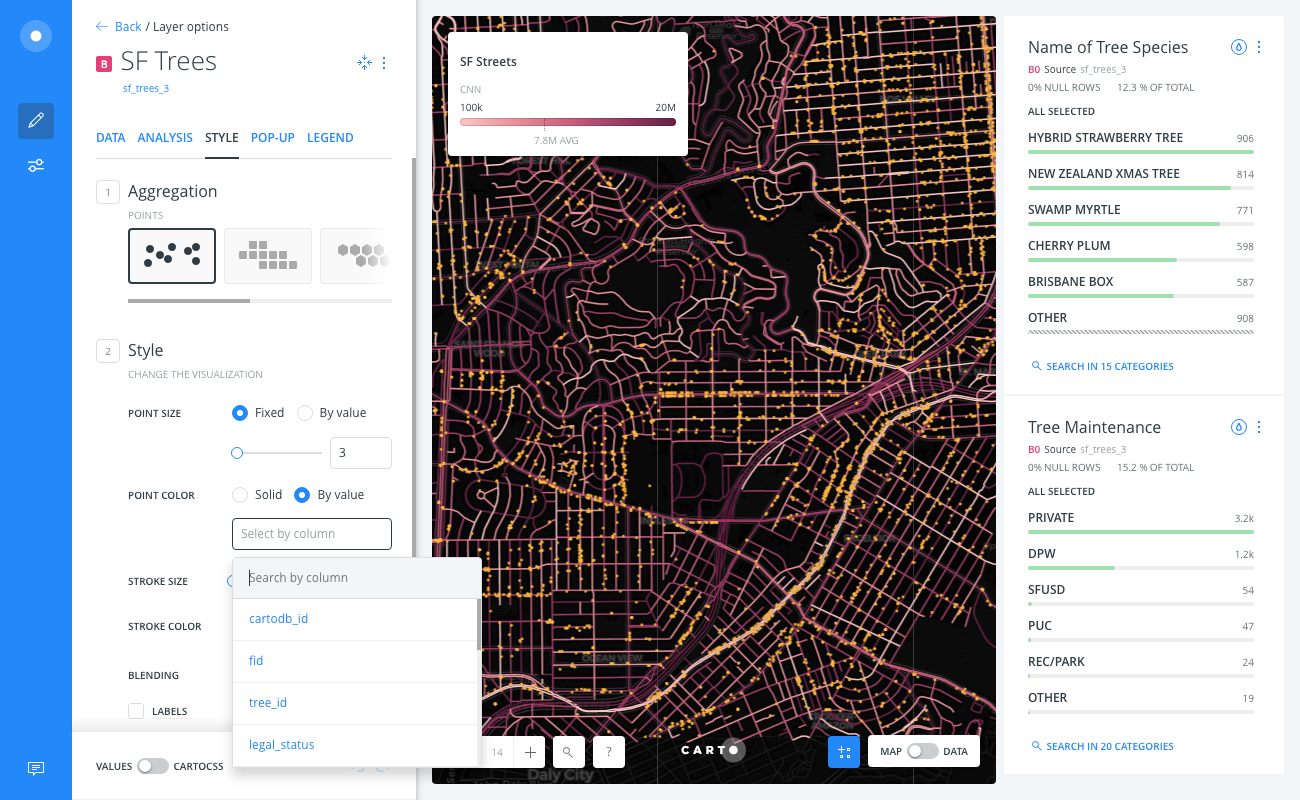
- Select the string column
legal_statusfrom the map layer. This column indicates the registered legal status of trees in the San Francisco area. The color scheme picker appears.
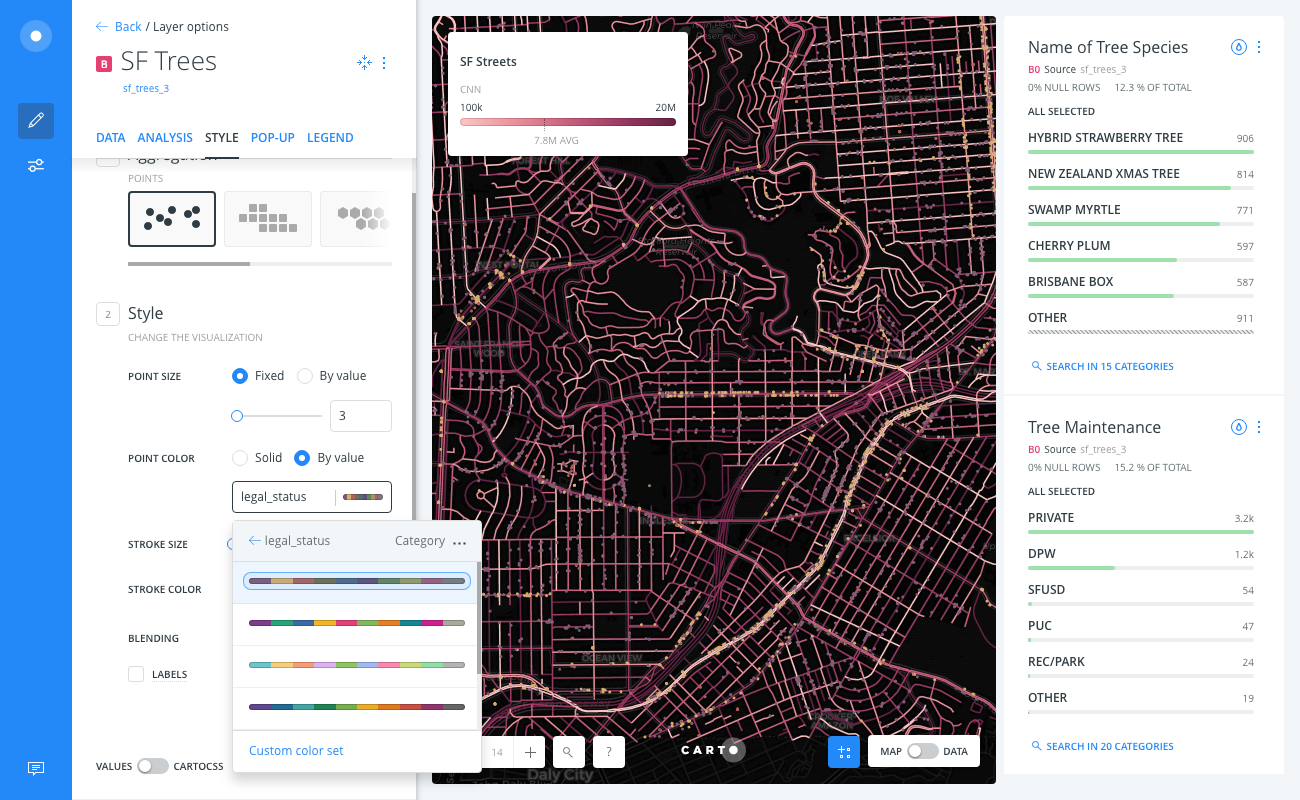
-
Enable the Category legend:
- Click the LEGEND tab of the selected map layer.
- Choose the Category style from the COLOR subtab.
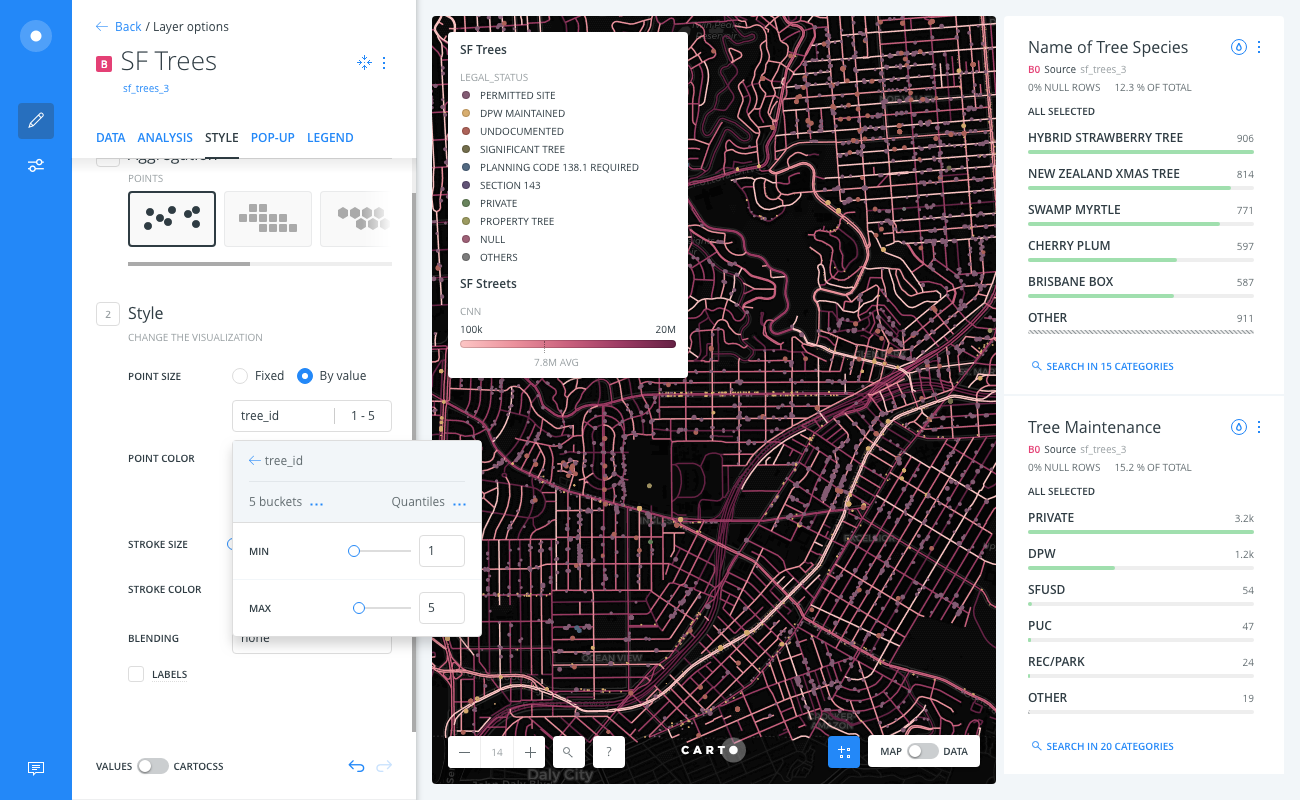
Bubble legend (size)
-
From the STYLE tab of the SF Trees layer, style the map layer by size:
- Click the By value option for POINT SIZE.
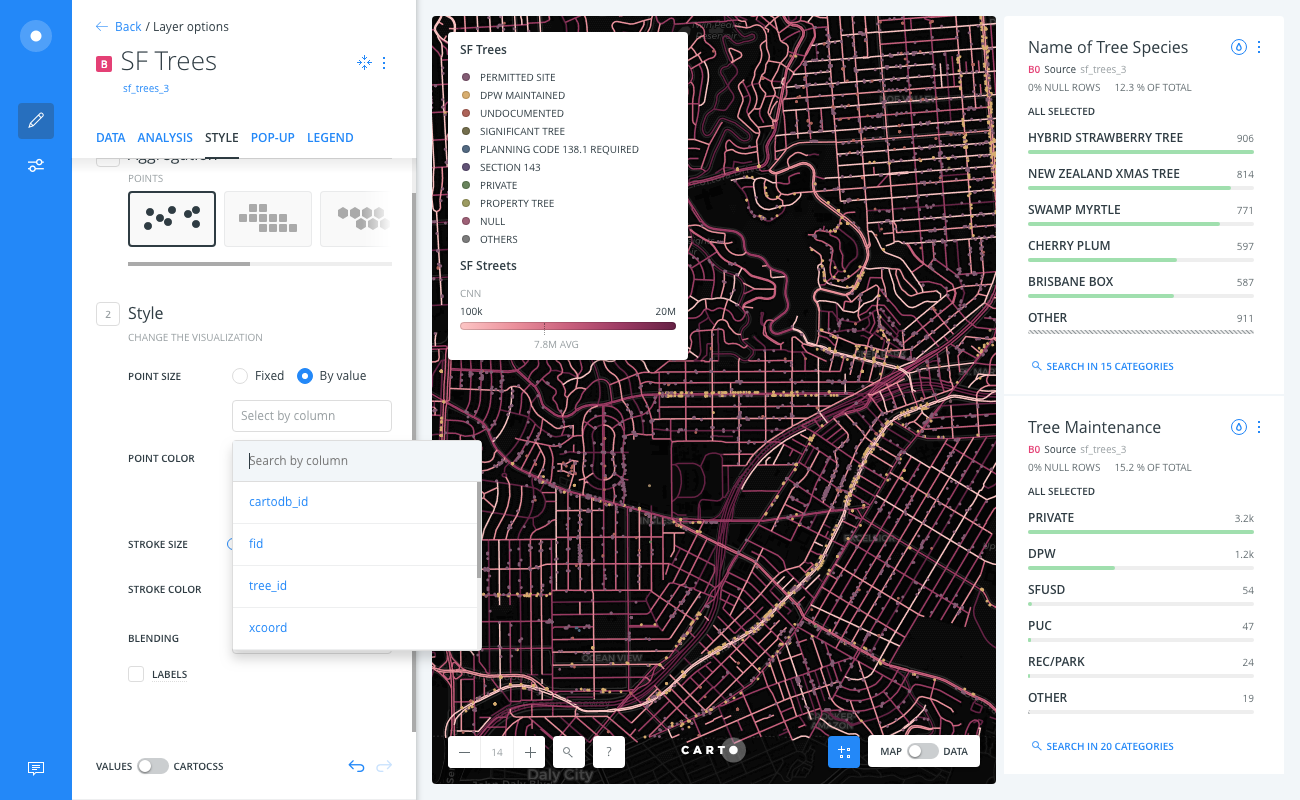
- Select the number column
tree_idfrom the map layer. You can modify the MIN and MAX values for the size of the marker.
-
Enable the Bubble legend:
- Click the LEGEND tab of the selected map layer.
- Choose the Bubble style from the SIZE subtab.
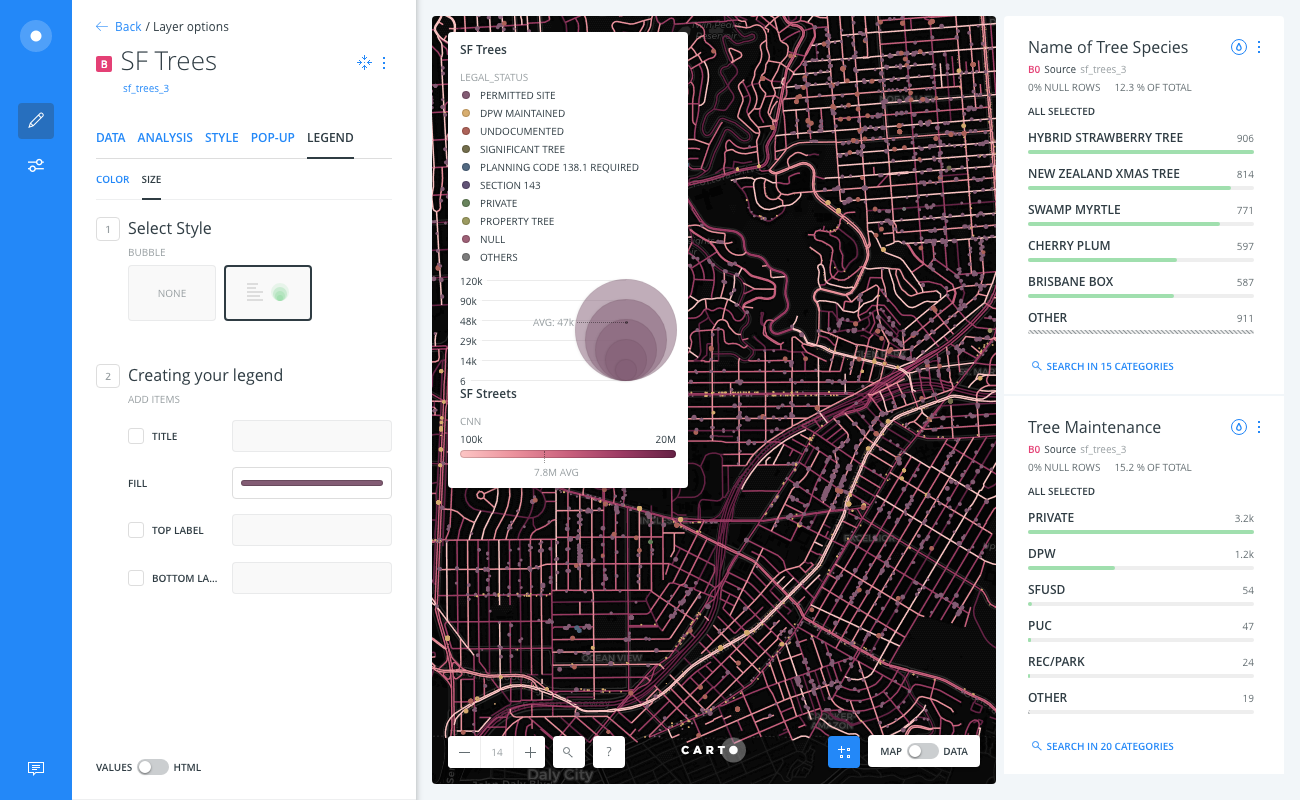
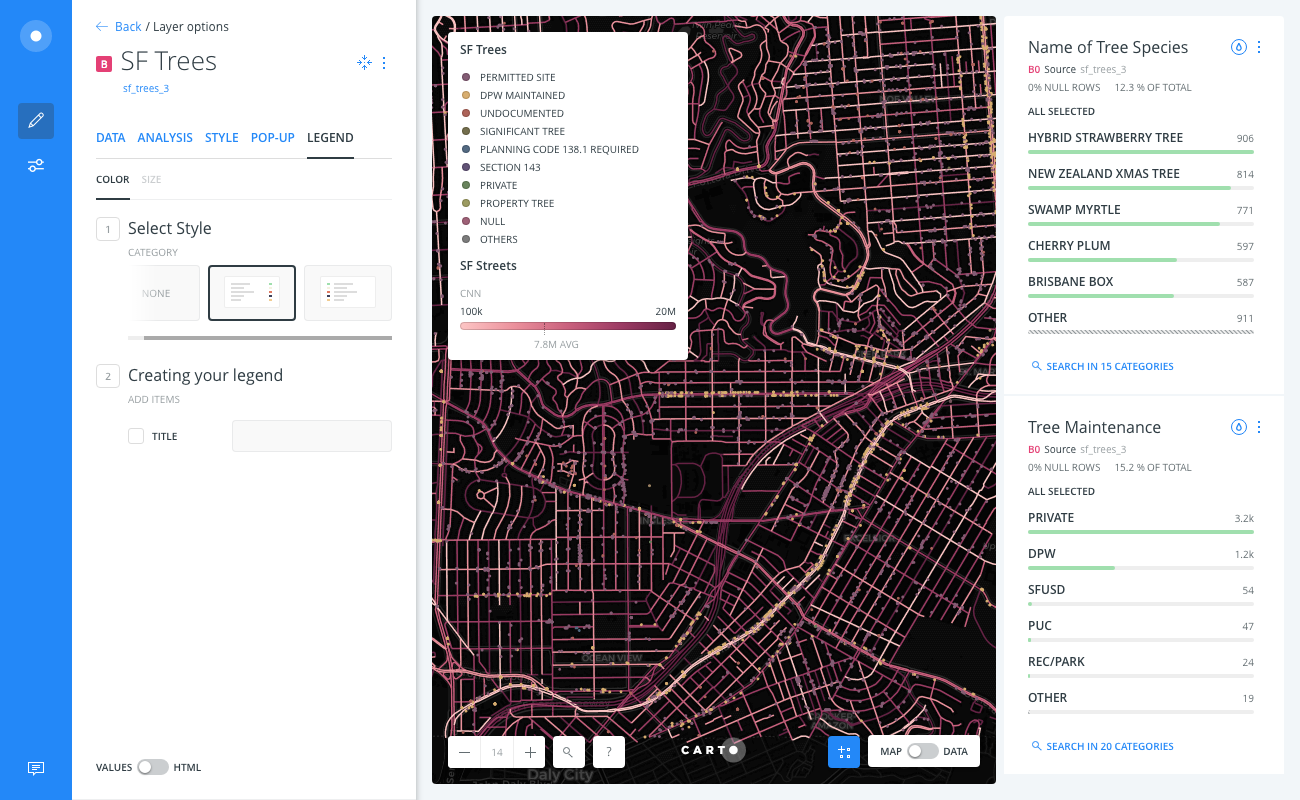
Managing Legends
The LEGEND tab of a selected map layer displays two subtabs, COLOR and SIZE. You can manage any auto-generated legends, or create your own custom legends from this tab.
-
The COLOR subtab, selected by default, enables you to add a legend title, modify label text for gradient legends, and apply a custom legend with defined colors and text.
-
The SIZE subtab enables you to modify the details of any bubble legends that may be applied.
Switch the slider button, located at the bottom of the LEGENDS tab, from VALUES to HTML, to apply custom legends using your own HTML code.
Legend Titles
You can include a TITLE as an additional item to be displayed on your legend. A legend title appears underneath the layer name of the legend. The default value is the selected value from the STYLE tab (BY COLOR or BY SIZE), which you can modify from the LEGENDS tab. This is especially useful for layers that contain multiple legends.
The following example displays a modified legend title being applied to the SF Street layer.
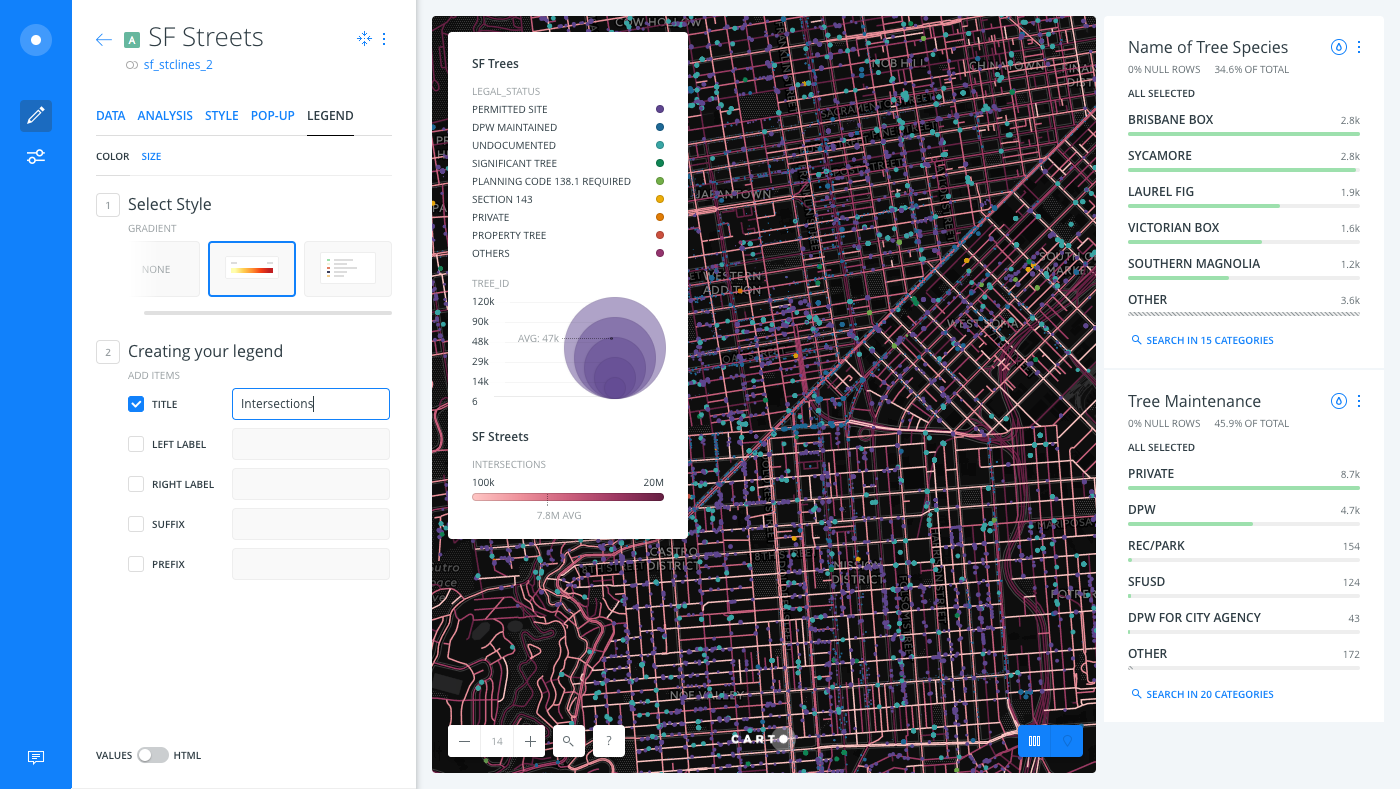
Legend titles are different from layer names. The layer name appears as the header of the legend, which is inherited from the connected dataset of the map layer. You can rename the map layer to change how the layer name appears on the legend. In the example above, INTERSECTIONS is the legend title and SF Streets is the layer name.
Legend Tips and Behavior
Note the following tips and behavior when using legends in Builder.
- You can show or hide legends from the Map Options. The Map Options are accessible from the Builder toolbar.
- You can apply multiple legends to one map layer. This is useful if you are styling a layer by color and size.
- If custom CartoCSS is applied to a map, any applied legends are automatically removed from the map.
- Legends interact with the LAYER SELECTOR. If you have a map with multiple layers, and the LAYER SELECTOR option is enabled through the Map Options, the legend appears or disappears (along with the selected layer) on the published version of your map.
- You cannot reposition or resize the legend on your map. If you find that the default position of the legend is interfering with your map visualization, use widgets as an alternative for interacting with your data and disable legends from appearing (through the Map Options).
Legend Interaction with Widgets
The following behavior is applied if your visualization includes both widgets and legends.
- If widgets are applied, legends are dynamic and refresh to display the filters applied through the widgets.
- If auto styling is applied to widgets, category legends disappear. This is intentional by design.