Calculate Clusters of Points
Describes how to spatially separate a layer of points into a specified number (N) of groups with CARTO Builder.
This guide describes how to find natural groupings of points based on their proximity to one another. The analysis partitions each point into a group, so that the point lies closer to the center of each group than the center of any other group.
This analysis produces a new column, cluster_no (cluster number). Each row of your dataset will be classified from 0 to n-1, where n is the number of clusters that were chosen in the Builder.
In its determination of closeness, this method uses “as the crow flies” distances, instead of using an underlying transit network.
Example
To determine store locations, the Calculate clusters of points analysis demonstrates the grouping of proximal points based on the classifications given.
-
Import the template .carto file packaged from the “Download resources” of this guide and create the map. Builder opens with Customer Clusters as the first and only map layer.
-
Select the Customer Clusters map layer.
-
Click the ANALYSIS tab.
-
Apply the Calculate clusters of points analysis, entering
6as the # OF CLUSTERS.
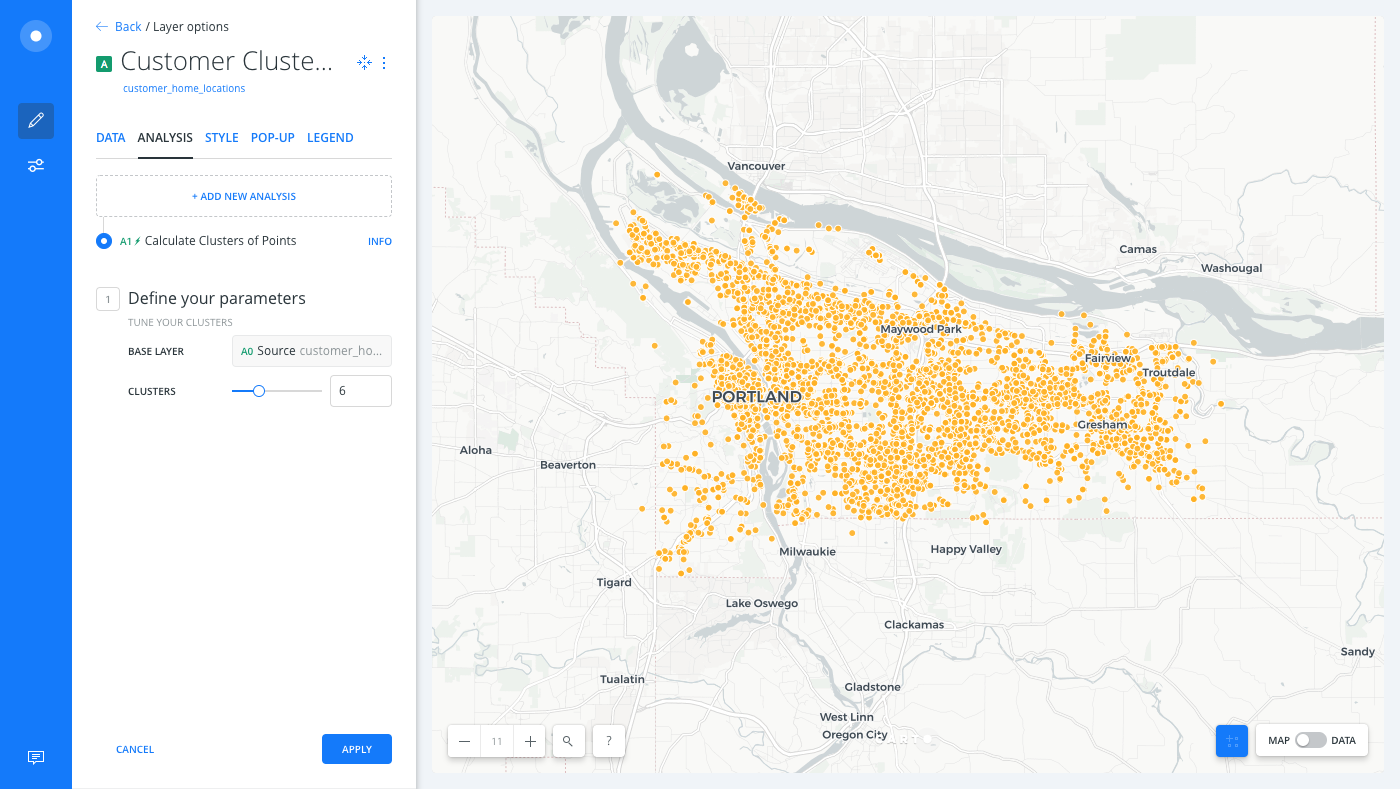
The results of this analysis show distinct regions in the city of Portland. The centers of these regions, which can be found by applying the Create Centroids of Geometries analysis to the workflow, represent locations that, by distance, are the optimal position for a store to service all of the points classified by that cluster number.
Cartography Tip
To better visualize the results of the analysis, let’s style the layer by the cluster_no value, and change the classification method of grouping data.
-
From the Customer Clusters map layer, click the STYLE tab.
-
Click the By Value option.
-
Select
cluster_no. A default color scheme is applied.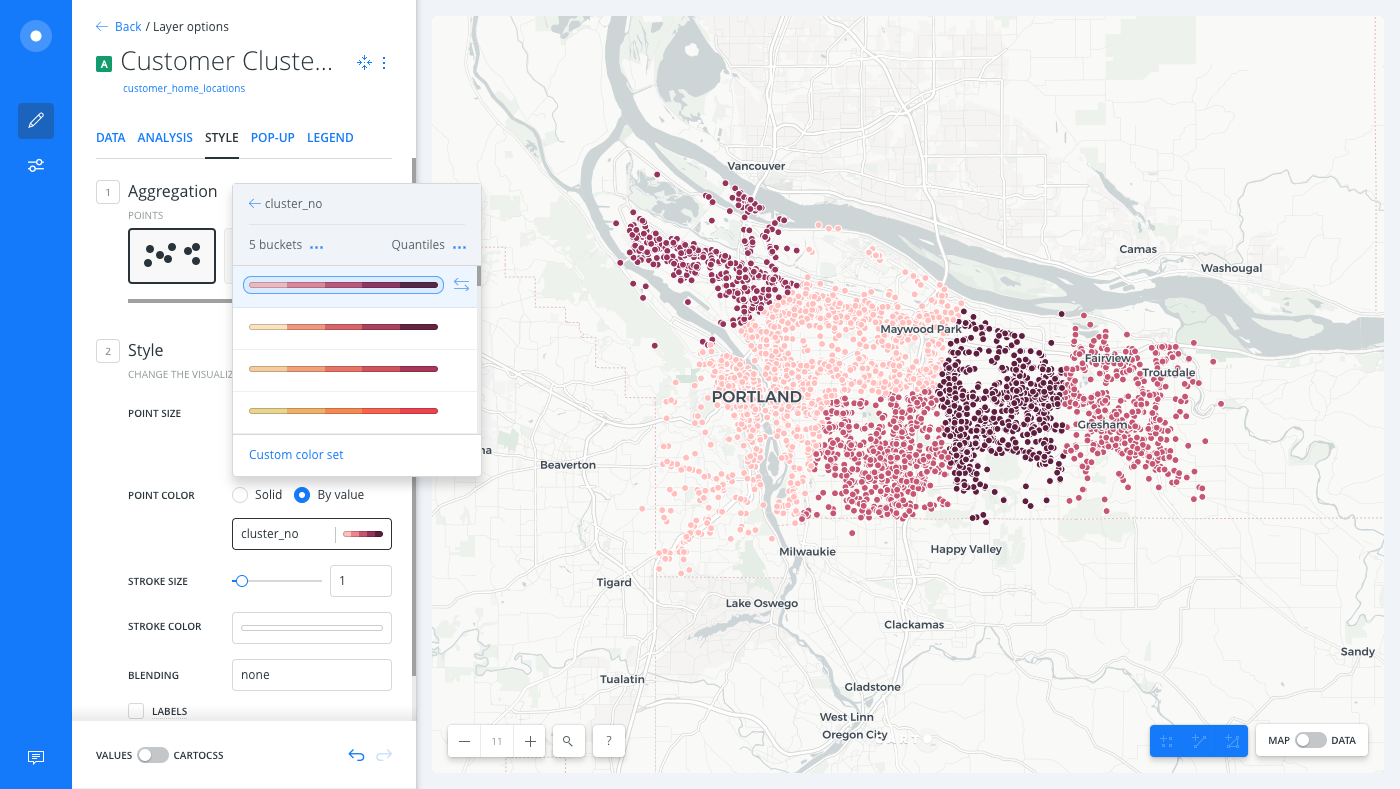
-
Change the classification method to apply color properties using categories, as described in the following steps. Select the context menu next to the default classification method, Quantiles. This enables you to change the classification for the selected column. Select Category.
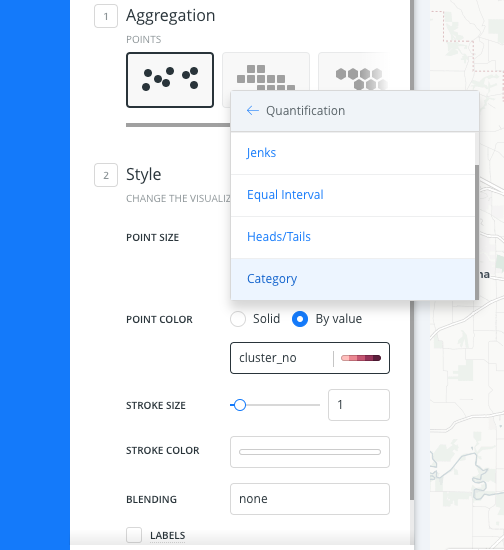
CHEATSHEET: Classification Methods
Classification methods group data into ranges. CARTO supports classifying numeric fields for graduated symbology through the following methods:
- Quantiles: A quantile classification is well suited to linearly distributed data. Each quantile class contains an equal number of features. There are no empty classes or classes with too few or too many values. This can be misleading sometimes, since similar features can be placed in adjacent classes or widely different values can be in the same class, due to equal number grouping.
- Jenks: Breaks the data into classes based on natural groupings inherent in the data. The groups are formed by decreasing the variance within classes and increasing the variance between different classes -- a 1D k-means. Since Jenks are data-specific classifications, they are not useful for comparing multiple maps built from different underlying data.
- Equal Interval: Divides the range of attribute values into equal-sized subranges. The class breaks specified by the number of buckets selected. Usually used for percentage values, it is best applied to familiar data columns such as temperature, ratios, and other relative attribute values.
- Heads/Tails: Best for data with heavy-tailed distributions, such as exponential decay or lognormal curves. This classification is done through dividing values into large (head) and small (tail) around the arithmetic mean. The division procedure repeats continuously until the specified number of bins is met, or there is only one remaining value left. This method, more than others, helps to reveal the underlying scaling pattern of far more small values than large ones.
- Category: Classifies a limited (or fixed) number of possible values, based on an attribute of a particular group, or nominal category.
Since this method classifies each point by the cluster number that it falls into, a qualitative color scheme is applied, where each output point is assigned a unique color based on the cluster_no attribute.
Advanced Styling and Filtering
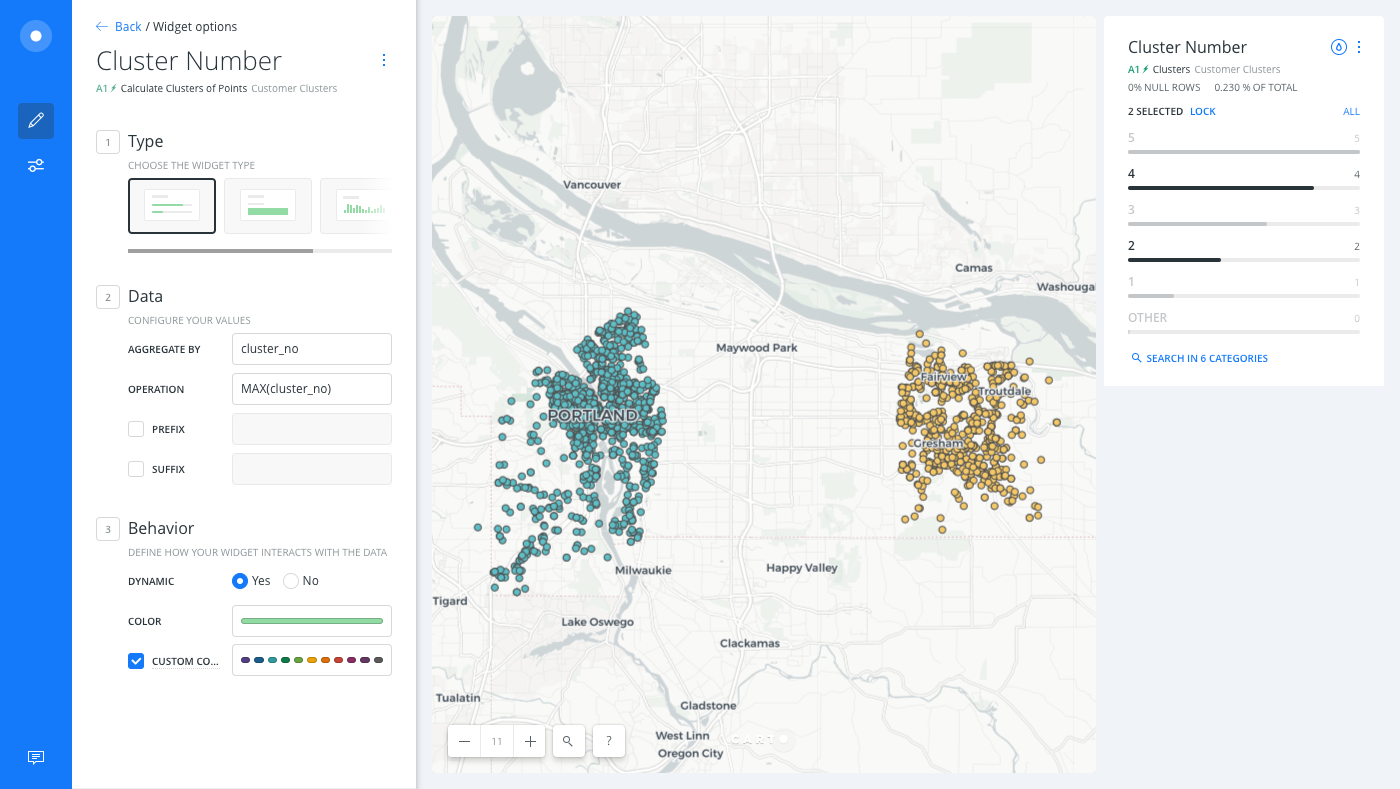
Apply custom CartoCSS to enhance the styling even more, and add a Category widget to filter data from your map.
-
Switch the slider button, located at the bottom of the STYLE tab, from VALUES to CARTOCSS and apply the following custom styling.
#layer { marker-width: 7; marker-fill: ramp([cluster_no], cartocolor(Pastel), category(6)); marker-line-width: 1; marker-line-color: #555; marker-line-opacity: 1; marker-allow-overlap: true; } -
Add the
cluster_nocolumn as a widget. Click the DATA tab. Click the checkbox next to Add as a widget for thecluster_nocolumn. Click EDIT next to the selected column from the DATA tab. -
Edit the widget details. Edit the widget TYPE to be a CATEGORY widget. Change the OPERATION to MAX by the
cluster_nocolumn. Rename the widget to Cluster Number.
Try filtering your map by selected cluster numbers to visualize selected categories of data.
Limits
This analysis has a limit on the time that it takes to execute the analysis. If the analysis takes more than 5 minutes, CARTO will return a timeout error.
External Resources
- ClusterWithin in PostGIS
- DBSCAN in PostGIS
- k-means in PostGIS
ww.postgis.net/docs/ST_MakeLine.html) for
ST_MakeLine. All analyses in Create Lines from Points use various forms of theST_MakeLinefunction.