Create and Manage Data by Drawing Geometries
Describes how to add and edit geometries in your CARTO dataset by drawing a point, line, or polygon directly on your map visualization.
This guide describes how to add and edit geometries in your CARTO dataset by drawing a point, line, or polygon directly on your map visualization. This is helpful when you need to create or manage missing data. For example:
-
Basemap features: If you have a basemap where data is not appearing; such as lakes, ponds, or cropped pieces of land that do not exist as part of the dataset or another map layer, you can manually draw the missing features over the basemap with an empty dataset.
-
Creating data for empty layers: If your map has an empty map layer with no latitude and longitude coordinates, you can add dataset coordinates from scratch by drawing geometries. You can also use the Data View to view or edit the added columns.
-
Missing data: You have a dataset where you want to add missing geometries. You can include an additional feature, and update your original dataset. For example, see how you can add a geometry based on analysis results.
Drawing a shape on your map automatically adds the geometry to your dataset, enabling you to visualize exactly where the shape appears on your map. If you are using the dataset in other maps, the added geometry is included in those maps.
Creating Data by Drawing Geometries
Suppose you have a map of San Francisco building footprints that contain polygon geometries. While the map includes parks, you notice that Mission Dolores Park is not appearing as a geometry. Since you do not have another dataset specific to San Fransisco park data, you can add an empty map layer, and draw the missing park to add the feature on your map.
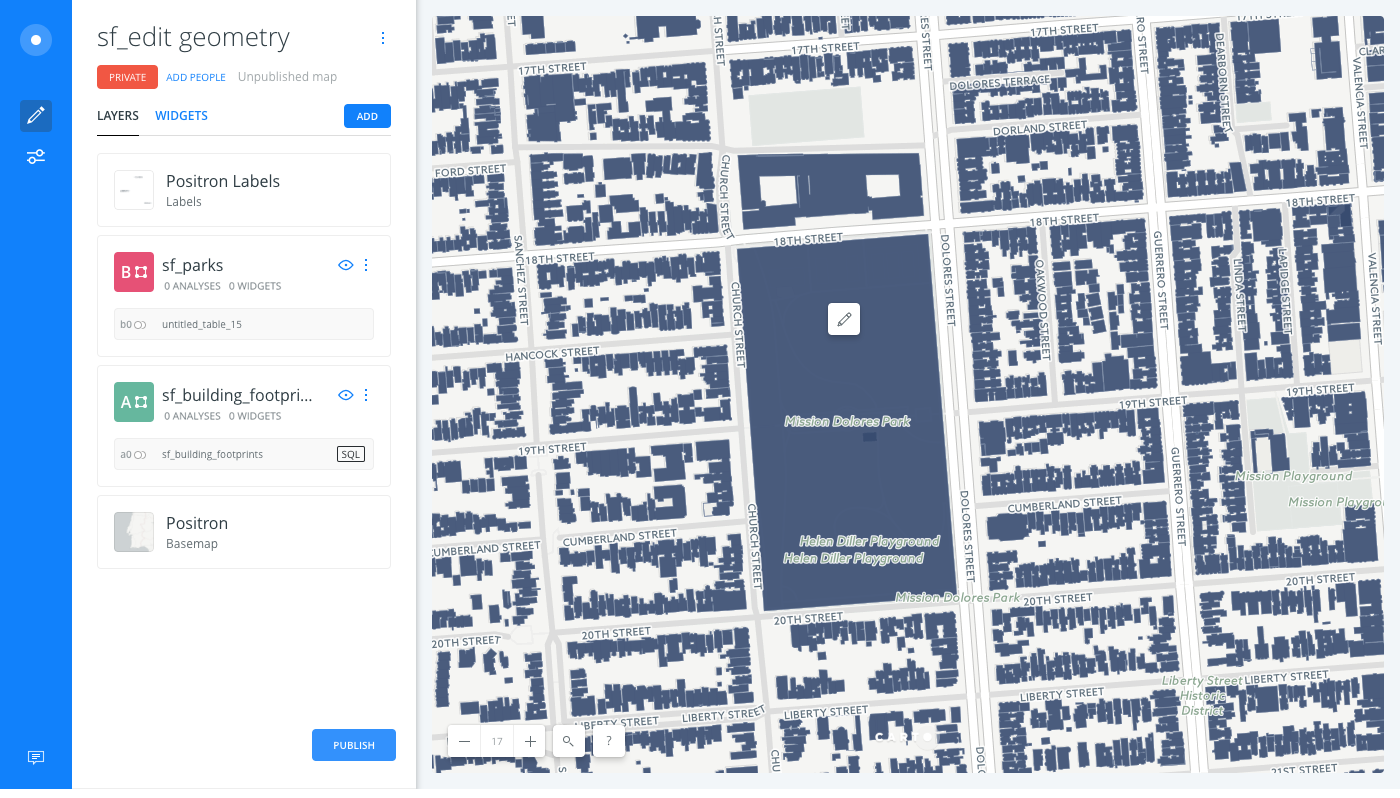
- Import the template .carto file, packaged from “Download resources” of this guide and create the map. Builder opens with sf_building_footprints as the first map layer containing polygon geometries, and an empty dataset as the second map layer (sf_parks).
Click on “Download resources” from this guide to download the zip file to your local machine. Extract the zip file to view the .carto file(s) used for this guide.
- From the sf_parks map layer, click the polygon icon from the Map View.
![]()
- Click the search location magnifying glass from the Map View. This enables you to search for named locations and add points. Type Mission Dolores Park, San Francisco, CA and press Enter.
The map moves to the matched location and displays a marker.
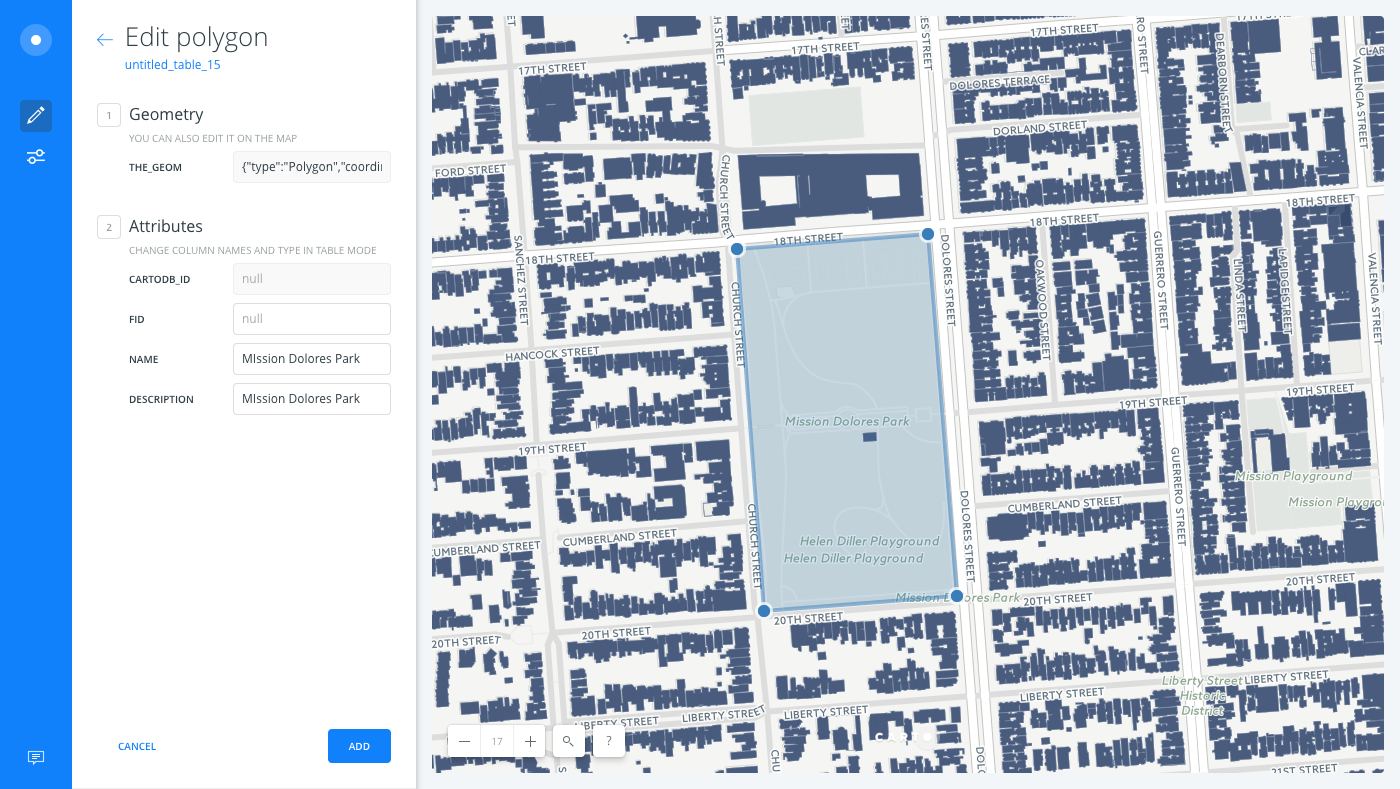
- Start clicking on the map to draw the polygon around the park. You may need to adjust the zoom level of the map. (There is an icon to Center map on layer, located next the layer name.)
The Geometry and Attributes options appear, where you can enter the NAME and DESCRIPTION for the polygon. For this example, use the park name. These are the fields that will be added to your dataset.

- If you are drawing a point, only a single segment can be added at a time.
- If you are drawing a line, click to add each segment of the line.
- If you are drawing a polygon, you must select a minimum of three segments to create the polygon. Click and drag to move segments. You can also edit segments in the middle of the polygon.
- Click ADD to create the polygon. Mission Dolores Park is added to your map as a new polygon.
Managing Data by Editing Geometries
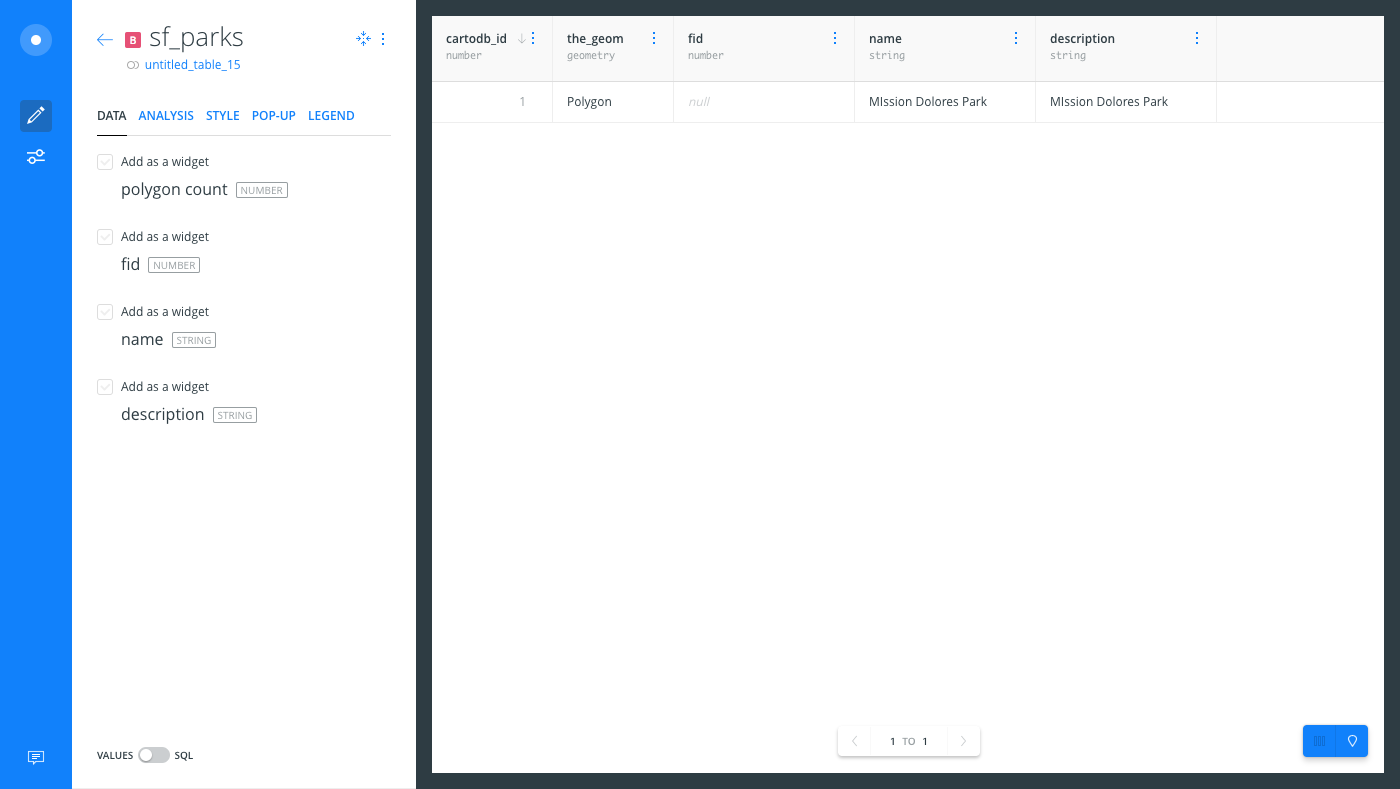
Suppose you want to edit the attributes of the polygon on your map. You can edit the geometry directly from the Map View, or you can edit the data from the Data View of your map layer.
The Data View and Map View appear as buttons on your map visualization when a map layer is selected. Click to switch between viewing your connected dataset as a table, or show the map view of your data.
To edit the feature in the Map View:
-
From anywhere in Builder, click on the Mission Dolores Park polygon directly from the map visualization.

-
Click the edit icon. The Geometry and Attributes options for the selected polygon appear. You can modify any of the column attributes and SAVE your edits.
To edit the feature in the Data View:
- From the LAYERS list in Builder, select the sf_parks map layer and click Data View to view the dataset as a table. The added polygon geometry appears.

You can apply styling to map layers, add widgets, or even merge this map layer into the sf_building footprints layer with the Add Columns from 2nd Dataset analysis.
If you are using the dataset in other maps, the added geometry is included for those maps. Any analysis, or widgets, related to the data are automatically updated.