Creating an empty dataset
Adding rows and columns in the Data View with CARTO Builder.
When a file is imported to your account, your data is transformed into a table that can be processed by CARTO. The Data View of a connected dataset includes formatted columns and indexes required for rendering your visualization.
You can manage connected datasets through your Data page, which enables you to add rows, add columns, edit cell values, change the data type of a column, export your dataset, and even use SQL to modify your data.
For this guide, let’s look at tech companies in Brooklyn, NY and learn how a basic table schema is created. There are no files to download for this guide, as we are building data from scratch by connecting an empty dataset and adding data manually.
Create an Empty Dataset
If you prefer to create a new dataset from scratch, create an empty dataset and add metadata by adding row and column values.
-
Login to CARTO and navigate to your Data page.
-
Click New Dataset. The CONNECT DATASET options appear.
-
Click CREATE EMPTY DATASET. An empty dataset containing the default CARTO columns and indexes is created.
-
Double-click on the untitled table name to rename it to
Tech Co. You can also change the privacy settings, if applicable.
The dataset name context menu contains more options to manage your data. Use the Edit metadata options to include attributions about your data.
Let’s start adding data!
Add Rows and Columns
In this section, we will rename some of the existing columns, add new columns, and add row values.
-
Rename the following columns. Double-click on the column heading
nameand entercity. You will get confirmation message before renaming a column. The column is created using the string data type by default. Double-click on the column headingdescriptionand change it tostate. -
Add
address,zip code, andcompanycolumns. From the right side of the Data View, click ADD COLUMN to create a new column. Double-click on the column name and typeaddress. Repeat the process for the columnszip codeandcompany. -
Add Row values. Each row represents unique entries defined by the
cartodb_idcolumn. Any cell without data entered will be shown as null. From the right side of the Data View, click ADD ROW. Double-click in a row to add a value. For this example, enter the company location ofCARTOas201 Moore Street, Brooklyn, NY 11206in each of the respective columns.
Each row context menu enables you to edit the cell, and add, copy, or delete the row.
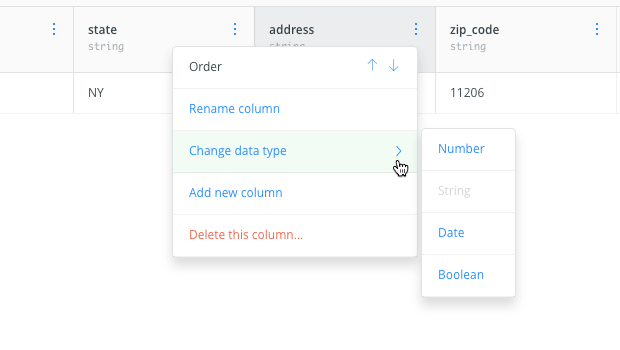
You can also select the Rename column option from the column name context menu. Other options include the ability to change the sort order of the column data, change the data type of the column, and add or delete a column.
Change Data Type
Since certain map options are rendered based on the column data type, it is a good practice to confirm that the correct data type is assigned to the column.
This feature is especially useful since you can style map layers by column values in CARTO Builder. The resulting style options vary, depending on the data type of the column you selected. For example, suppose you want to animate a map using time-series data, confirm that the connected dataset contains a Date column.
- When you upload your data to CARTO, it automatically assigns a data type to your column; such as string, number, date, or boolean.
- When adding columns manually, it automatically assigns the string data type.
-
Select Change data type from the column name context menu and select from the available options. (Options may vary, depending on your data).
For this example, keep the default String data type for all columns.
Now that we have confirmed that the column data type is correct, let’s create a map from the dataset.
-
Click CREATE MAP to create a map directly from the dataset.
The connected dataset appears as the first map layer in Builder. Notice that there is no geometry since the_geom column of our dataset contains null values. No problem! We can geocode our data to convert text to geometries.
Geocode by Postal Codes
By default, CARTO stores geospatial data using the_geom column. This column displays the latitude and longitude in a single projection, using the WGS84 cartographic method. For this example, let’s visualize location data by using the zip_code column to geocode postal code points.
CHEATSHEET: Geocode Types
The following types of location text can be geocoded and applied to your data:
- Latitude and Longitude: Generates location points using two parameter columns, one for latitude values and one for longitude values.
- Cities: Generates location points using a single parameter column with city name values. For greater accuracy, you can specify a column to be used for the Administrative Region names, or alternatively, specify a column for country names. For both Administrative Regions and country names, you can enter custom values by typing in the name (if the data is within a single region or country. For example, manually type in and select `United States`).
- Countries: Requires a single parameter column with country names to generate location border geometries as polygons.
- Administrative Regions: Requires a single parameter column with administrative region names to generate location points. You can also specify a column to be used for country names (if all are unique), or alternatively, type in the custom country name.
- Postal Codes: If your dataset consists of a column with postal codes, this option geocodes those values to generate location points. Your input data must be a text column. You can also specify a column to be used as a country names, similar to the Administrative Regions option. For specific details about how CARTO geocodes US zip codes, see the Postal Code Geocoder section in the Data Servies API documentation.
- IP Addresses: Geocodes your data into point geometries for IP addresses. This is useful if you are analyzing location data based on a set of user’s IP addresses.
- Street Addresses: Geocodes your data into a point geometry for a street address. You can specify the column to be used for the street addresses, in addition to the columns to be used for the city, state and country. You can also specify custom fields using the Advanced Mode.
The Geocode analysis is subject to quota limitations and extra fees may apply. Please request a demo if you are interested in enabling this service for your account.
-
Click GEOCODE from the tech co map layer. If you switch to the Data View, you will notice that
the_geomcolumn contains null values, even though there is an address, city, state, and zip code column. -
Change the geocode TYPE to Postal Codes and apply the following parameters. For the POSTAL CODE option, select the
zip_codecolumn from your dataset. For the COUNTRY, add a custom column by typing United States. Click to add it as the custom value. Click APPLY. If you check the Data View, you will notice thatthe_geomindicates the geometry is a point.
For specific details about how CARTO geocodes postal codes, see the Postal Code Geocoder section in the Data Servies API documentation.
Editing Data from Builder
Suppose you want to edit data and add another row, you can access the original dataset directly from Builder.
After an analysis has been applied, you cannot edit data from the Data View in Builder. This is intentional by design, as analysis nodes act like sublayers in association with each map layer that they are applied to. The original dataset is unchanged.
If you want to edit the original dataset after an analysis was applied, you must do so from Your datasets dashboard. There is also a shortcut to open the original dataset from a map layer.
-
When the tech co map layer is selected, the name of the connected dataset appears underneath the layer name as a link.
-
Click on the
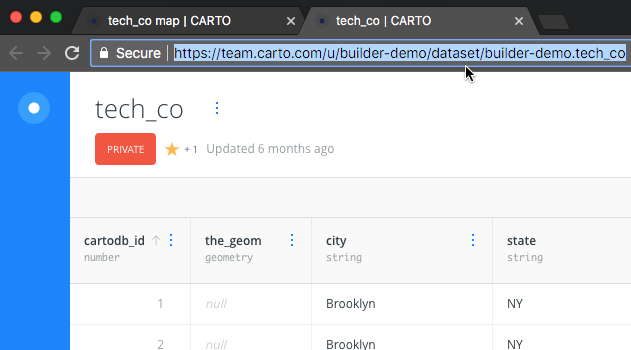
tech_colink.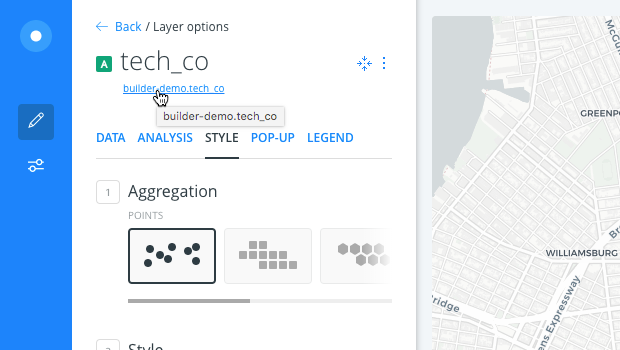
The connected dataset opens in a new tab, enabling you to edit values or add rows and columns.
Any changes applied to your dataset are automatically reflected in your map. For example, if I add a new row of data, the next time I refresh the map in Builder that uses this dataset, the analysis will rerun since my dataset was updated!