Editor FAQs - Infowindows
How to add custom images to infowindows?
To use your own images for customizing your infowindows at CARTO:
-
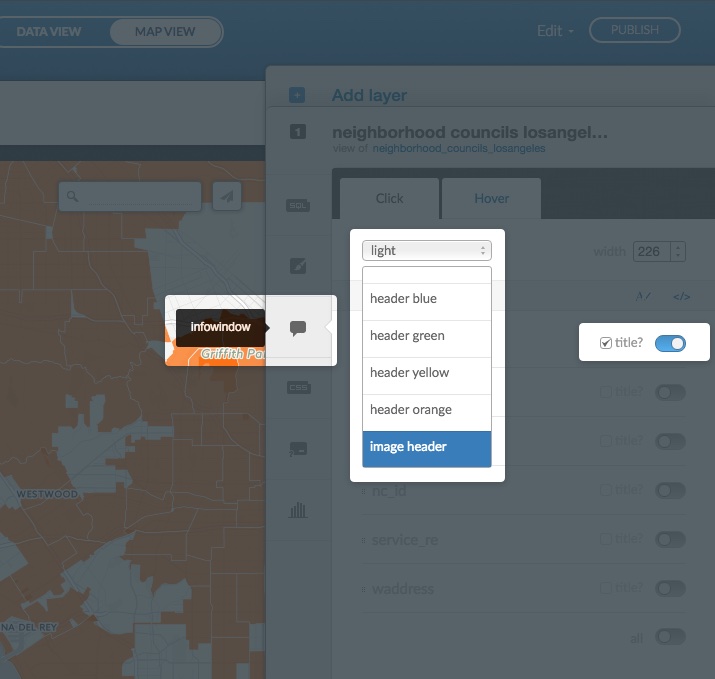
Select infowindow from the CARTO sidebar of your maps dashboard
-
Select image header from the drop-down list
-
Ensure that you have a ‘string’ column in your dataset and define the column with the URL of the image you want to show in the image header
-
From the infowindows options, a list of all the dataset columns appear. Click and drag this defined URL column to be the first column in the infowindow list and activate the column (with the slider button)
How to customize infowindows with the CARTO Editor?
The map infowindows options enable you to toggle the view with the Change HTML option. You can edit the layout, write static content, and embed external resources directly in the HTML code. Click Apply to apply your custom HTML code to the infowindow. Infowindows is available from the CARTO sidebar of the Map View.
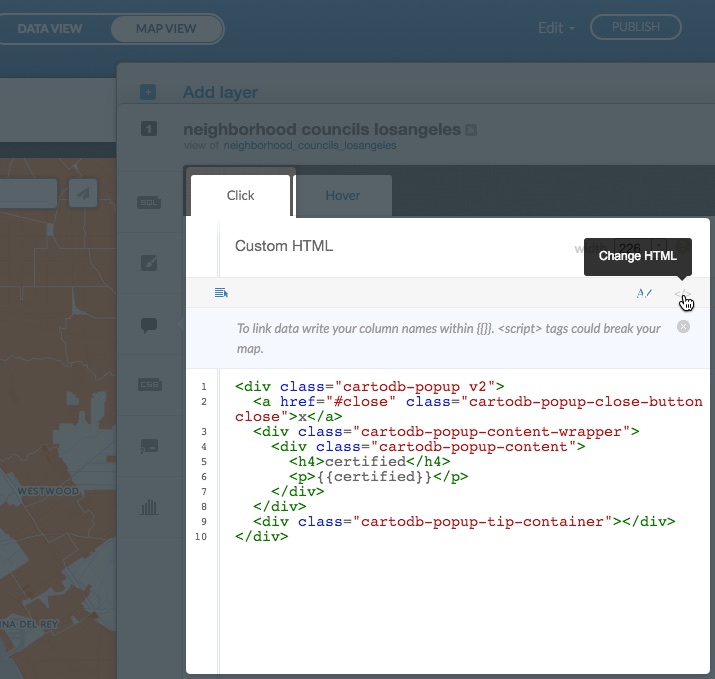
There is a tip icon next the width field when Change HTML is selected from infowindows.
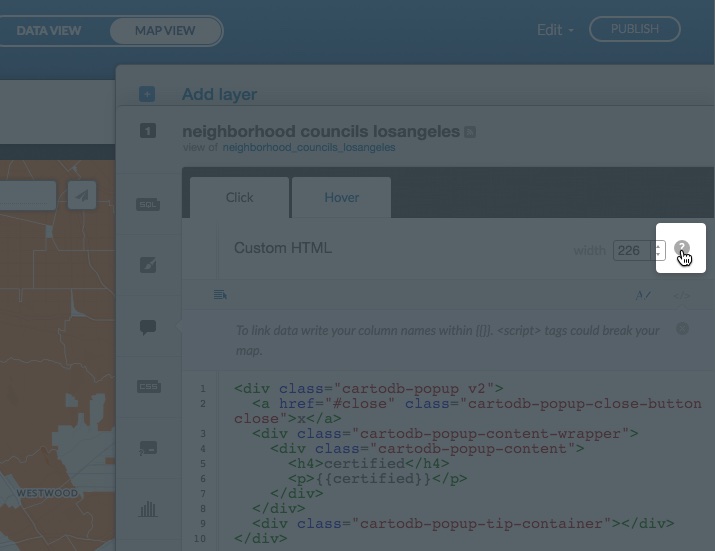
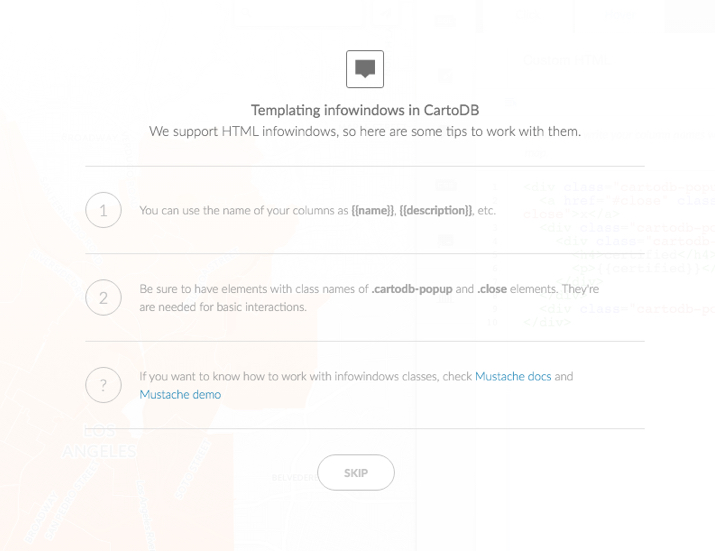
Click to view additional guidelines and examples for creating HTML infowindows.
Tip: For more information about infowindows, see the Full editing of infowindow HTML blogpost.
How can I use CARTO.js (v3.15) to create and style infowindows?
The workflow for creating infowindows with CARTO.js (v3.15) varies, depending if you are using createLayer() to customize infowindows for multiple layers of your map, or createVis() to customize the infowindow for the map_id DOM object only.
Creating an infowindow with the createLayer() function
The CARTO.js createLayer() function offers the most options for customizing infowindows. You can create an infowindow with a single layer, create an infowindow for sublayers, and create an infowindow with data from several different datasets. This is the suggested workflow:
1) Include your infowindow styles in the CARTO stylesheet
The default CARTO infowindow styles are predefined in the stylesheet code. Reference the CSS library for the latest CARTO stylesheet code for infowindows. Optionally, you can include your own CSS as part of the stylesheet.
2) Create your map in the HTML file, as described in the Getting Started section of the CARTO.js documentation
- Enable/Disable the infowindow functionality for a map object with the
cartodb.createLayer(map, layerSource [, options] [, callback])method. This is done by specifying the value astrue(enabled) orfalse(disabled) for the infowindows argument.
3) Create infowindows for your map
Add an HTML template for your infowindow. You can include this script in the HTML file, following the infowindow CSS code.
<script type="infowindow/html" id="infowindow_template">
                <div class="cartodb-popup">
         <a href="#close" class="cartodb-popup-close-button close">x</a>

             <div class="cartodb-popup-content-wrapper">
               <div class="cartodb-popup-content">
                 // fields to show
               </div>
             </div>
             <div class="cartodb-popup-tip-container"></div>
          </div>
        </script>
4) Enable infowindow interactivity for the sublayer.infowindow method to access the SQL and CSS of your map layer
Note: This step varies, depending on if you are creating an infowindow with one layer, for sublayers, or with data from more than one dataset.
5) Define infowindow parameters with cartodb.vis.Vis.addInfowindow(_map, layer, fields [, options]_)
Note: See cartodb.vis.Vis.addInfowindow(_map, layer, fields [, options]_) to ensure that you are defining all of the requirements. This example displays how to trigger infowindow interactivity with the “click” action. To create an infowindow with the “hover/tooltip” action, see this `vis.addOverlay() example.
Creating an infowindow with one layer
To add an infowindow to a single layer, use the cartodb.createLayer() function.
<html>
  <head>
    <title>createLayer + infowindow</title>
    <meta name="viewport" content="initial-scale=1.0, user-scalable=no" />
    <meta http-equiv="content-type" content="text/html; charset=UTF-8"/>
    <style>
      html, body, #map {
        height: 100%;
        padding: 0;
        margin: 0;
      }
    </style>
    <!-- include cartodb css  -->
    <link rel="stylesheet" href="https://cartodb-libs.global.ssl.fastly.net/cartodb.js/v3/3.15/themes/css/cartodb.css" />
    <!-- include CARTO.js library -->
     <script src="https://cartodb-libs.global.ssl.fastly.net/cartodb.js/v3/3.15/cartodb.js"></script>

  </head>
  <body>
    <!--  define a map object-->
    <div id="map"></div>


    <script>

      function main() {

        // create leaflet map and define some properties
        var map = L.map('map', {
          zoomControl: false,
          center: [43, 0],
          zoom: 3
        })

        // add a base layer to map
        L.tileLayer('http://tile.stamen.com/toner/{z}/{x}/{y}.png', {
          attribution: 'Stamen'
        }).addTo(map);

        // viz.json of the map
        var layerUrl = 'https://documentation.carto.com/api/v2/viz/dab13954-cac0-11e5-81d6-0ecd1babdde5/viz.jsonn';

        // add CARTO layer with one layer
        cartodb.createLayer(map, layerUrl )
          .addTo(map)
          .done(function(layer) {
            // add infowindow
            cartodb.vis.Vis.addInfowindow(map, layer.getSubLayer(0), ['pop2005', 'name'])
          });
      }

        // load main() function
        window.onload = main;

    </script>

  </body>
</html>
Creating an infowindow for sublayers
To add an infowindow to a sublayer, define the sublayers using the cartodb.createLayer() function by adding an array of layer source objects.
<html>
<head>
<title>createLayer_sublayer + infowindow</title>
<meta name="viewport" content="initial-scale=1.0, user-scalable=no" />
<meta http-equiv="content-type" content="text/html; charset=UTF-8"/>
<!-- include cartodb css -->
<link rel="stylesheet" href="https://cartodb-libs.global.ssl.fastly.net/cartodb.js/v3/3.15/themes/css/cartodb.css" />
<!-- include CARTO.js library -->
<script src="https://cartodb-libs.global.ssl.fastly.net/cartodb.js/v3/3.15/cartodb.js"></script>
<style type="text/css">
html,body,#map{
width: 100%;
height: 100%;
margin: 0;
}
</style>
</head>
<body>
<!-- define map object-->
<div id="map"></div>
<script>
// define map object
var map;
function main() {
//define map properties
map = L.map('map', {
zoomControl: true,
center: [-22.6285913, -42.9358045],
zoom: 3
});
// add OSM basemap to the map object
L.tileLayer('http://{s}.basemaps.cartocdn.com/light_nolabels/{z}/{x}/{y}.png', {attribution: '© <a href="http://www.openstreetmap.org/copyright">OpenStreetMap</a> contributors, © <a href="https://carto.com/attributions">CARTO</a>'}).addTo(map);
var sublayers = [];
var style = [
'#world_borders{',
' polygon-fill: #1a9850;',
' polygon-opacity: 0.8;',
' line-color: #FFF;',
' line-width: 0.5;',
' line-opacity: 1;',
'}'
].join('\n')
cartodb.createLayer(map, {
user_name: 'documentation',
type: 'cartodb',
sublayers: [
{
sql: 'select * from world_table',
cartocss: style
}
],
})
.addTo(map)
.done(function(layers) {
// define sublayer
var sublayer = layers.getSubLayer(0);
// add infowindow interactivity to the sublayer (show cartodb_id and name columns from the table)
cartodb.vis.Vis.addInfowindow(map, sublayer, ['name']);
// add basemap
L.tileLayer('http://{s}.basemaps.cartocdn.com/light_only_labels/{z}/{x}/{y}.png',{
attribution: '© <a href="http://www.openstreetmap.org/copyright">OpenStreetMap</a> contributors, © <a href="https://carto.com/attributions">CARTO</a>',zIndex:100
}).addTo(map);
})
}
window.onload = main;
</script>
</body>
</html>Suppose there are two or more layers, you need to define several sublayers and add one cartodb.vis.Vis.addInfowindow for each layer or sublayer, as shown in the following example:
var sublayer = layers.getSubLayer(0);
var sublayer1 = layers.getSubLayer(1);
var sublayer2 = layers.getSubLayer(2);
...
...
cartodb.vis.Vis.addInfowindow(map, sublayer, ['name']);
cartodb.vis.Vis.addInfowindow(map, sublayer1, ['name']);
cartodb.vis.Vis.addInfowindow(map, sublayer2, ['name'])
Creating an infowindow with data from different datasets
To show data from different datasets in an infowindow, you can use an SQL query inside the createLayer()function. The following example aggregates data from two tables where the country code is the same:
<html>
<head>
<meta name="viewport" content="initial-scale=1.0, user-scalable=no" />
<meta http-equiv="content-type" content="text/html; charset=UTF-8"/>
<style>html, body, #map { height: 100%; padding: 0; margin: 0 }</style>
</head>
<body>
<div id="map"></div>
<!-- include cartodb css -->
<link rel="stylesheet" href="https://cartodb-libs.global.ssl.fastly.net/cartodb.js/v3/3.15/themes/css/cartodb.css" />
<!-- include CARTO.js library -->
<script src="https://cartodb-libs.global.ssl.fastly.net/cartodb.js/v3/3.15/cartodb.js"></script>
<script type="text/javascript">
var layer;
function main() {
var map = L.map('map', {
zoomControl: false,
center: [20, 20],
zoom: 2
});
// add basemap
L.tileLayer('http://{s}.basemaps.cartocdn.com/light_nolabels/{z}/{x}/{y}.png', {attribution: '© <a href="http://www.openstreetmap.org/copyright">OpenStreetMap</a> contributors, © <a href="https://carto.com/attributions">CARTO</a>'}).addTo(map);
cartodb.createLayer(map, {
user_name: 'documentation',
type: 'cartodb',
sublayers: [{
sql: "select european.the_geom, european.the_geom_webmercator, european.cartodb_id, european.admin ,world_table.area FROM european, world_table WHERE european.adm0_a3 = world_table.iso3",
cartocss: "#world_table{ line-color: #FFF; line-opacity: 1; line-width: 1; polygon-opacity: 0.8;} #world_table[area <= 1638094.0] { polygon-fill: #B10026; } #world_table [ area <= 34895.0] { polygon-fill: #E31A1C; } #world_table [ area <= 24193.0] { polygon-fill: #FC4E2A; } #world_table [ area <= 10025.0] { polygon-fill: #FD8D3C; } #world_table [ area <= 6889.0] { polygon-fill: #FEB24C; } #world_table [ area <= 4808.0] { polygon-fill: #FED976; } #world_table [ area <= 3288.0] { polygon-fill: #FFFFB2; }",
interactivity: "cartodb_id"
}]
})
.addTo(map)
.on('done', function(lyr) {
cartodb.vis.Vis.addInfowindow(map, lyr.getSubLayer(0), ['area','admin'])
}).on('error', function() {
console.log("some error occurred");
});
}
window.onload = main;
</script>
</body>
</html>Creating an infowindow with the createVis() function
The CARTO.js createVis() function enables you to quickly create a two-layer map (containing a base layer and a CARTO data layer) and customize the infowindow for the map_id DOM object only. You must first enable interactivity for the infowindow object in the CARTO Editor before customizing the infowindow code. By setting up your map with createVis() and enabling infowindows in the CARTO Editor, you will be able to further customize your infowindow using CARTO.js; but not to extent of customizations that can be applied with createLayer(). This is the suggested workflow:
1) Enable infowindow functionality in the CARTO Editor with the CARTO sidebar
Note: You can also enable infowindow interactivity for the map object inside the createVis() code, by setting the infowindow argument to true (enabled) or false (disabled).
 cartodb.createVis('map',
    'http://documentation.carto.com/api/v2/viz/7eb2096a-51d9-11e3-89a7-5404a6a683d5/viz.json', {
      shareable: false,
      title: false,
      description: false,
      search: false,
      tiles_loader: true,
      infowindow: true, // enables the infowindows activated in the viz.json
      center_lat: 42,
      center_lon: -3,
      zoom: 6,
      legends: false
    })
See cartodb.createVis(_map_id, vizjson_url[, options] [, callback]_) for a description of the arguments and values.
2) Define the infowindow template
<script type="infowindow/html" id="infowindow_template">
                <div class="cartodb-popup">
         <a href="#close" class="cartodb-popup-close-button close">x</a>

             <div class="cartodb-popup-content-wrapper">
               <div class="cartodb-popup-content">
                 // fields to show
               </div>
             </div>
             <div class="cartodb-popup-tip-container"></div>
          </div>
        </script>
Note: Reference the CSS library for the latest stylesheet code.
Defining Click vs. Hover in your infowindow template: By default, the infowindows are enabled with the “click” action and overrides layer interactivity. If you are interested in creating a “hover” infowindow, you still need to define the infowindow options with cartodb.vis.Vis.addInfowindow, and specify additional parameters. This example displays how to create a “click” infowindow. If using the hover action, specify the tooltip parameters with vis.addOverlay. This example displays how to enable infowindow interactivity with the mouse “hover” action.
3) Access the sublayer infowindow to set various customized parameters, including the infowindow template
Declare the infowindow variable inside of the template by defining the infowindow in the visualization layer
var infowindow = layer.getSubLayer(0).infowindow;
            infowindow.set('template_type', 'underscore');
            infowindow.set('template', $('#infowindow_template').html());
Note: See sublayer.infowindow for a description of infowindows attributes for layers, or cartodb.Vis for how a visualization layer is returned.
Here are some complete examples of creating infowindows with the CARTO.js createVis() function. Note that the library and stylesheet used are version specific.
How can I modify the dimensions of my infowindow?
All of the stylesheet code for your infowindow is customizable by using CSS. Reference the CSS library for the latest CARTO stylesheet code that can be applied for infowindows. Optionally, you can include your own CSS as part of the stylesheet.
The default CARTO infowindow styles rely on sprites (image files) that predefine certain borders and shading as part of the .cartodb-popup-content-wrapper and .cartodb-popup-tip-container stylesheet code. You can modify these dimensions, and even include your own custom sprites as background images, by adding custom CSS dimensions in the <style></style> tags of your stylesheet.
Suppose you want to apply larger infowindow dimensions? You have to increase the width of the infowindow and subsequently, increase the margins of the infowindow container for correct placement. For example:
1) Specify the desired width as the div.cartodb-popup value
div.cartodb-popup div.cartodb-popup-content-wrapper
  width:407px;
  max-width:407px;
  padding:0 5px;
  background:url("http://vizzuality.github.io/icij/img/map/infowindow-content.png") repeat-y
  }
2) Modify the offset value of the container to enforce the correct placement of the, now larger, infowindow
div.cartodb-popup.v2 div.cartodb-popup-tip-container
  width:417px;
  background:url("http://vizzuality.github.io/icij/img/map/infowindow-bottom.png") no-repeat
  }
Note: The process for how to create an infowindow with CARTO.js varies, depending on if you are creating an infowindow with the “click” or mouse-over “hover” action.
How to apply custom placement of a hover infowindow?
When enabling infowindow interactivity with the mouse “hover” action. The hover action is referred to as a tooltip, and enables you to control the positioning. For details about how to create a hover infowindow with CARTO.js, see vis.addOverlay(). Note that you may define the type as tooltip or infobox:
-
tooltip (an infowindow that appears when you hover your mouse over a map feature. A tooltip appears where the mouse cursor is located on the map. You can customize the position of how the tooltip appears by defining the position options)
-
infobox (similar to a tooltip, an infobox displays a small box when you hover your mouse over a map feature. When viewing an infobox on a map, the position of the infobox is fixed, and always appears in the same position; depending on how you defined the position values for the infobox)
To apply custom placement, set the type: ‘tooltip’ or infobox (depending on the desired placement behavior), and define the position values in the CARTO.js code.
The following code displays how to modify the custom placement of a hover infowindow.
layer.leafletMap.viz.addOverlay({
  type: 'tooltip',
  layer: sublayer,
  template: '<div class="cartodb-tooltip-content-wrapper"><img style="width: 100%" src=>, , , </div>',
  position: 'bottom|right',
  fields: [{ name: 'name' }]
});
Tip: For more details about tooltip and infobox in CARTO.js, see Specific UI Functions.
How can I embed a video in an infowindow?
As part of our default security guidelines, you cannot embed a iframe with a video link from the CARTO Editor infowindow options. However, if you create a map using CARTO.js, you can disable the infowindow security feature and embed an video.
- Create a map using the JavaScript library from CARTO.js
- Disable the
sanitizeTemplateattribute of the infowindow when you create the HTML map. This is done by setting the value tofalse, disabling the infowindow security setting - You can then embed an iframe with a video link in your custom infowindow template - using your custom CARTO.js map
Tip: See this example block of code that creates a map with an infowindow (using the createVis CARTO.js library) and displays a YouTube video (where the video url is extracted from a CARTO dataset). Setting the sanitizeTemplate value to false disables the default setting, allowing you to embed an iframe, with a YouTube video, in your infowindow template.
Why is my infowindow showing an error?
If you are working on your map through a connection that is behind a firewall or proxy, some requests may be blocked. If requests are blocked, some parts of your map will not load. In some cases, this indicates that information you are trying to display in your infowindow will not appear. Infowindows is available from the CARTO sidebar of the Map View. For details, see infowindows in the CARTO Editor documentation.
As a workaround, use an HTTPS connection. HTTPS encrypts your data so that your firewall or proxy will not block these specific CARTO requests.