Editor FAQs - Torque
How do I create an animated map?
If you have a dataset that contains a column that describes the date when an event occurred, you can map this dynamically by using the Torque map option.
-
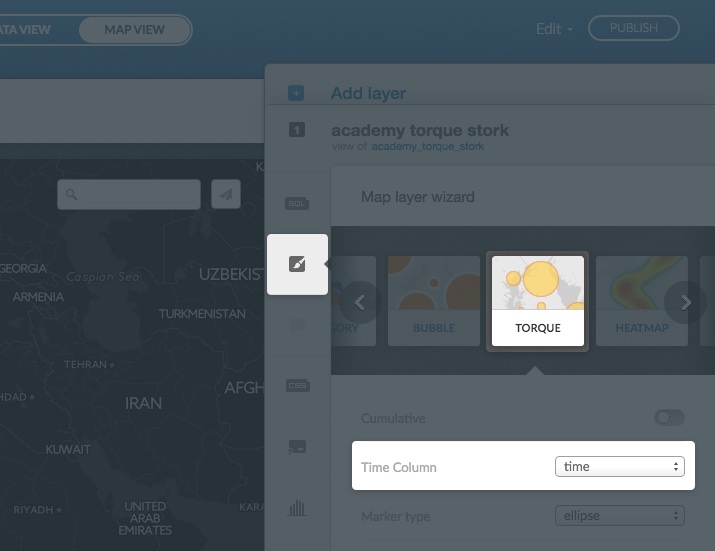
From the Maps view of a selected map, click wizards from the CARTO sidebar
The sidebar expands, displaying a list of style options based on your data.
- Select Torque as the map type
- Select time as the Time Column value
Can I apply interactivity with a Torque layer?
Torque layers do not have interactivity options. However, you can add a Torque layer on top of a static layer, to stimulate interactivity.
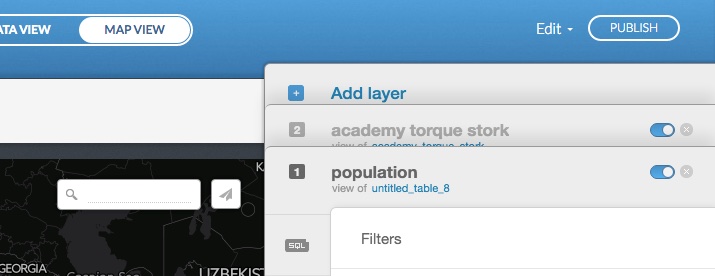
- Add one static layer where the marker opacity is very low (almost invisible)
- Add one Torque layer
- In order to keep all points on the map, apply the Cumulative option
Note: In the CARTO Editor, you can only add one Torque layer. Optionally, you can use Torque.js to add multiple layers, but this is not recommended as it effects performance.
How is the Torque Time Stamp Calculated?
The standard format of the Torque time stamp date column is YYYY-DD-MMThh:mm:ss. However, Torque maps can also visualize data that contains the year, year/month, or year/month/day format (but only if the complete timestamp is included). For example, year entered as 2014 will not work but the year entered as 2014-01-01T00:00:00Z will.
Note: You can run an SQL query to convert the timestamp if it only contains a year. This is useful if you are using an external dataset that may not include the entire timestamp as part of the year data.
UPDATE tablename set yearColumn = to_timestamp(yr_compl,'YYYY’)See the PostgreSQL documenation for more information about date/time types and data type formatting functions.
Do Torque maps move polygons/polylines?
No, Torque does not work with polygons. The Torque wizard is only available for points. Alternatively, there are other options that you could use to show different polygons with respect to time:
- The JavaScript API, Torque.js, enables you to add interactivity to your maps. Learn the basics of Torque.js reading this getting started guide course
- In combination with our SQL API, you can build a time-slider and show different polygons depending on how they evolve with respect to time
Tip: See an example of this time slider workaround.
My heatmap does not work in IE9?
This is a known issue. In order for a Torque heatmap to work, the browser it is being viewed from needs to support cross domain requests for images. Internet Explorer 9 supports cross domain requests for documents, but not for images. Ensure that you are using Internet Explorer version 10 or higher to view Torque heatmaps.