Example - Animating Point Data and making Rich Pop-ups
Learn how to create a time-enabled visualization that includes useful pop-ups using data pulled from Twitter with Builder.
You will need to import the following dataset/s into your account:
twitter_dogsdataset: twitter data based on dog breed search terms from 6/11/2017 - 7/10/17.
Import and create map
Import twitter_dogs file into your DATASETS dashboard.
- Download the dataset from here.
- Go to your account and import it using the NEW DATASET options.
- Select CONNECT DATASET.
- Drag and drop the file.
Dataset view
- Review the dataset.
- Take note of which columns seem to be the most useful/interesting things to display.
Click on CREATE MAP
- Change the name of the map to
Dogs of Twitter.- To change the name of the map, double click the title, enter your new title, and hit enter to save the new title.
- Change the name of the layer to
Dogs of Twitter.- To change the name of the layer, double click the title, enter your new title, and hit enter to save the new title.
- Click on the Basemap layer. Change the STYLE to
Dark Matter (Labels Below). - In the top left corner, press the back arrow to navigate back to the LAYERS pane.
Style
Styling Time-Based Elements
- After clicking on the Dogs of Twitter layer, it will direct you to the STYLE tab.
- Change the aggregation style to
Animated. - Set the style options as follows:
- FILL: click on the orange color bar, in the color wheel that opens, select
BY VALUE, style bycategory_terms. Color these as you see fit by clicking on the color in line with the term you want to change. - COLUMN:
postedtime.
- FILL: click on the orange color bar, in the color wheel that opens, select
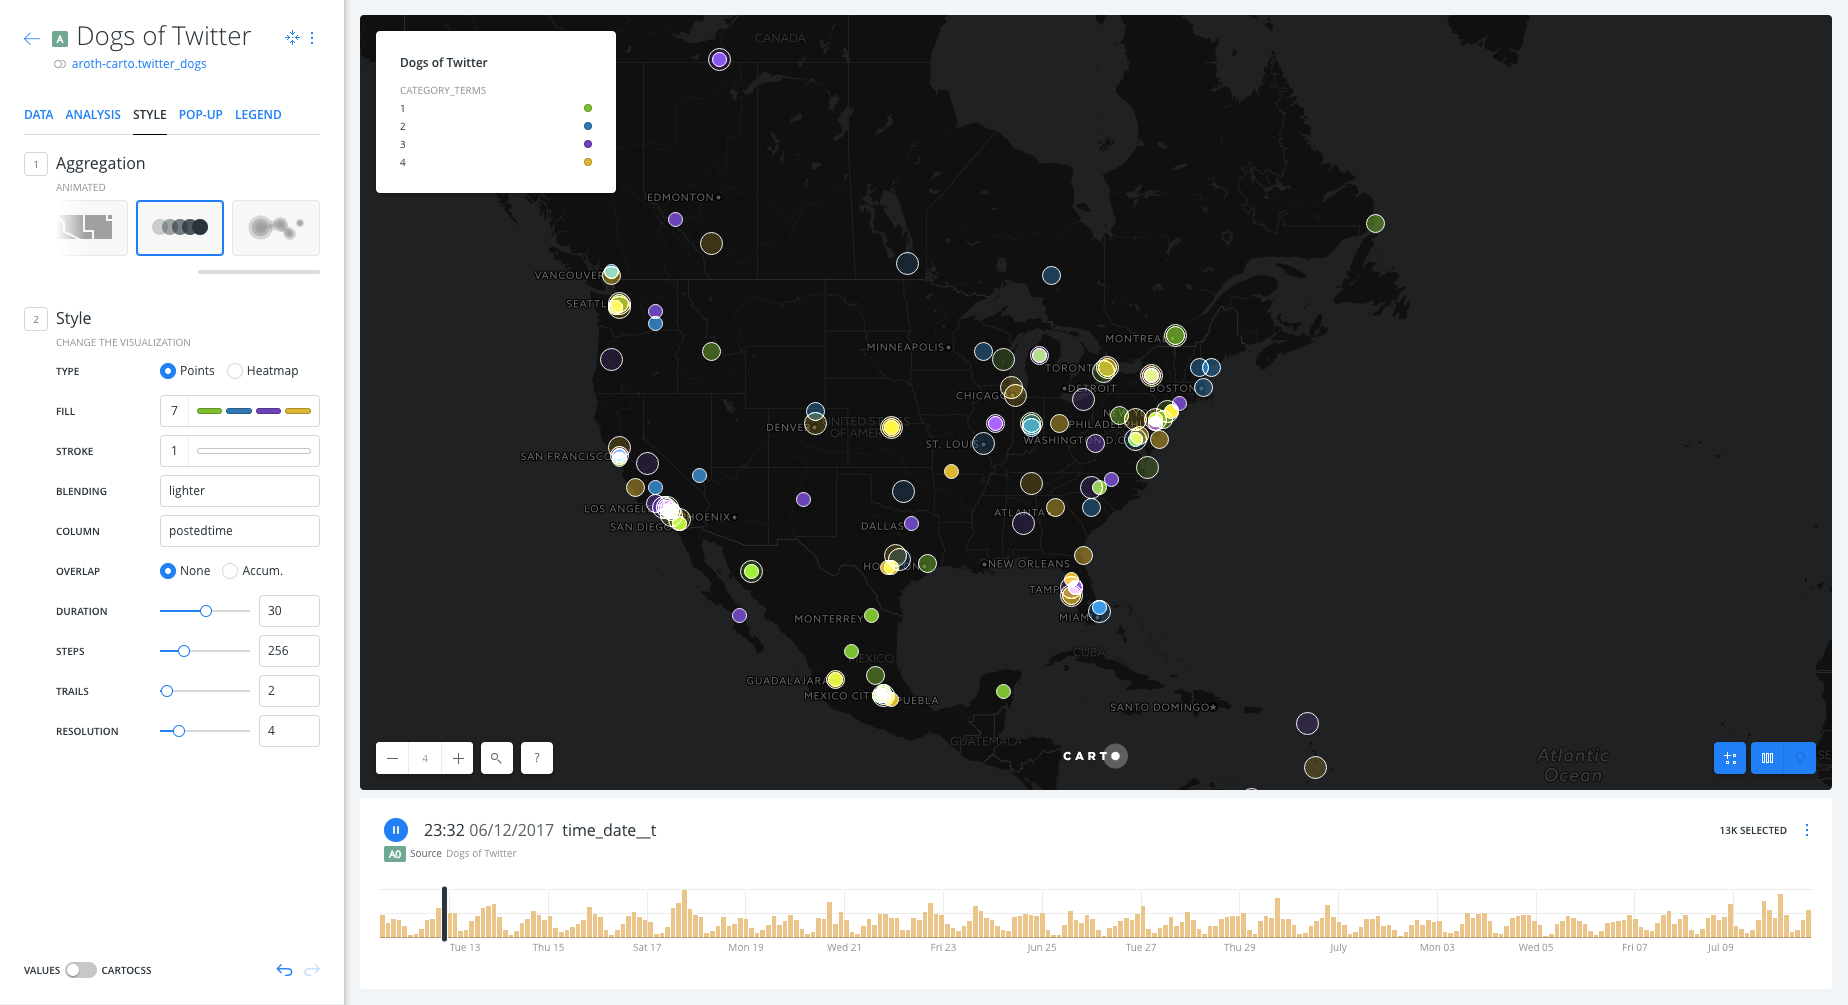
- Click on the LEGEND tab. Set the style to
CUSTOM. Check the box to add title and enterBy breedto give your legend enough detail to be useful.
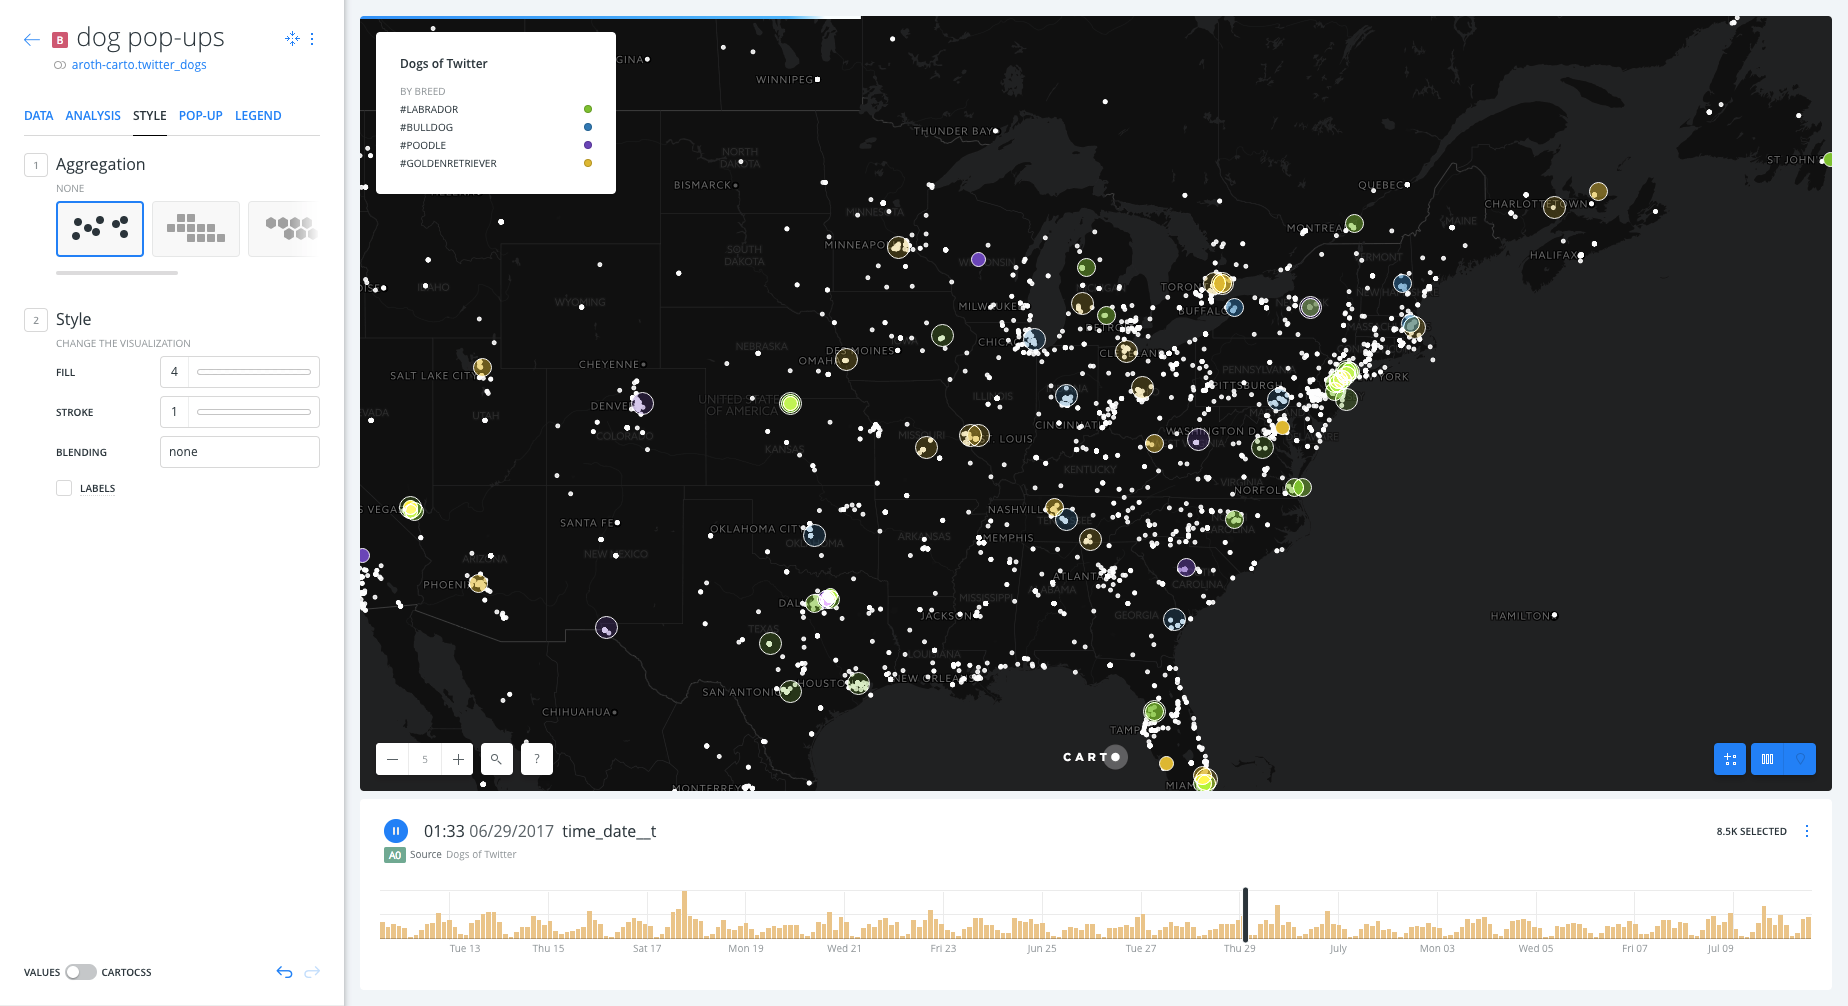
Styling Pop-ups
- Pop ups can’t be added to animated map layer, so we will need to add our
twitter_dogslayer again in order to enable pop ups in the new layer. - In the top left corner, press the back arrow to navigate back to the LAYERS pane.
- Click on ADD.
- Click on
twitter_dogs, click ADD LAYER in bottom right. - A new layer B has been added.
- Click into this new layer, rename it
dog pop-ups - Set the FILL SIZE to
4, set the FILL COLOR HEX to#ffffff(white).
- Click on the POP-UP tab
- In the CLICK pop-up menu, set style to
IMAGE - Check off the following items, and drag them into the order they are listed:
actor_image- This field needs to be first to make sure that it is read first as the image URL.
actor_displaynameactor_preferredusernamebodylink
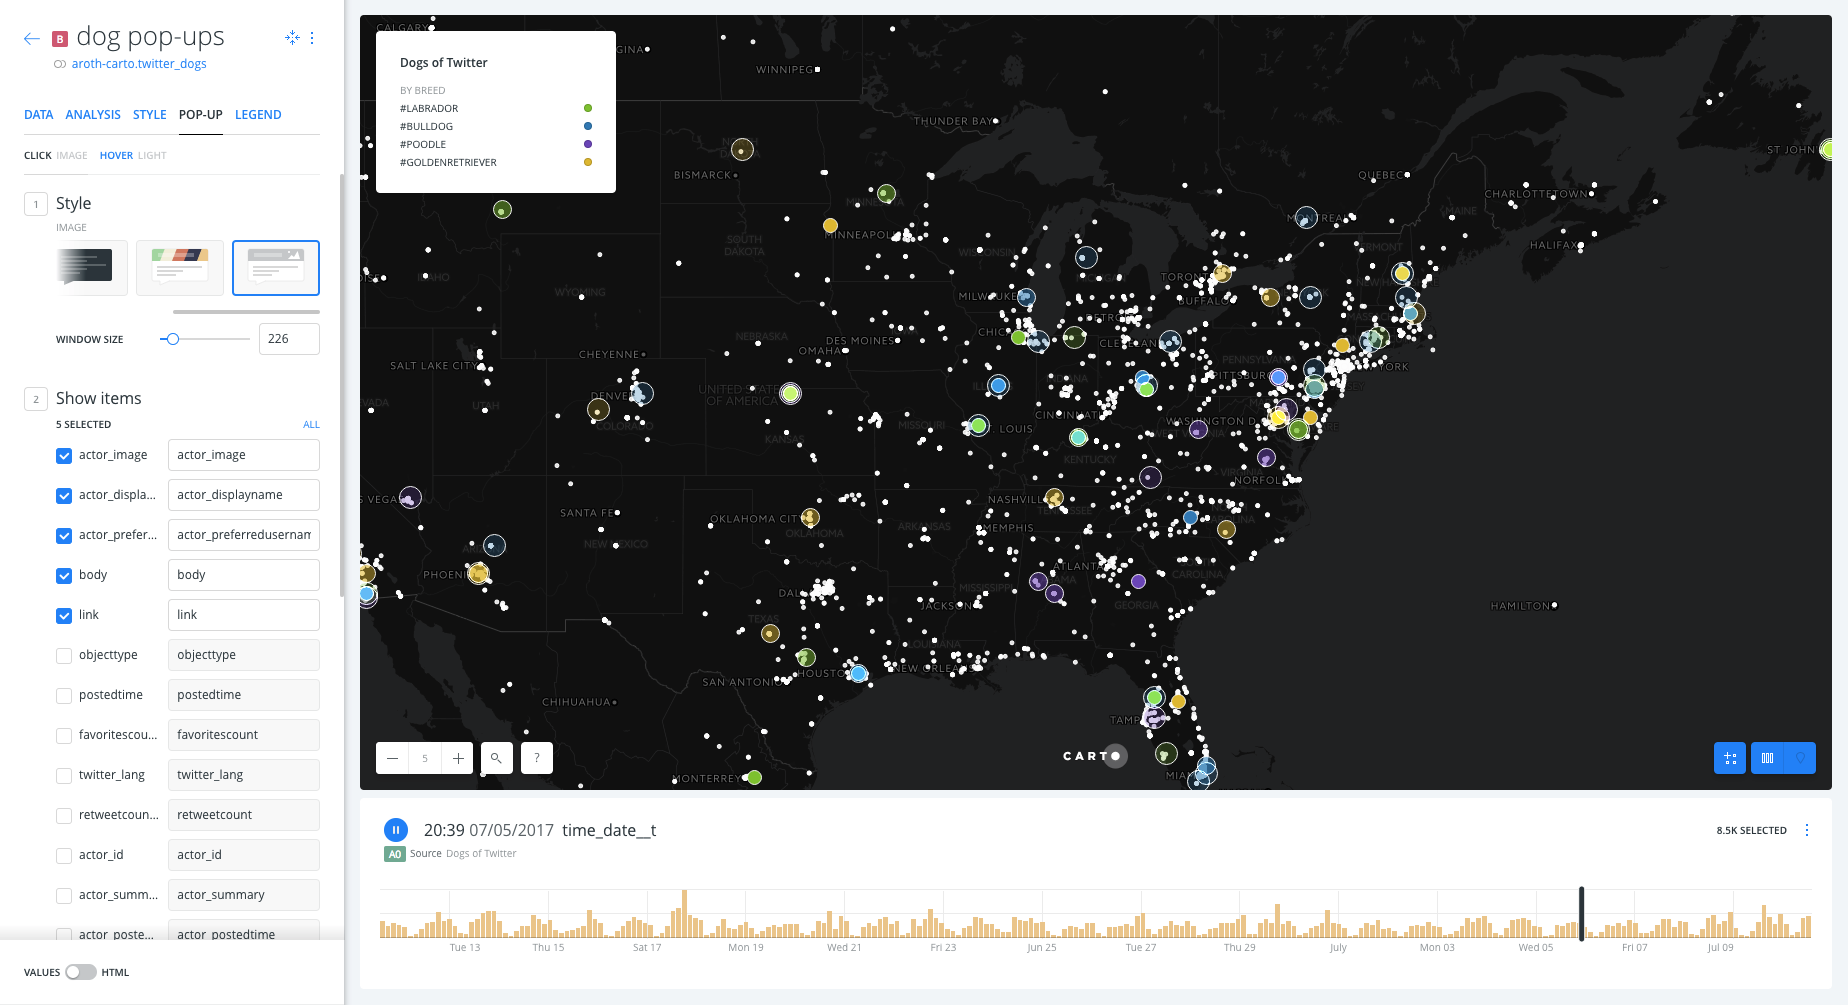
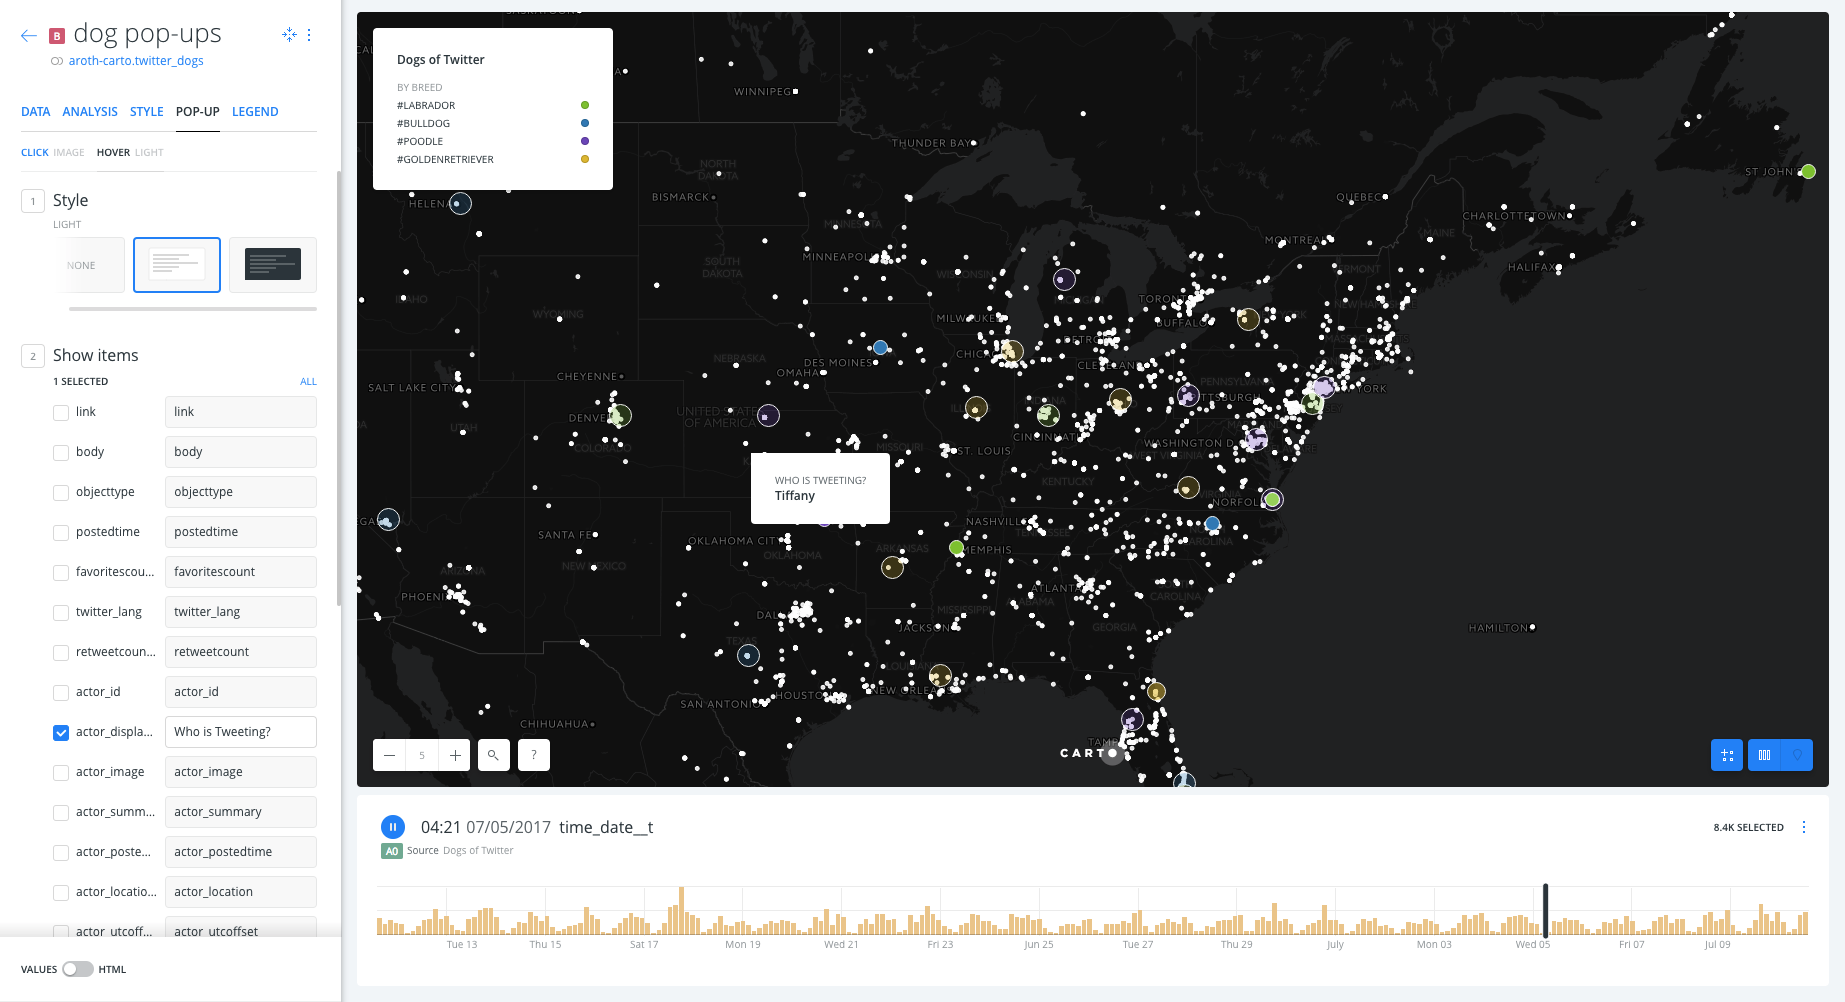
- In the HOVER pop-up menu, set style to
LIGHT - Check the box for
actor_displaynameand change the type field next to it toWho is Tweeting?
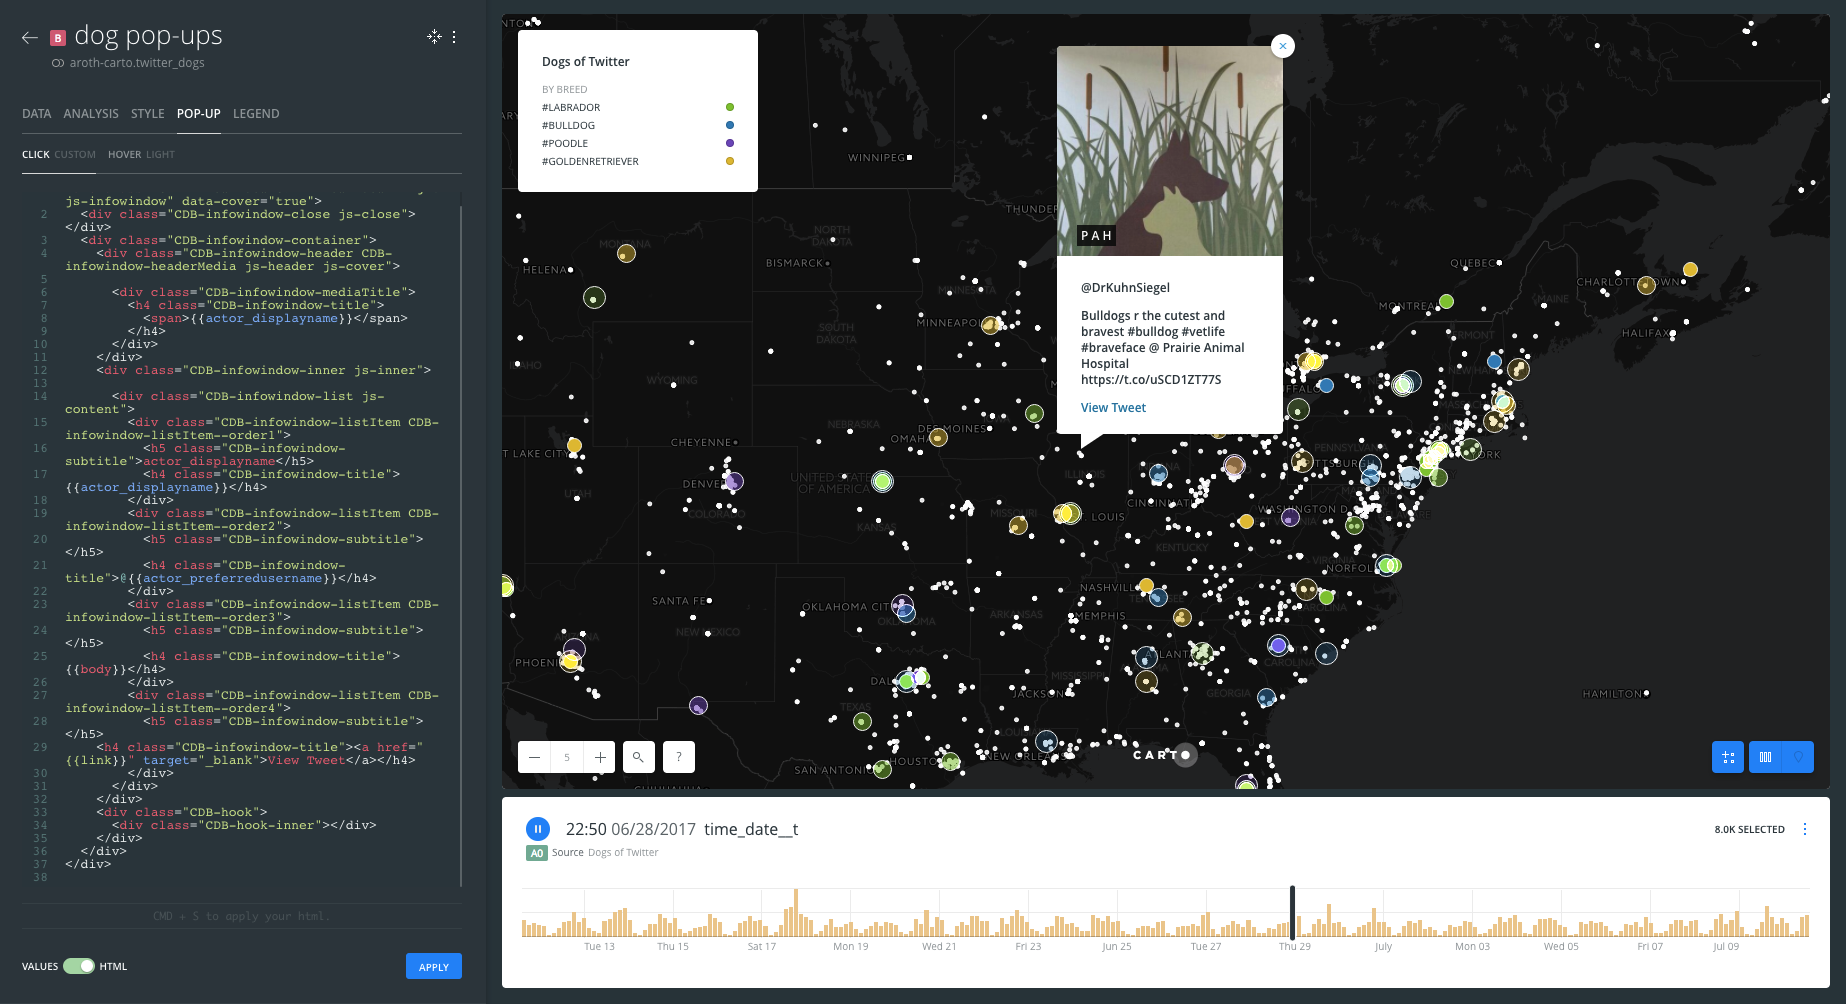
- Go back to the
CLICKpop-up menu, and use the bottom toggle to switch to HTML mode
Deleting the heading “actor_preferredusername” and adding an @ before the user name
- Find this piece of code:
<div class="CDB-infowindow-listItem CDB-infowindow-listItem--order2">
    <h5 class="CDB-infowindow-subtitle">actor_preferredusername</h5>
    <h4 class="CDB-infowindow-title"></h4>
and alter it as follows:
<div class="CDB-infowindow-listItem CDB-infowindow-listItem--order2">
    <h5 class="CDB-infowindow-subtitle"></h5>
    <h4 class="CDB-infowindow-title">@</h4>
Deleting the heading “body”
- Find this piece of code:
<div class="CDB-infowindow-listItem CDB-infowindow-listItem--order3">
<h5 class="CDB-infowindow-subtitle">body</h5>
<h4 class="CDB-infowindow-title"></h4>
and alter it as follows:
<div class="CDB-infowindow-listItem CDB-infowindow-listItem--order3">
<h5 class="CDB-infowindow-subtitle"></h5>
<h4 class="CDB-infowindow-title"></h4>
Making a clickable hyperlink that will open the linked tweet in a new browser tab
- Find this piece of code:
<div class="CDB-infowindow-listItem CDB-infowindow-listItem--order4">
    <h5 class="CDB-infowindow-subtitle">link</h5>
    <h4 class="CDB-infowindow-title"></h4>
and alter it as follows:
<div class="CDB-infowindow-listItem CDB-infowindow-listItem--order4">
    <h5 class="CDB-infowindow-subtitle"></h5>
    <h4 class="CDB-infowindow-title"><a href="" target="_blank">View Tweet</a></h4>
- Click APPLY.
Widgets
Add widgets
- Navigate to the WIDGETS pane.
- You will notice that your time slider is already present.
- Click ADD.
- In the options of the CATEGORY tab, check the
category_termswidget. Make sure you are adding a widget from theB0layer node. - In the options of the FORMULA tab, check
retweetcountandactor_followerscount, again making sure you are adding the widget with the source asA0.
- In the options of the CATEGORY tab, check the
- Click on CONTINUE.
Order and edit widgets
- Navigate back to the WIDGETS pane.
- Click the time_date_t widget.
- Change the title to When are people tweeting?.
- To change the name of the widget, double click the title, enter your new title, and hit enter to save the new title.
- You can also change the color of the widget time series bars if you would like by selecting the FILL color option at the bottom of the widget pane
- Change the title to When are people tweeting?.
- Click the retweetcount widget.
- Change the title to How popular are these tweets?
- Make sure the type is set to
FORMULA. - Change the OPERATION to
SUM(retweetcount) - Add the SUFFIX: ` retweets` to let your viewers know what the number they are looking at means.
- Be sure to include a space before
retweetsso your values will read12345 retweets, not12345retweets.
- Be sure to include a space before
- Widgets are only as good as the data you provide to them. You don’t always want the viewers to interpret what each item means. Go ahead and add a description for the widget. In this case, I am going to explain the purpose of a retweet. Here’s what I am saying:
A tweet's life cycle isn't done after it's been sent. Someone who sees a tweet and likes it can retweet it, and share it with all of their followers too! Talk about exponential spread!
- Click the category_terms widget.
- Change the title to What breed is most popular?
- Make sure the type is set to
CATEGORY. - Make sure your settings for the following are correct:
- AGGREGATE BY:
category_terms - OPERATION:
COUNT
- AGGREGATE BY:
- You can change the color of the widget bars now too if you’d like.
- Check the box for
CUSTOM COLORS, then click on the bar of colors that appears to the right. Pick 4 colors that you are able to differentiate at a glance for the first 4 categories. Since you only have 4 categories, the rest won’t matter.- What you have just set up is called Auto style. In the top right corner of this widget will be a blue water drop icon. Click it in order to change the styling of the white dots to show what category the tweets are in at a glance. Click it again to change the dots back.
- Click the actor_followerscount widget.
- Change the title to How many people saw these?
- Make sure the type is set to
FORMULA. - Change the OPERATION to
SUM(actor_followerscount). - Add the SUFFIX: ` people`.
- Be sure to include a space before
peopleso your values will read12345 people, not12345people.
- Be sure to include a space before
- Add a helpful description, here is mine:
If someone sends out a tweet, all of their followers get to see it on their timelines.
- From the widgets pane, you can reorder the widgets and how they are displayed on the map by dragging and dropping each widget option in the pane.
Publish and share map
- At the bottom of the layer pane, click on SHARE at the right button corner.
- Click on PUBLISH below the map name, then navigate to the PUBLISH tab in order to share our map.
- Once in the PUBLISH tab, we can see the different options for sharing the map, including a URL to a public map page and iframe embed code for sharing the map on an external website.
- Get the link URL and paste it on other browser tab:
https://public.carto.com/builder/7d6e13db-9a59-4882-bb65-a648e1f8b931/embed
- Get the link URL and paste it on other browser tab: