Example - Combining Builder Analysis and Styling Options to Create Maps
Learn how to display two different symbologies in the same layer.
You will need to import the following dataset/s into your account:
world_commercedataset: world country data from 2015 about economy and commerce.
Import and create map
Import world_commerce file into your DATASETS dashboard.
- Download the dataset from here
- Go to your account and import it using the NEW DATASET options
- Select CONNECT DATASET
- Drag and drop the file
Dataset view
- Take a look on the dataset
- Switch between the metadata and the SQL view, try any simple query like limiting the result.
Click on CREATE MAP
- Change the name of the map to World Economic and Commerce Data (2015) (double click!)
- Change the name of the layer to World Countries
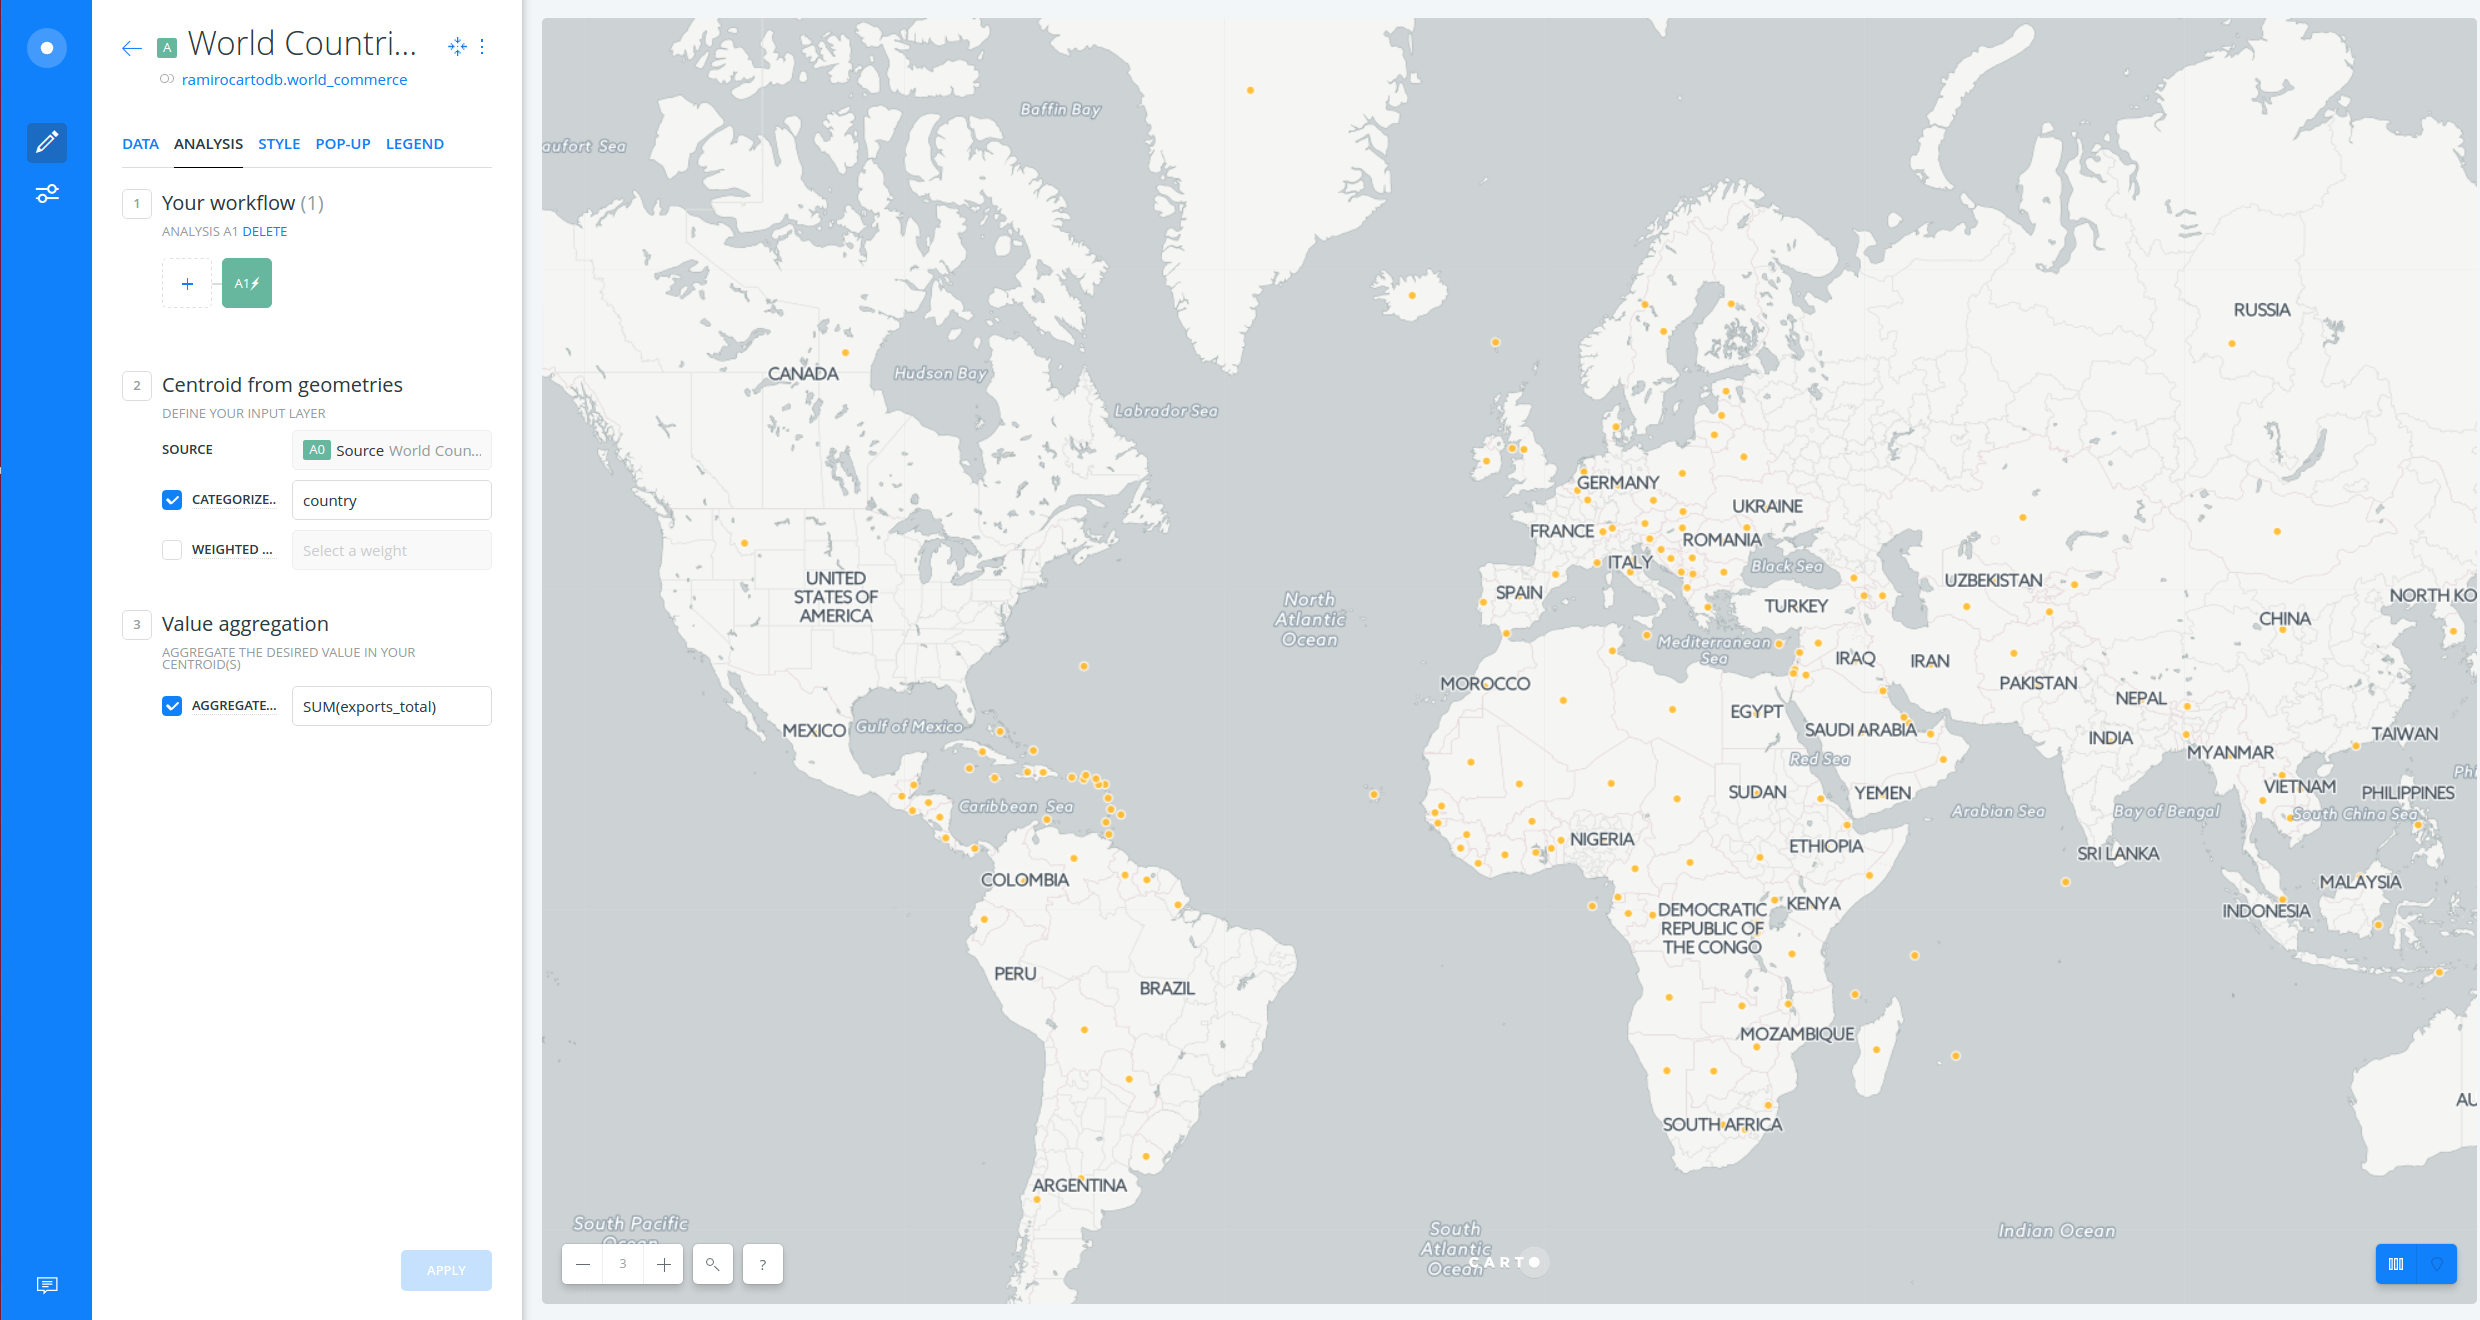
Get centroids
Find centroids of geometries analysis
- Click on World Countries layer and go to
ANALYSIStab - Click on
ADD ANALYSISbutton - Select
Find centroids of geometriesanalysis - Click on
ADD ANALYSISbutton and set the analysis parameters as follow:- CATEGORIZE..:
country - OPERATION…:
SUM(exports_total)
- CATEGORIZE..:
- Click on APPLY
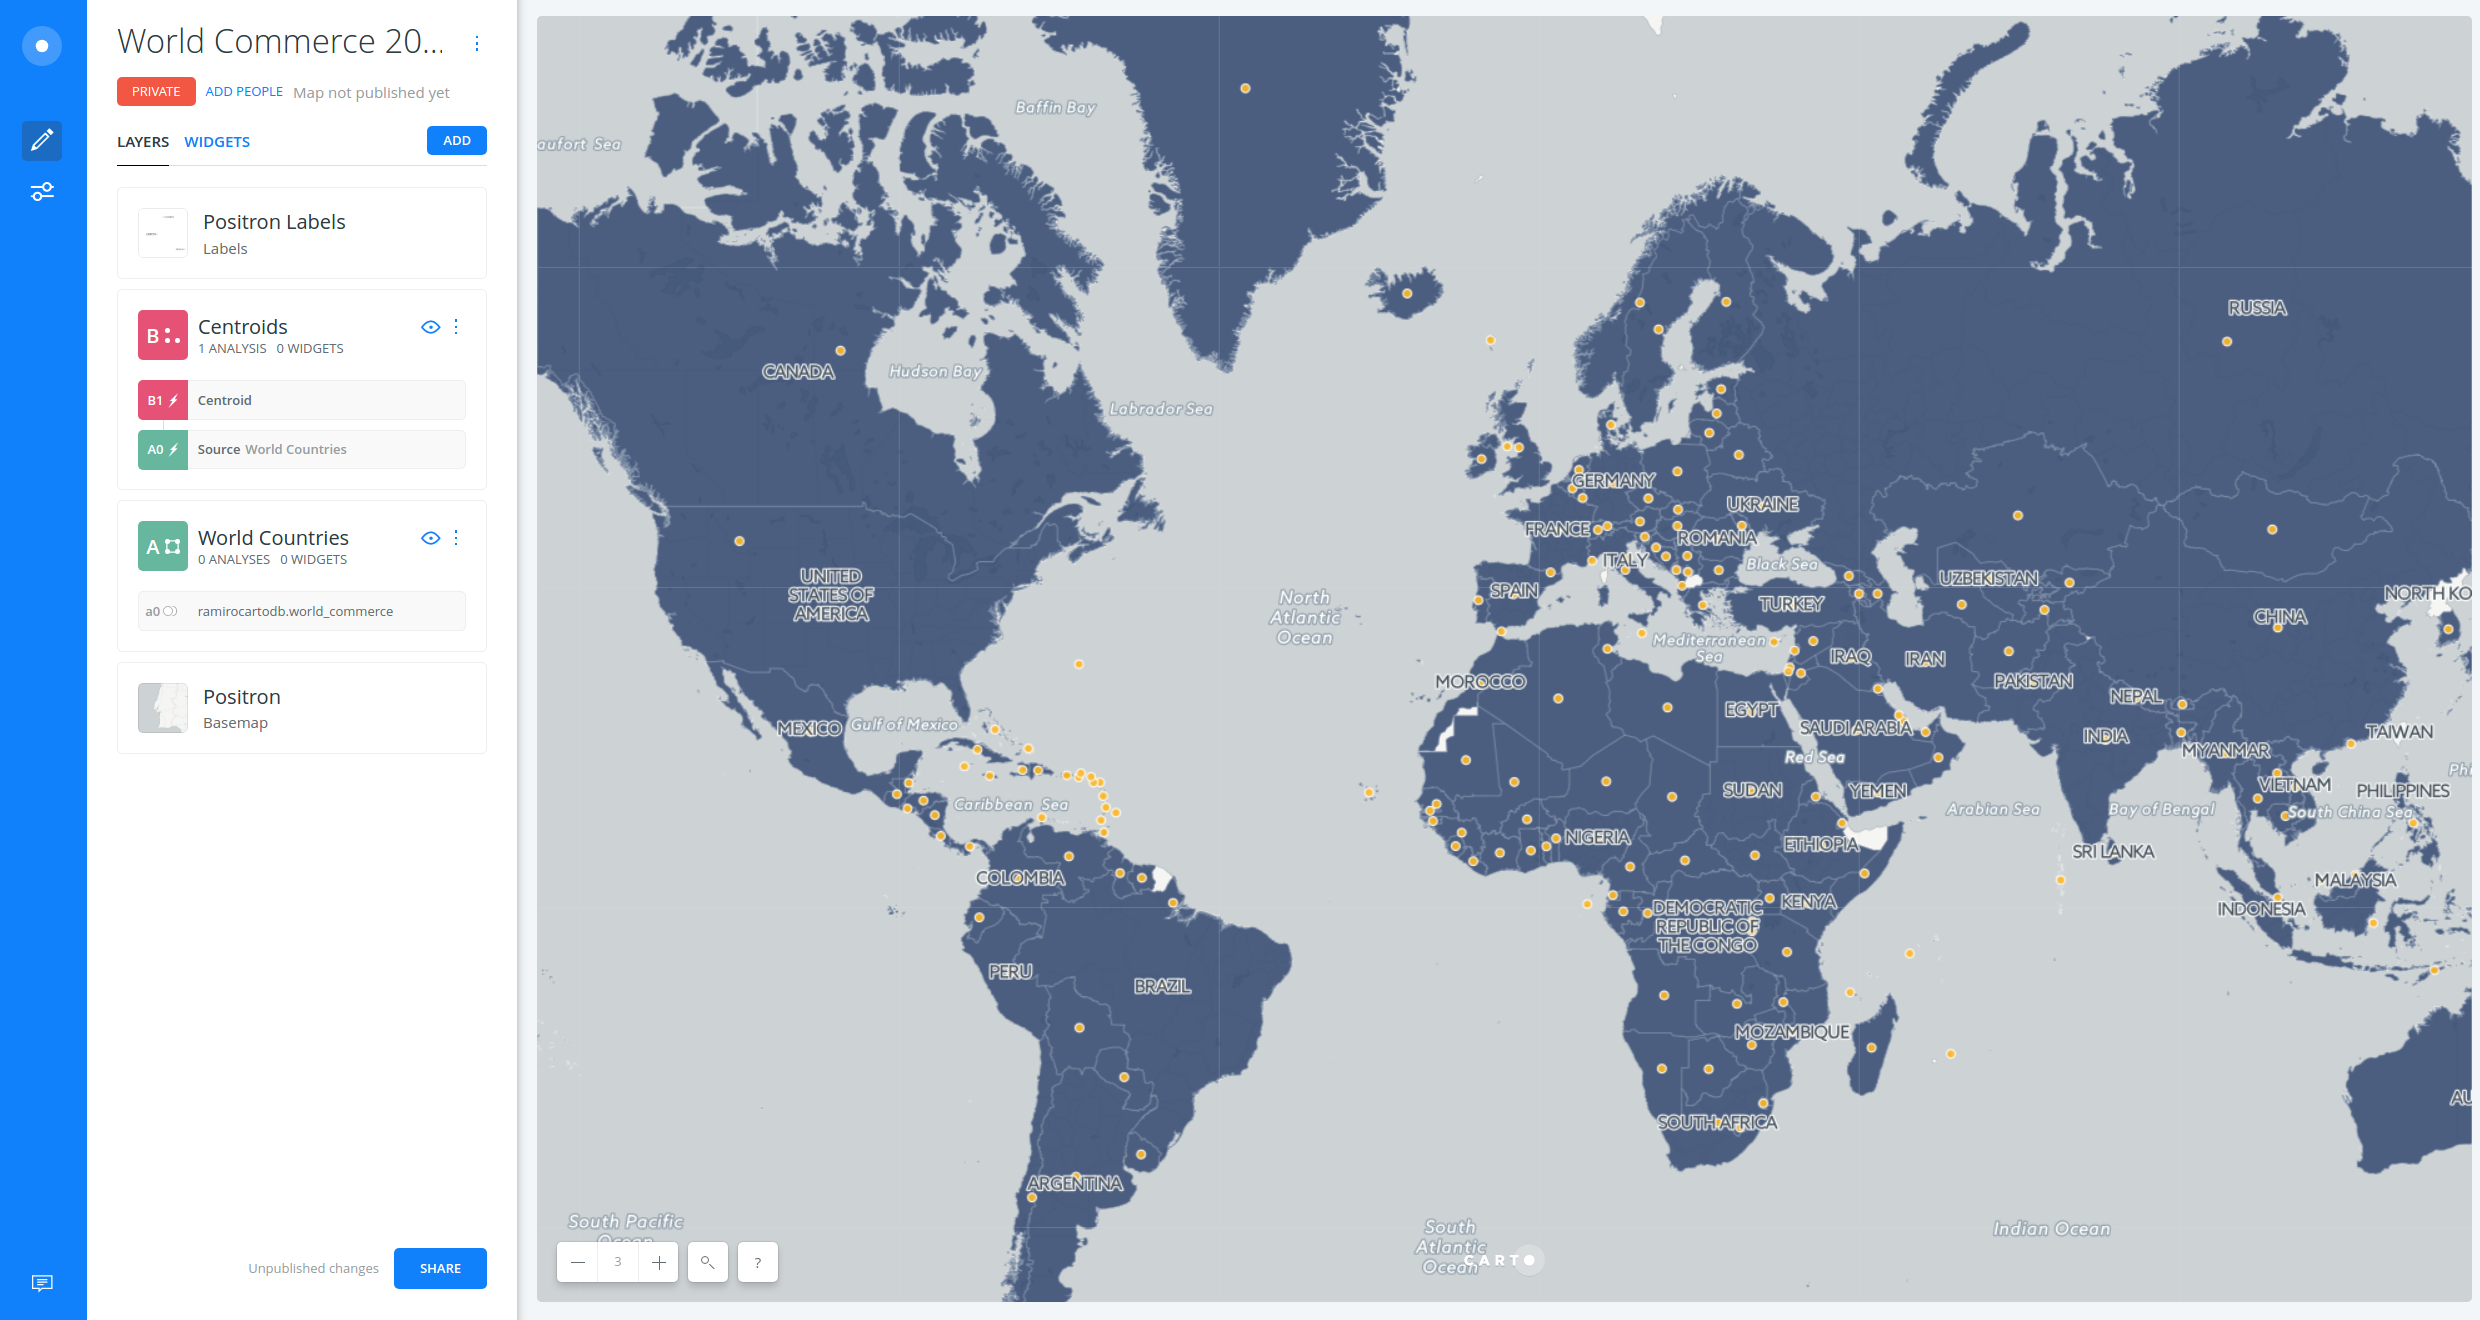
Recover the original layer
- Go back to the main menu and click and drag the
A1 Centroidanalysis node out (on top) - Now there are two layers*:
A World Countries(connected to the original dataset) - POLYGONSB Wolrd Countries(conneceted toA0as the original layer in which the centrodis has been generated) - POINTS
- Rename
Blayers toCentroids.
Note: To know more about map layers, check this guide.
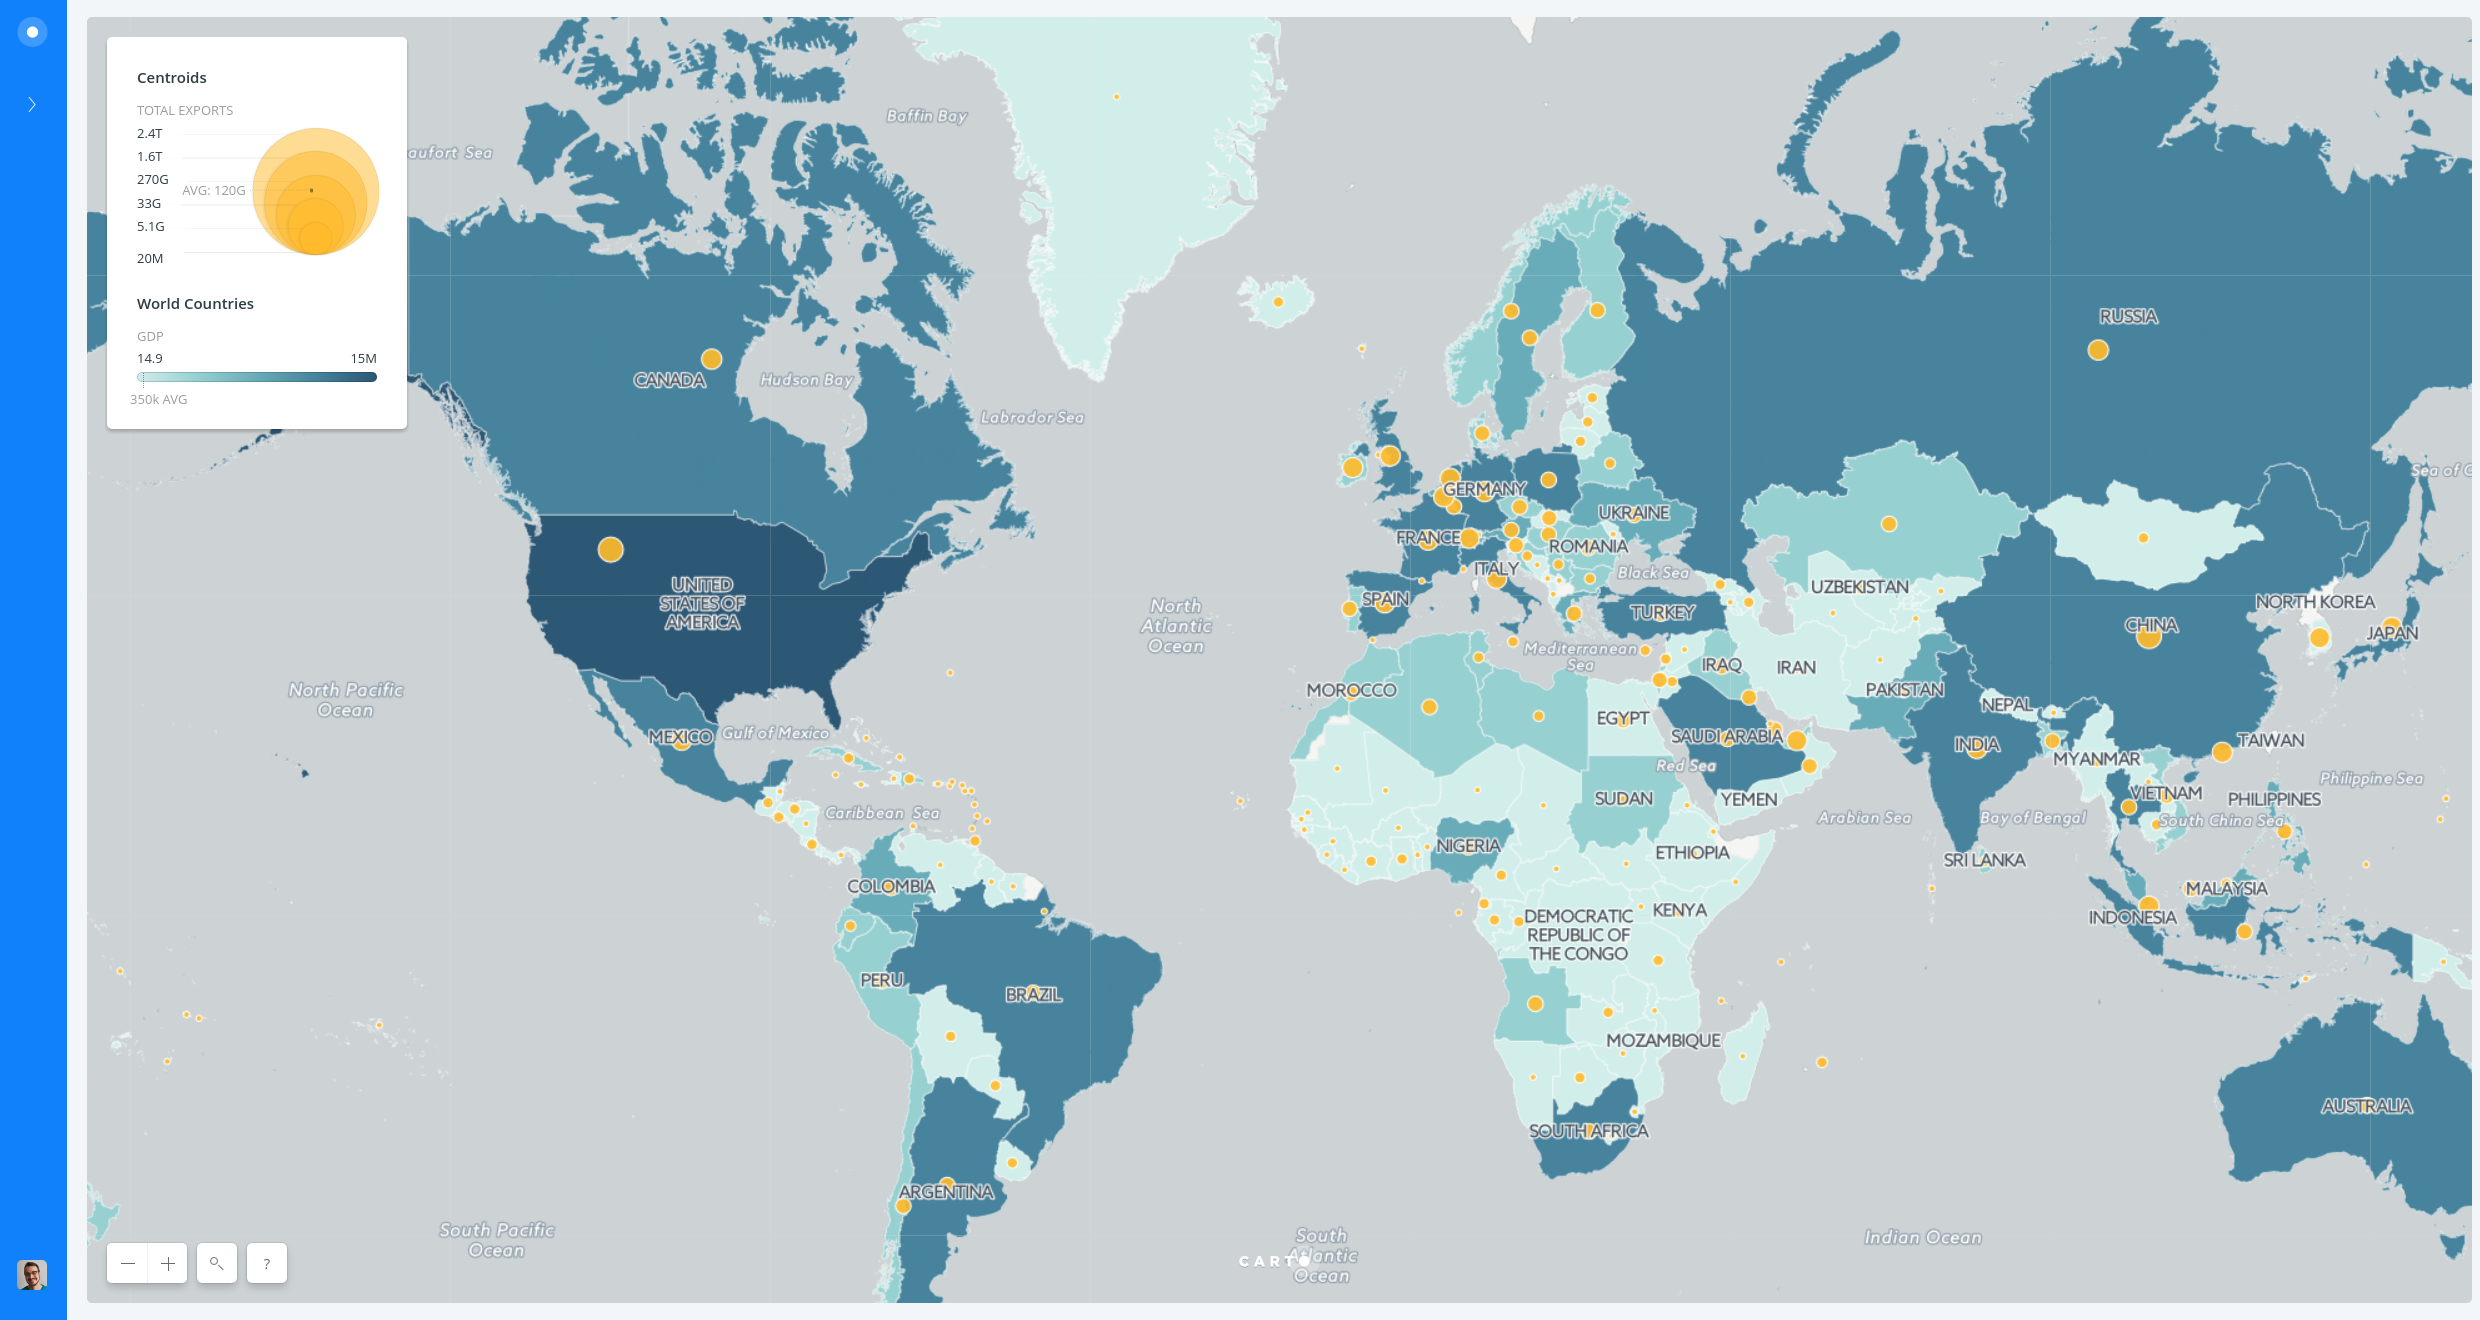
Style
Style centroids as bubbles
- Click on
Centroidslayer - Click on marker width (is showing
7by default), selectBY VALUEand choosevalue. - Set the MIN and MAX as
5and20respectively, andjenksas classification method.
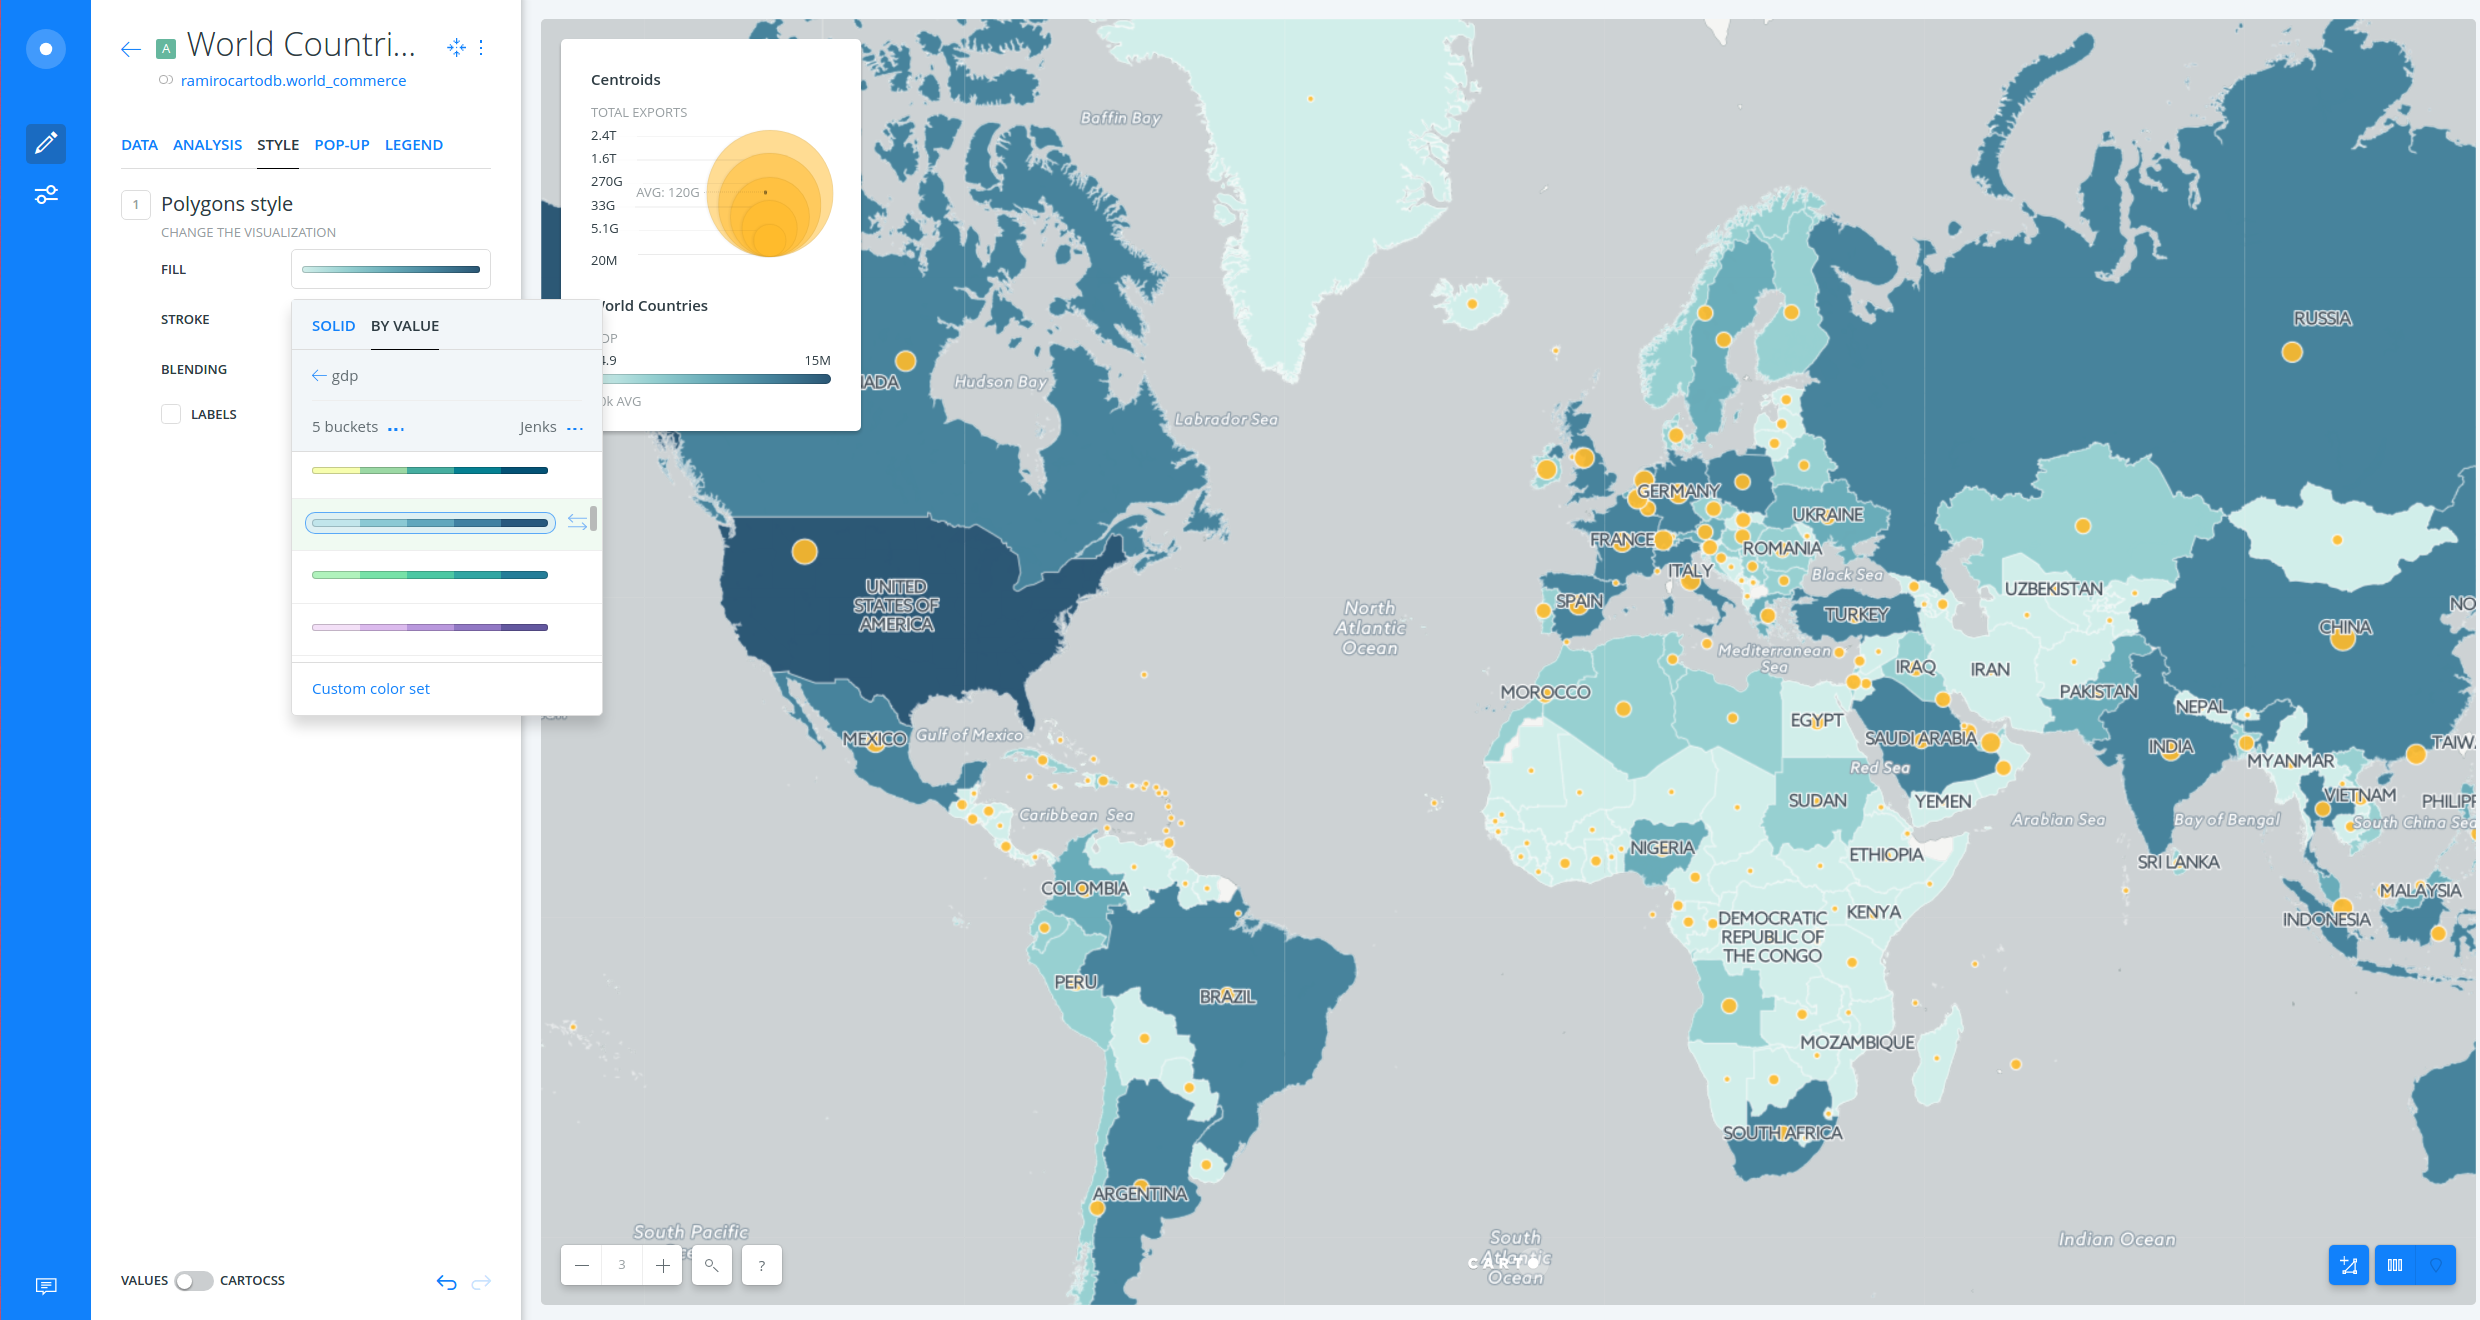
Style polygons as thematic choropleth
- Click on color fill (is showing yellow/orange by default), select
BY VALUEand choosegdp. - Choose a color scheme and set
jenksas classification method.
- You can edit the legend and add widgets and popups.
*To know more about style maps by value, check this guide.
Public and share map
- At the bottom of the main menu, click on SHARE at the right button corner.
- Go to PUBLISH tab and click on PUBLISH button that is below the Map name in order to share our map.
- After clicking on PUBLISH, we can select the options that we want to share our map.
- Get the link URL and paste it on other browser tab: https://public.carto.com/builder/73368f1e-e845-4a1b-8e30-75efb7472681/embed