Example - Intersect and Aggregate Points with Polygons
Learn how to find the number of Airbnb houses/rooms in distinct blocks and neighborhoods.
You will need to import the following dataset/s into your account:
- Barcelona Airbnb data:
airbnb_barcelona. You can download it from here. - Barcelona building footprint and neighborhoods:
barcelona_building_footprintandbarris_barcelonacan be found in the CARTO Data Library.
The Barcelona Airbnb dataset was downloaded from the Inside Airbnb website. In order to download them to your local machine, you use CARTO SQL API behind the scenes.
Workflow
- Create a map with
airbnb_barcelona(from your local machine), andbarcelona_building_footprintandbarris_barcelonadatasets (from the Data Library). - Change the map title and layer names.
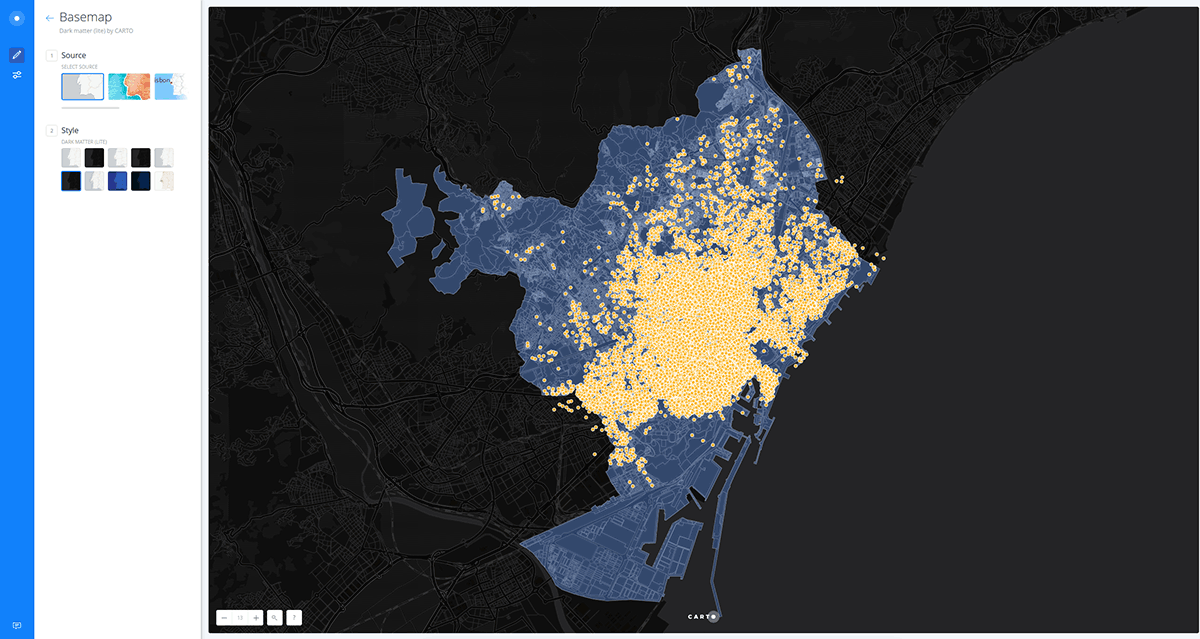
- Change basemap: click on “Positron” and then select “Dark Matter (Lite)”.
- Go to
Map Options(the slider button on the blue left sidebar), activateLAYER SELECTOR. - Go back to the main menu.
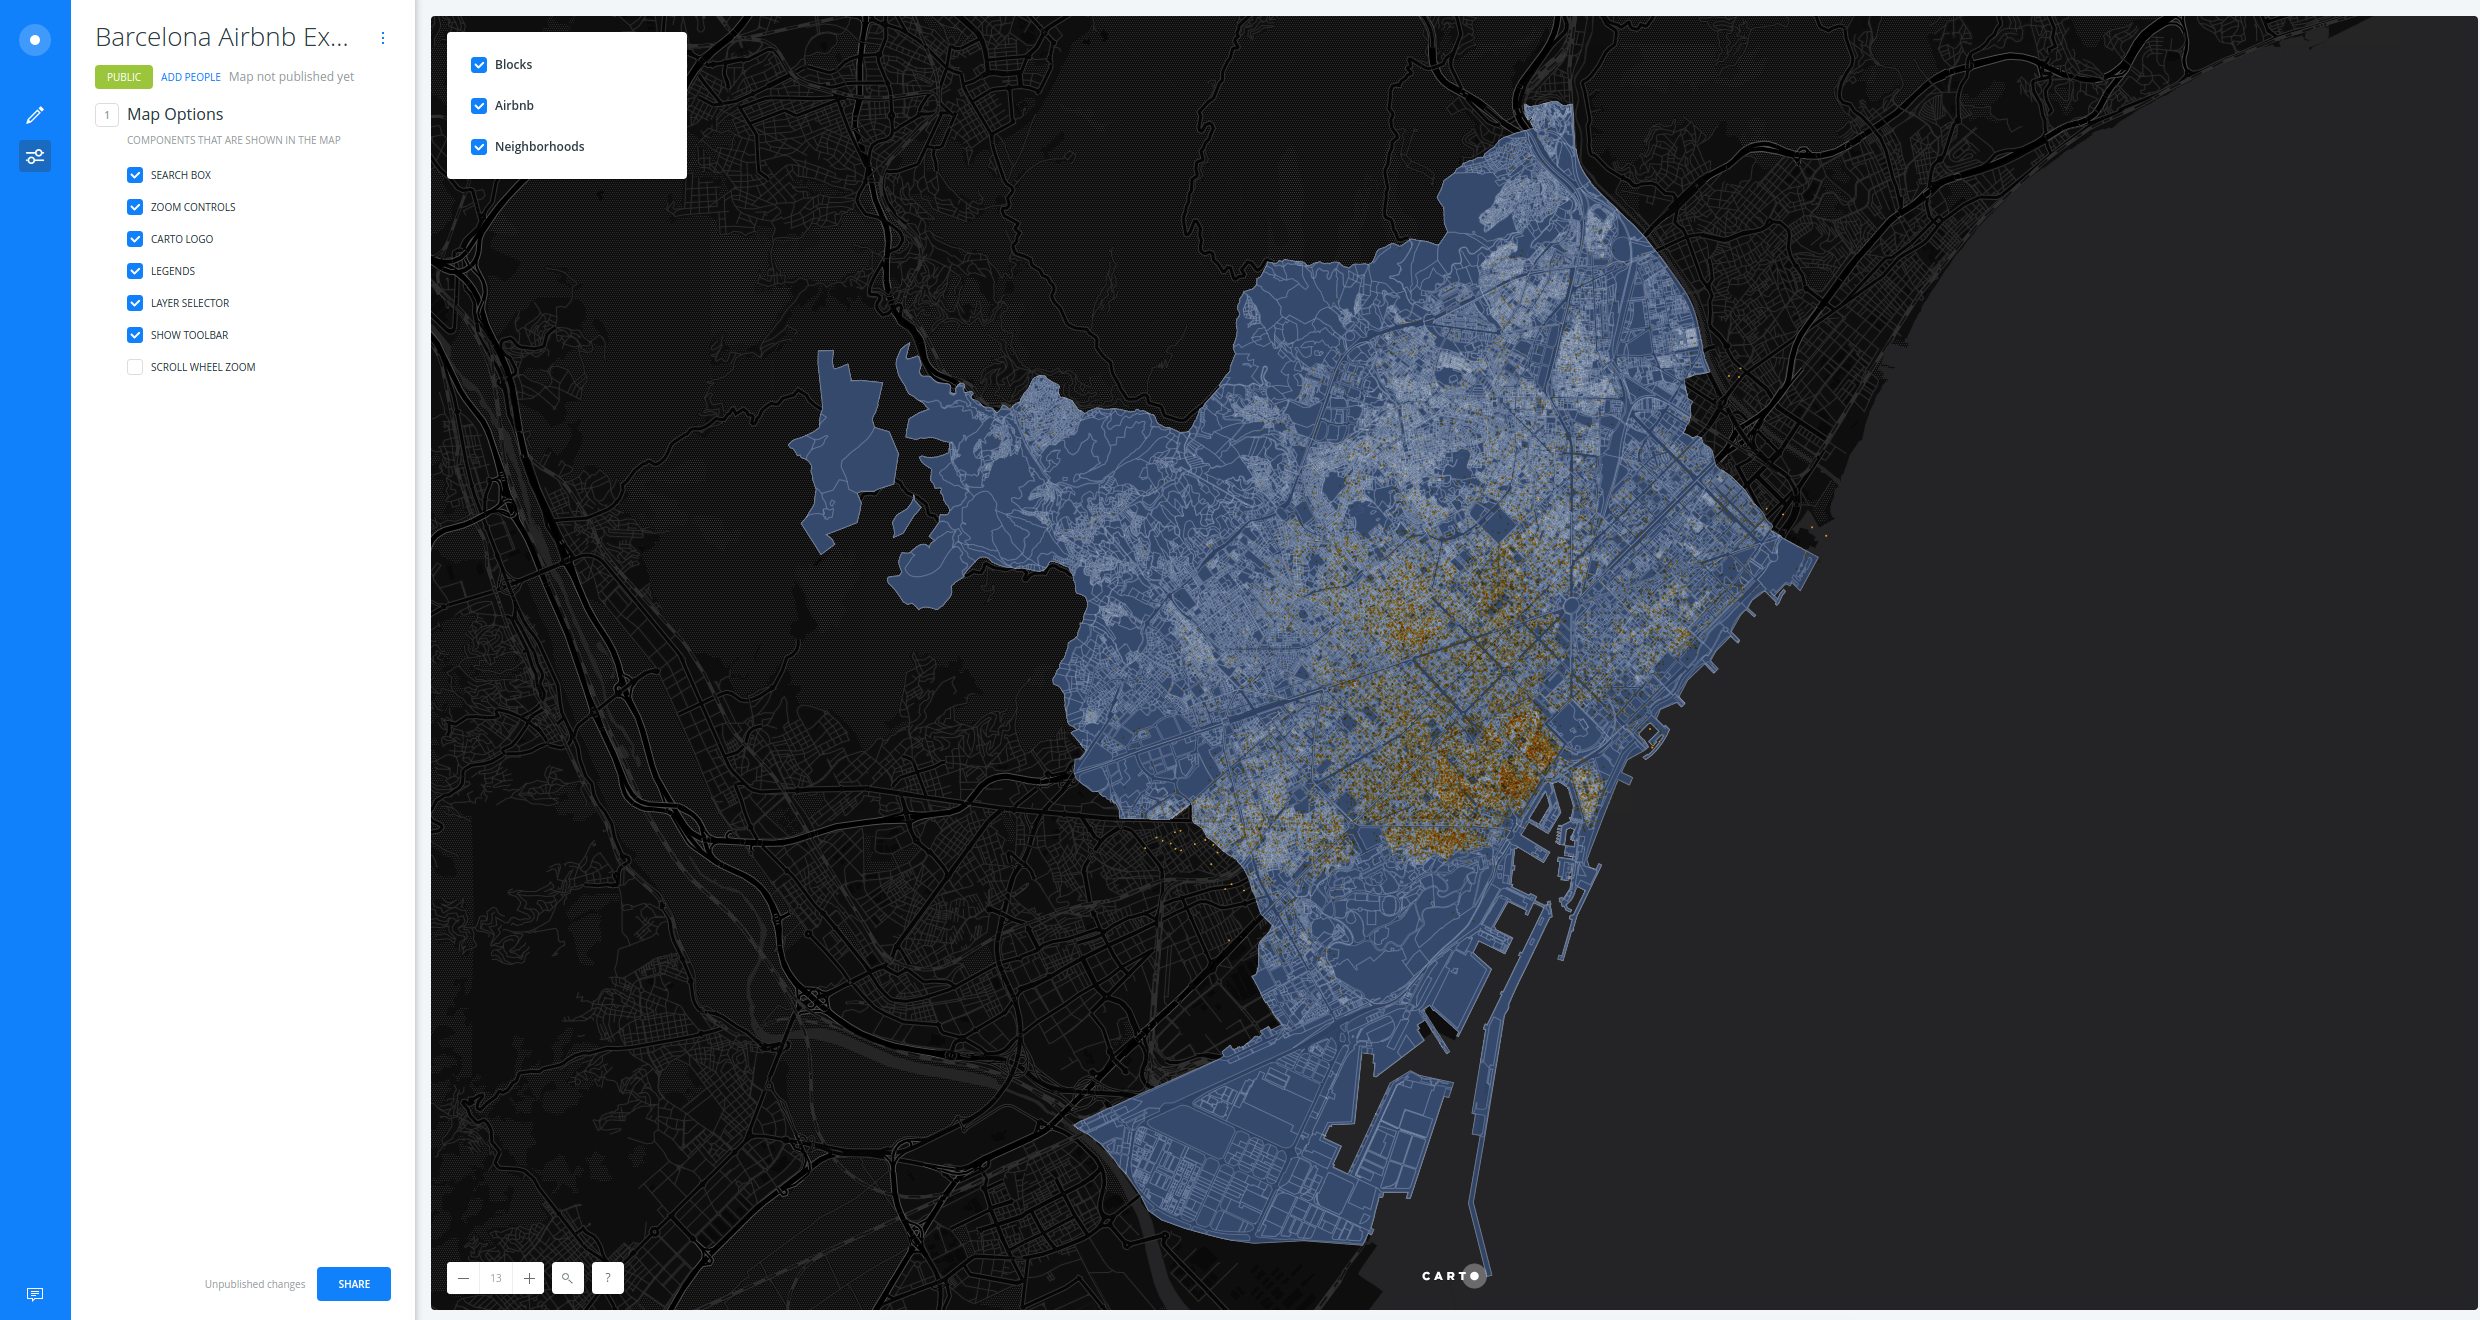
- Style “Airbnb” layer. Set
marker-widthto 2, removeSTROKEand set aBLENDINGmethod such asmultiply. - Apply the following SQL query to the “Airbnb” layer in order to get the price as a numeric field:
SELECT
  *,
  substring(price FROM '[0-9]+')::numeric as price_num
FROM
  listings_barcelona
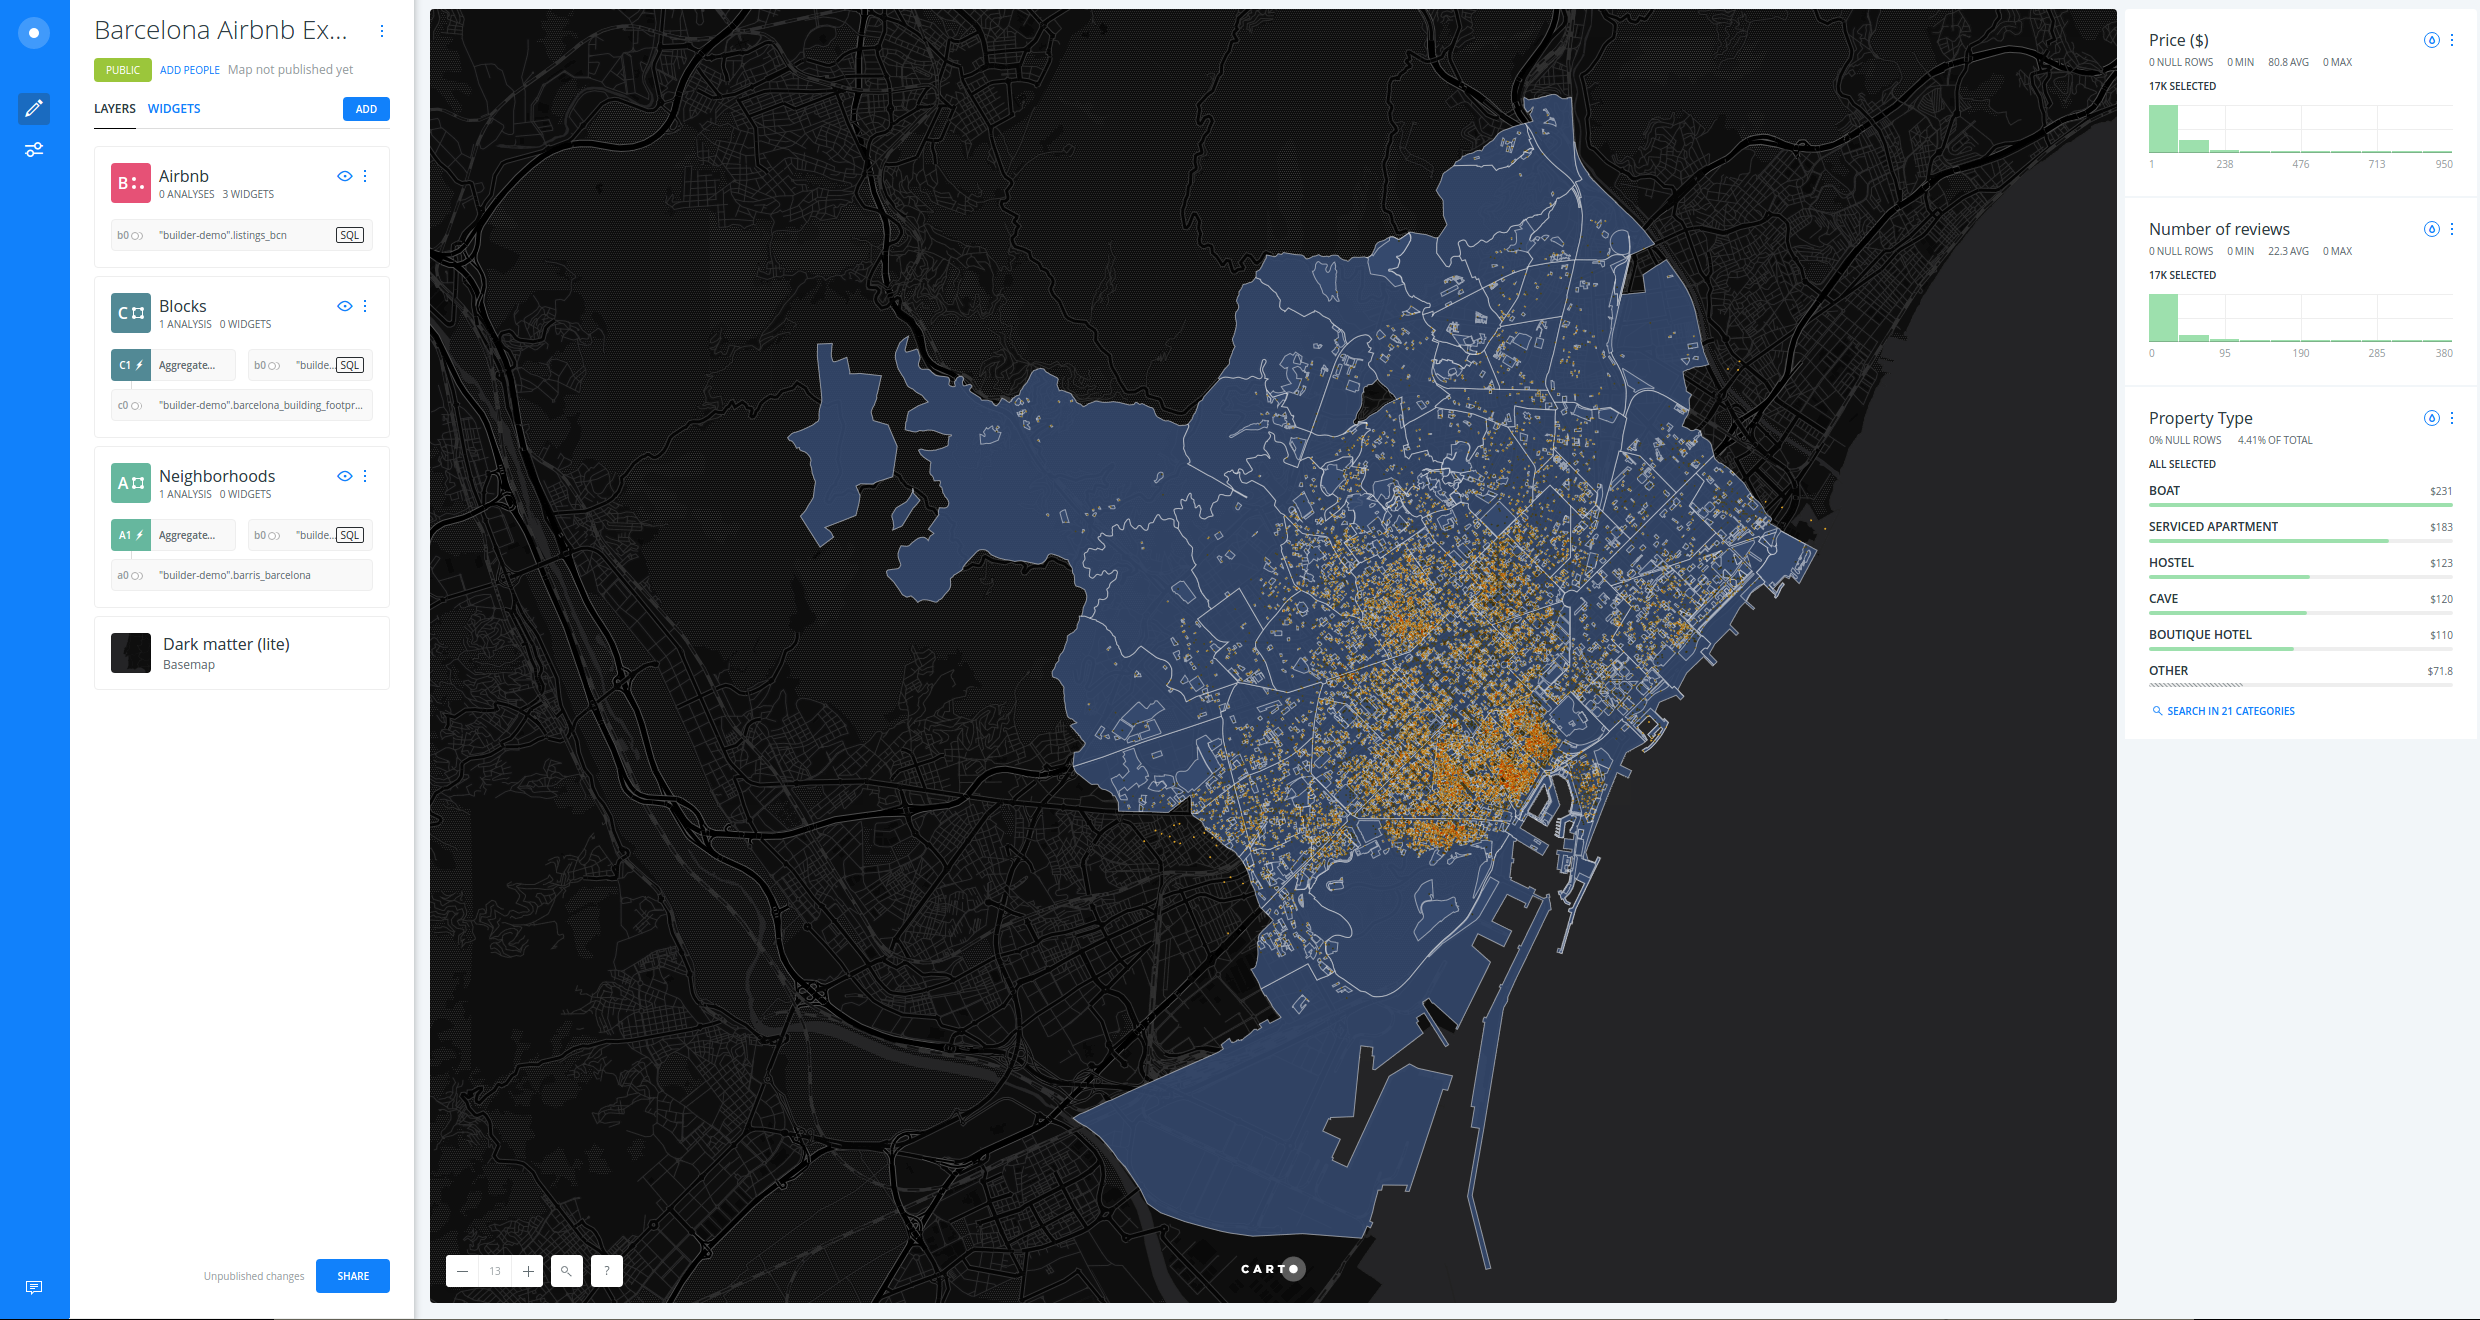
- Add some widgets from the “Airbnb” layer (
price_num,property_typeandnumber_of_reviews, for example). We will add widgets from the other two layers later. Edit them. - Add an
Intersect and aggregateanalysis to the “Blocks” layer, and “Neighborhoods”. Set “Airbnb” asTARGET LAYERandCOUNTasOPERATION.
- Add widgets for
n_distriandn_barricolumns in the “Neighborhoods” layer. Try different aggregations and see how it affects the ordering in the widget. - Add
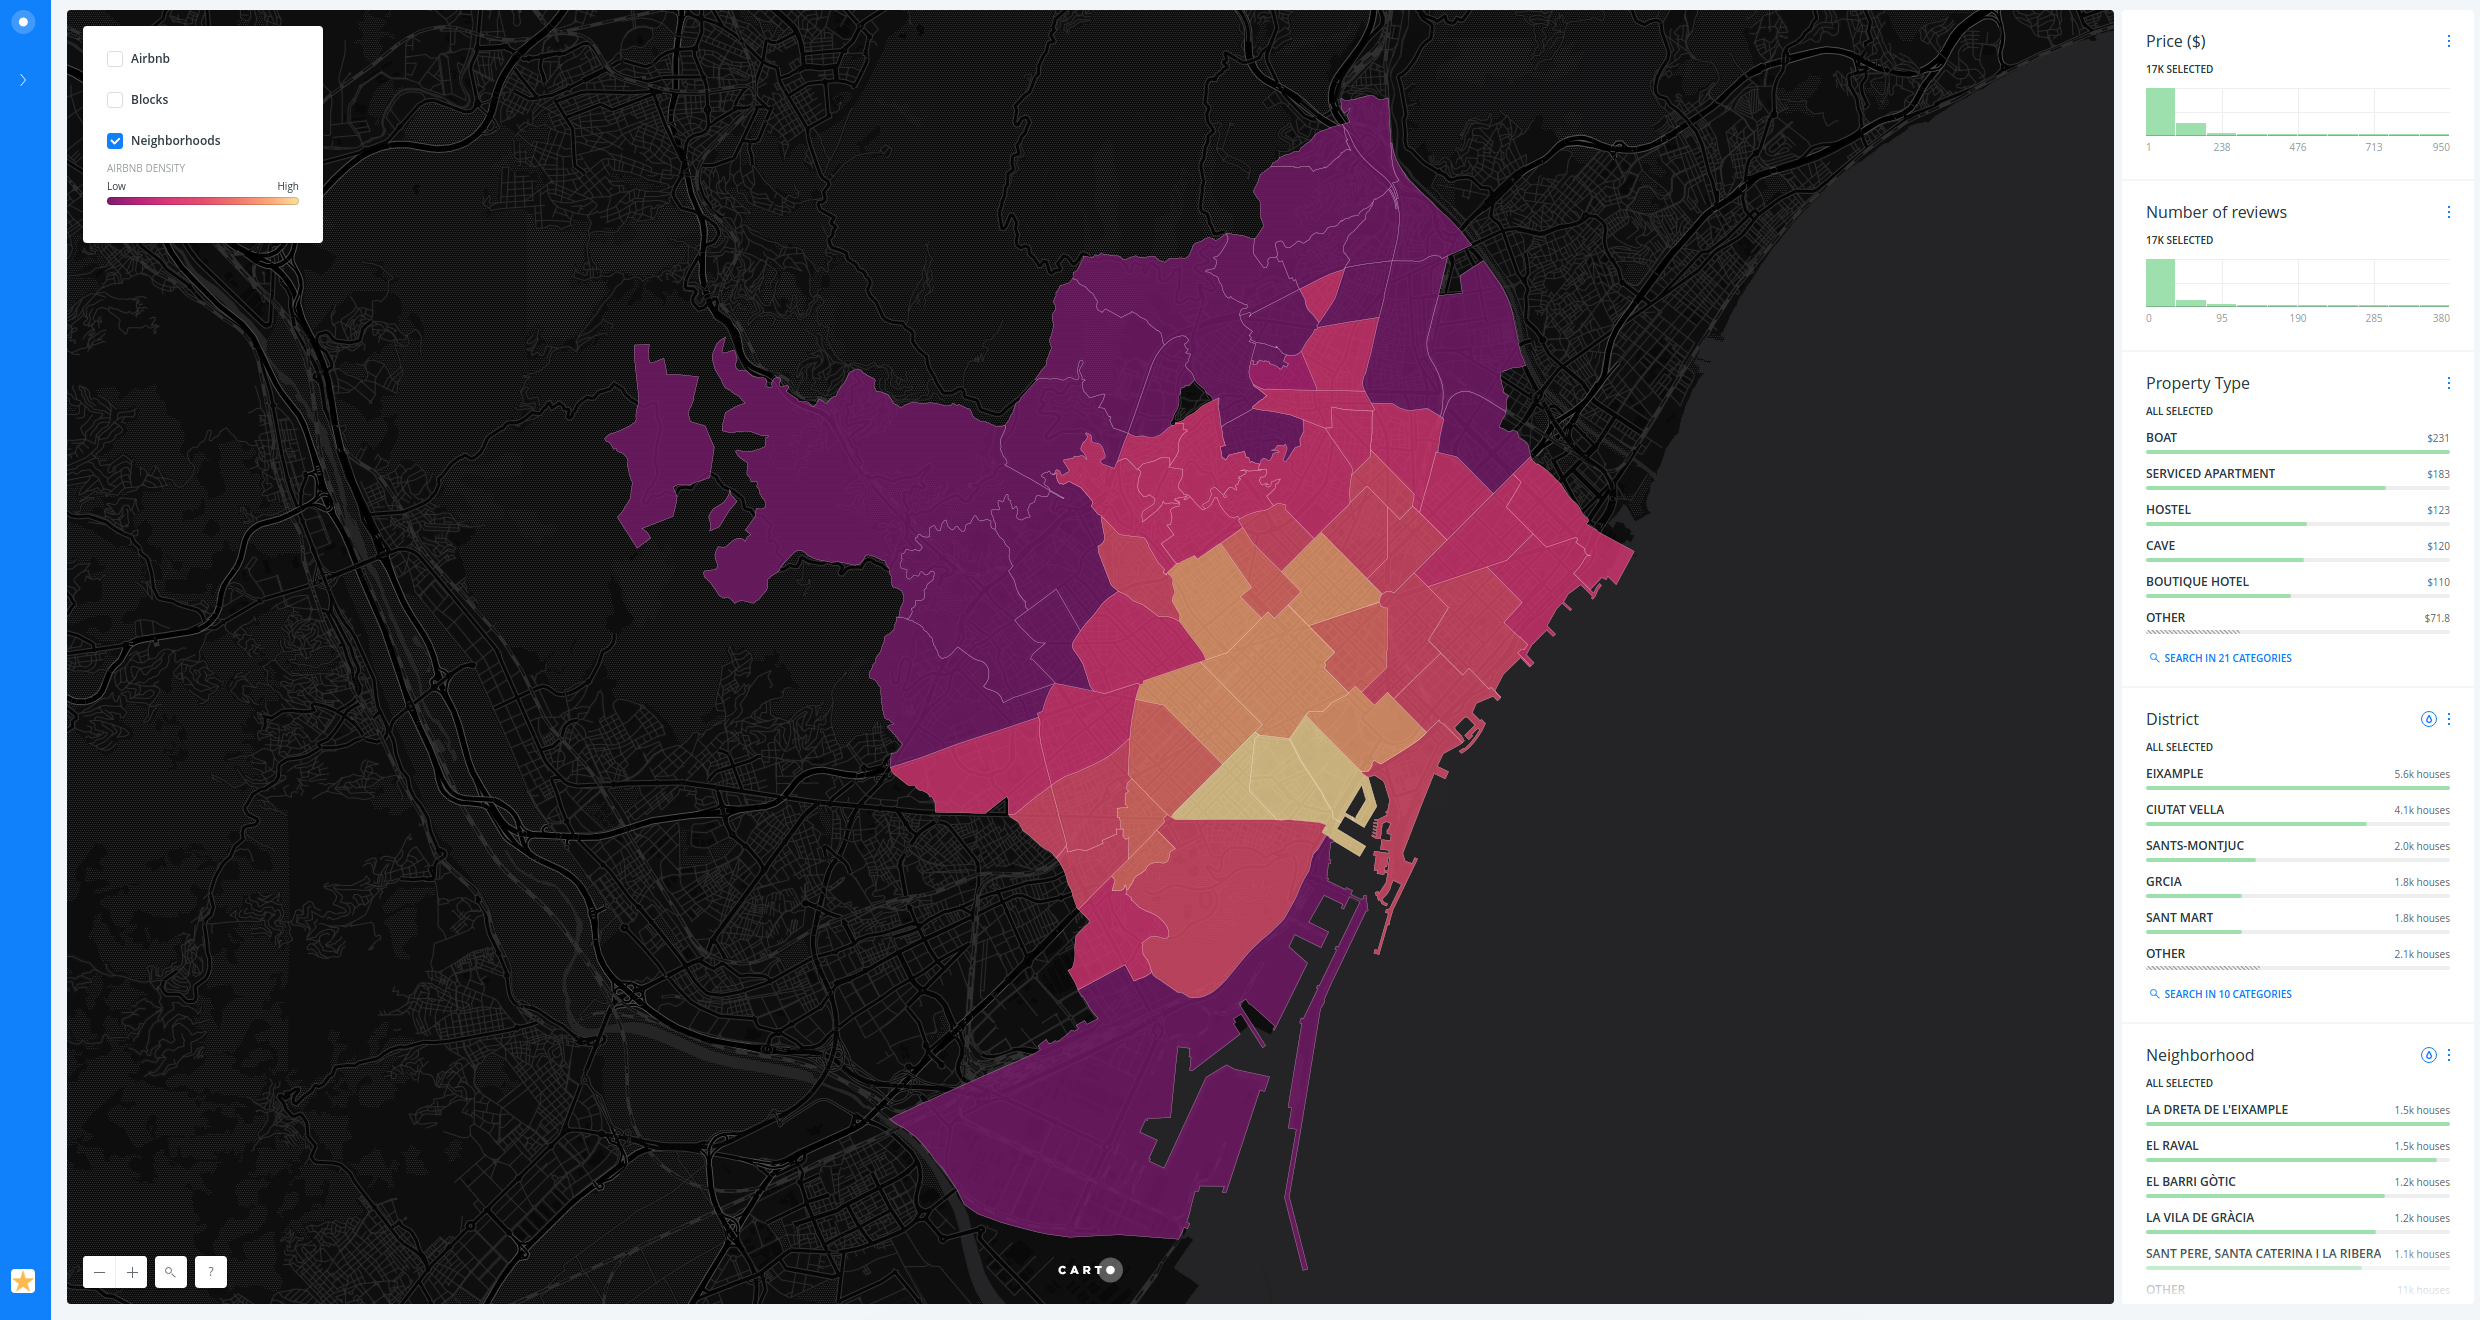
ref_cadastwidget from “Blocks” layer. UseCOUNTas aggregation operation. - Style “Blocks” and “Neighborhoods” as a choropleth. For each layer, go to the
STYLEtab. Then click on thepolygon-fillFILL color and selectBY VALUE. Selectcount_vals_density. Set the number ofbuckets, color scheme (but invert the colors! Lighter colors should show higher values in contrast to the dark basemap) and classification method as you wish.
We have selected
count_vals_densityinstead ofcount_vals, because when we make a choropleth map with polygon layers, we need to use data which is normalized, in this case by the area.
- Edit the “Blocks” and “Neighborhoods” legends.
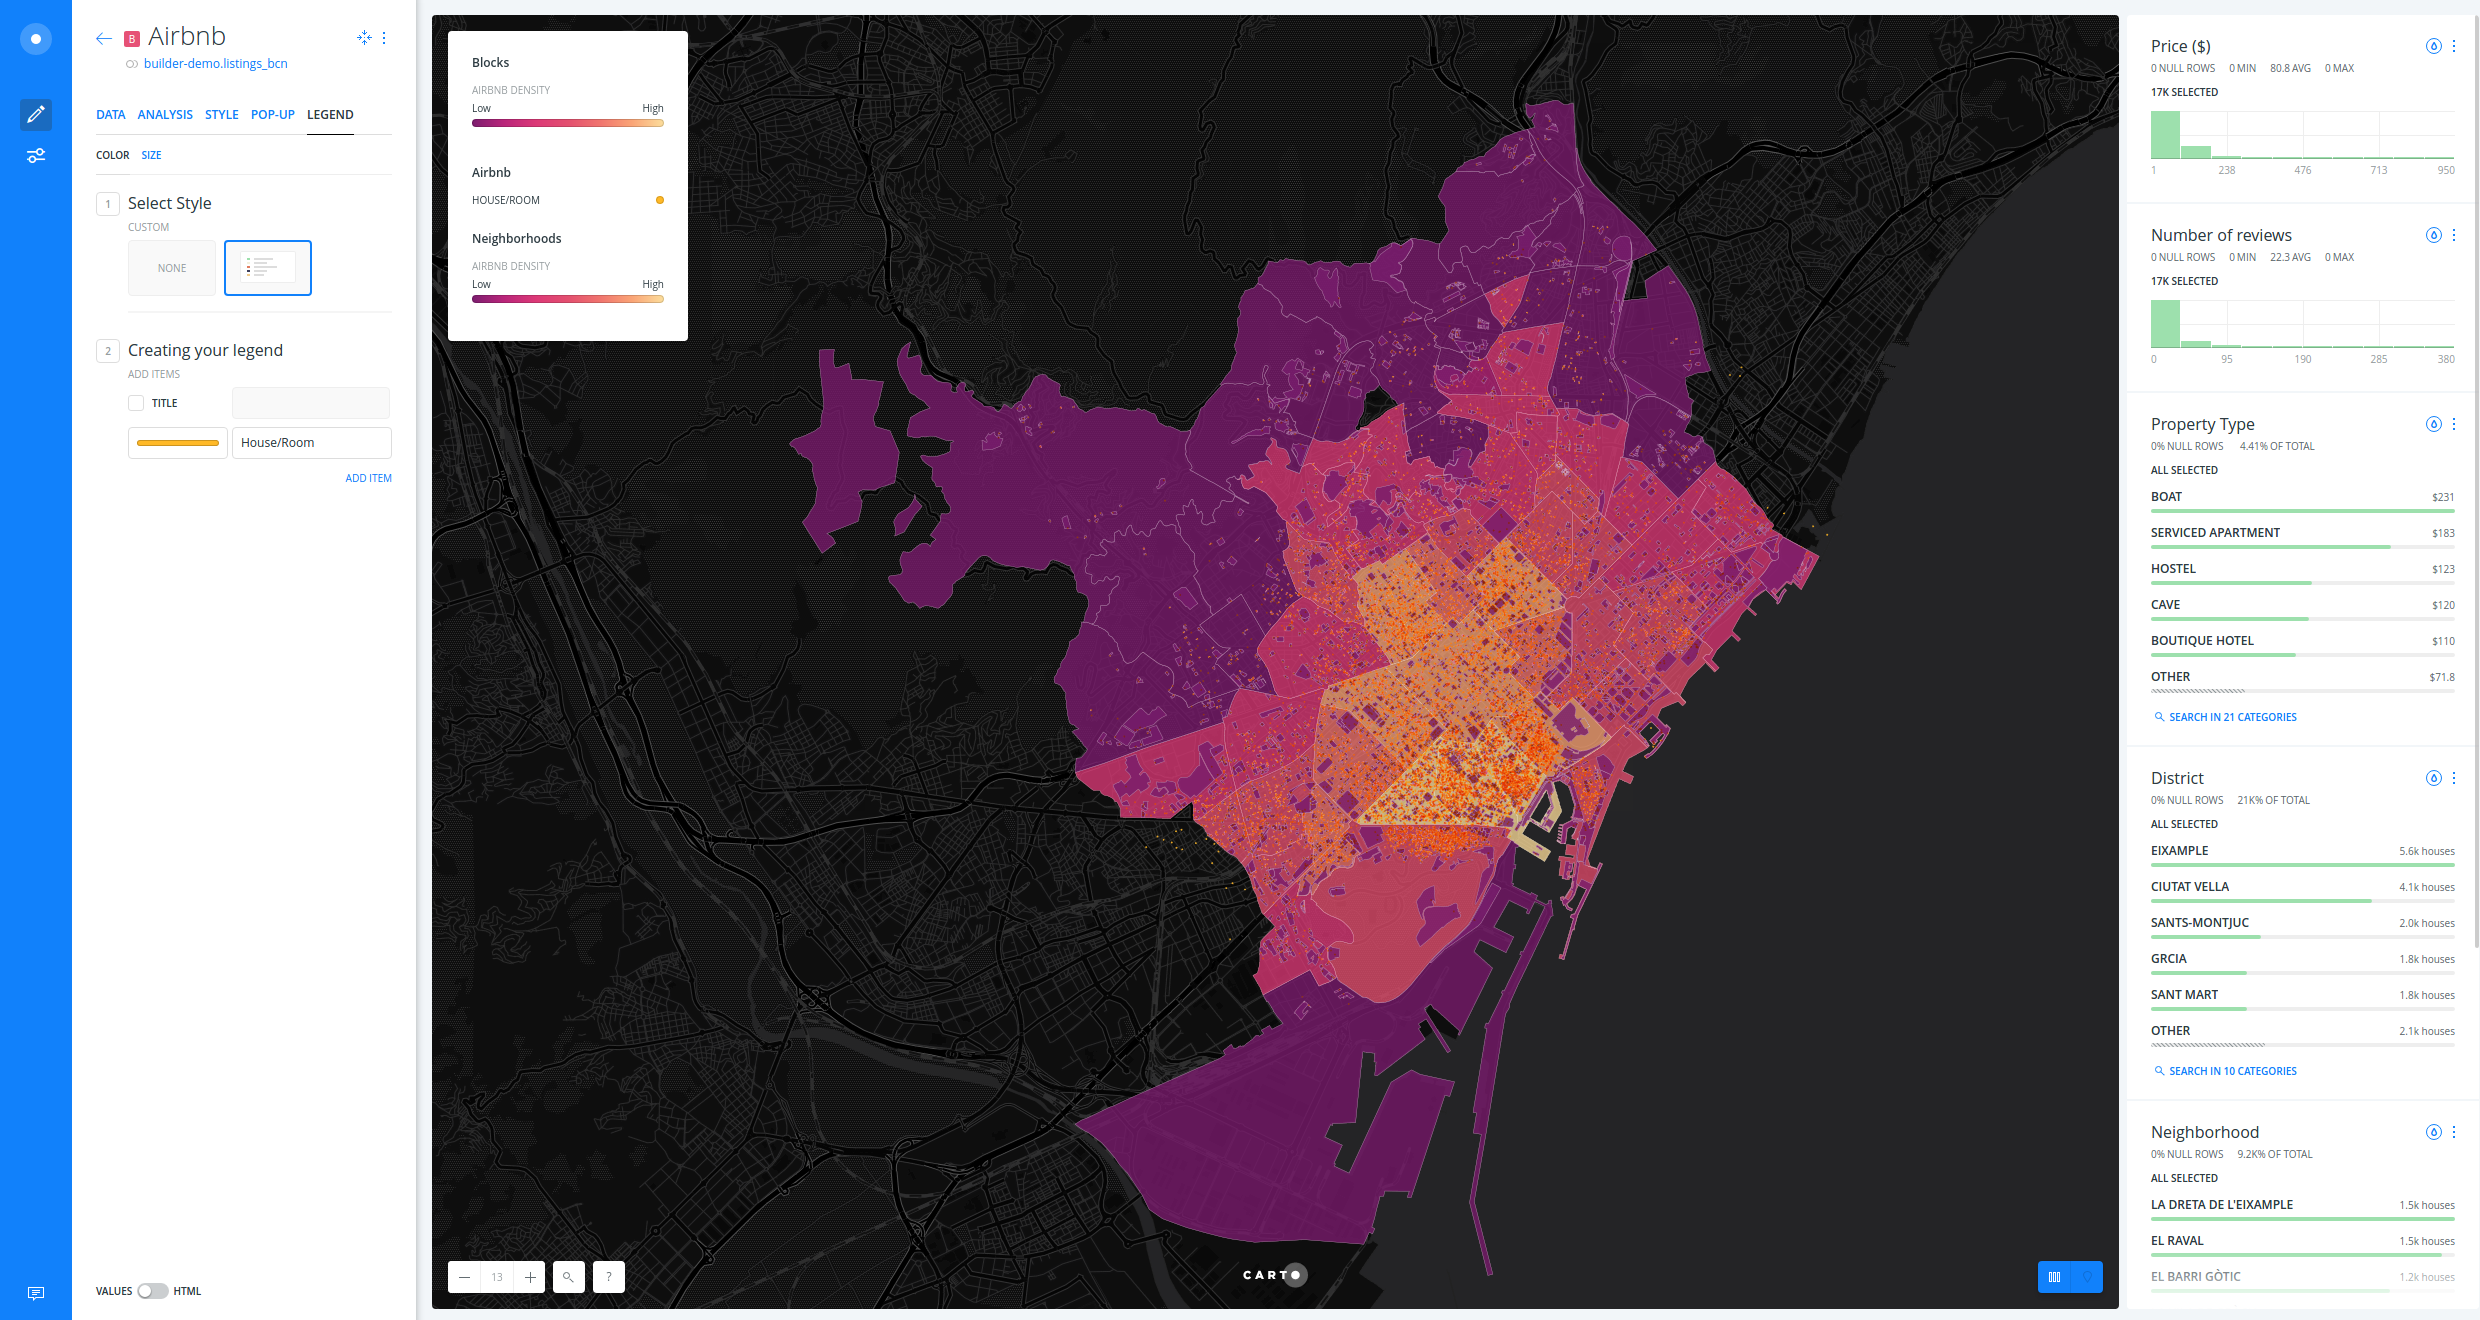
- Add a custom legend for the “Airbnb” layer. Go to the
LEGENDtab, then click onCUSTOMand type “House/room”.
- Disable “Airbnb” and “Blocks” layers view.
- Publish the map: https://public.carto.com/builder/1fb4ae92-40a3-4df2-adca-e75707438d1a/embed