Example - Intersect and Aggregate to show Sums
Learn how to report the sum of purchases sold by a chain of stores.
You will need to import the following dataset/s into your account:
- Stores and Sales CSVs stored in a single zip
Import and create a map
Drag and drop the zip file on your dashboard and both CSV files will be converted into two different alphanumeric tables. You can create a map selecting both datasets, don’t worry if you don’t see anything on your map yet.

Georeference stores layer
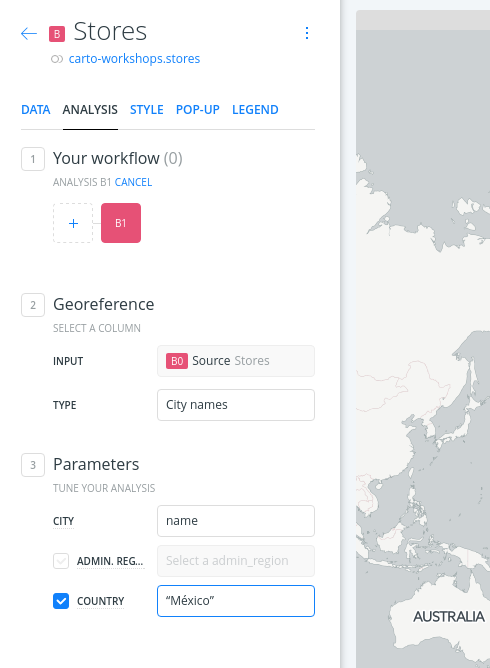
- Select the stores layer and add the Georeference analysis.
- Use the City names option, select the
namecolumn for the city names and write on the COUNTRY manually asMéxico. - Click APPLY and the geocoder will give geometries for our stores layer.

Compute the total sales per store
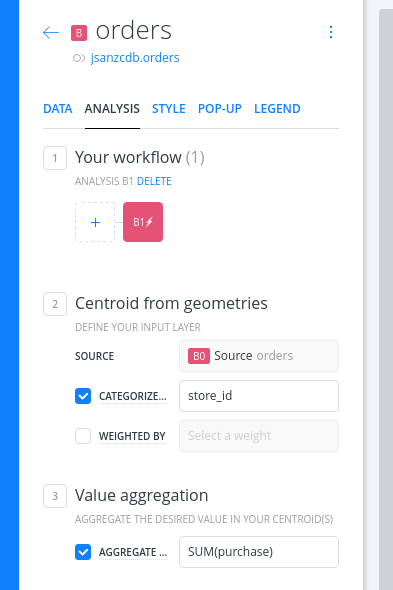
- We want to group all the sales into a summarized table that we can join with the stores.
- To do so use the Centroids analysis and aggregate the purchases by
store_id.

This will produce a new table with null geometries (obviously) but with two fields:
category: the store identifiervalue: the sum of the purchases
Join both layers
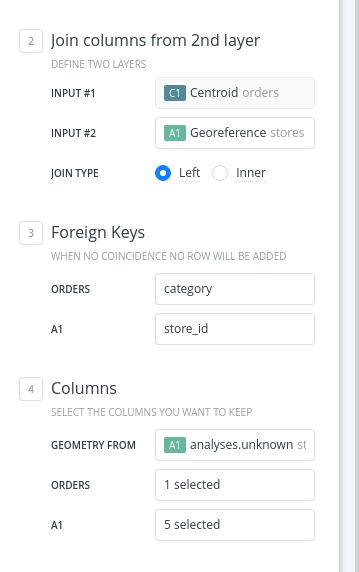
- Select the Orders layer and add the Join columns from 2nd layer analysis.
- Set as INPUT #2 the georeferenced layer (probably B1).
- We want a inner join so only common rows to both datasets will show up.
- Select on both tables the same foreign key:
categoryandstore_id. - On the next section be sure to take the geometries from the georeferenced layer.
- Finally select the desired columns from both datasets:
- ORDERS: you want
value - STORES : you want
store_id,name,founded, andowner
- ORDERS: you want

Style
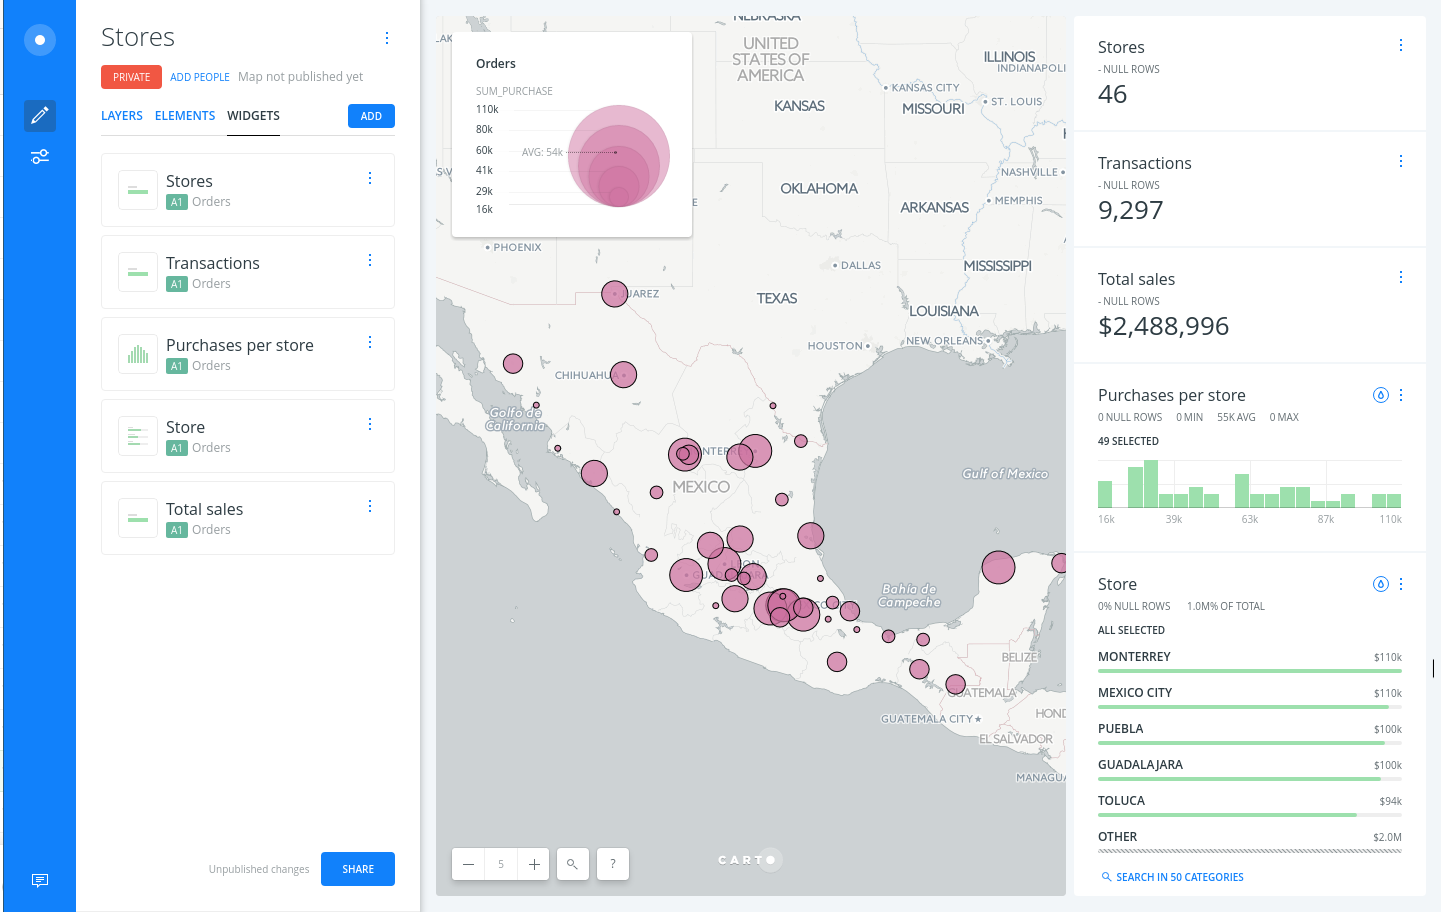
Now you have the total sales for your stores, and you could use a simple bubble symbology to easily find those which have sold more.
Add widgets
Finally you could add some widgets to finish your dashboard:
- Count of stores
- Sum of the purchases
- Category showing the name of the owners by the sum of purchases
- Category showing the name of the cities by the sum of purchases
- Histogram with the year of funding
