Example - Using CARTO Builder Analysis to Style Data
Learn how to visualize Quercus spatial distribution, diversity and habitats in Spanish territory.
You will need to import the following dataset/s into your account:
quercuspoint dataset from here, the data source is from GBIF database.ign_spanish_adm3_municipalitiesdataset from CARTO Data Library.
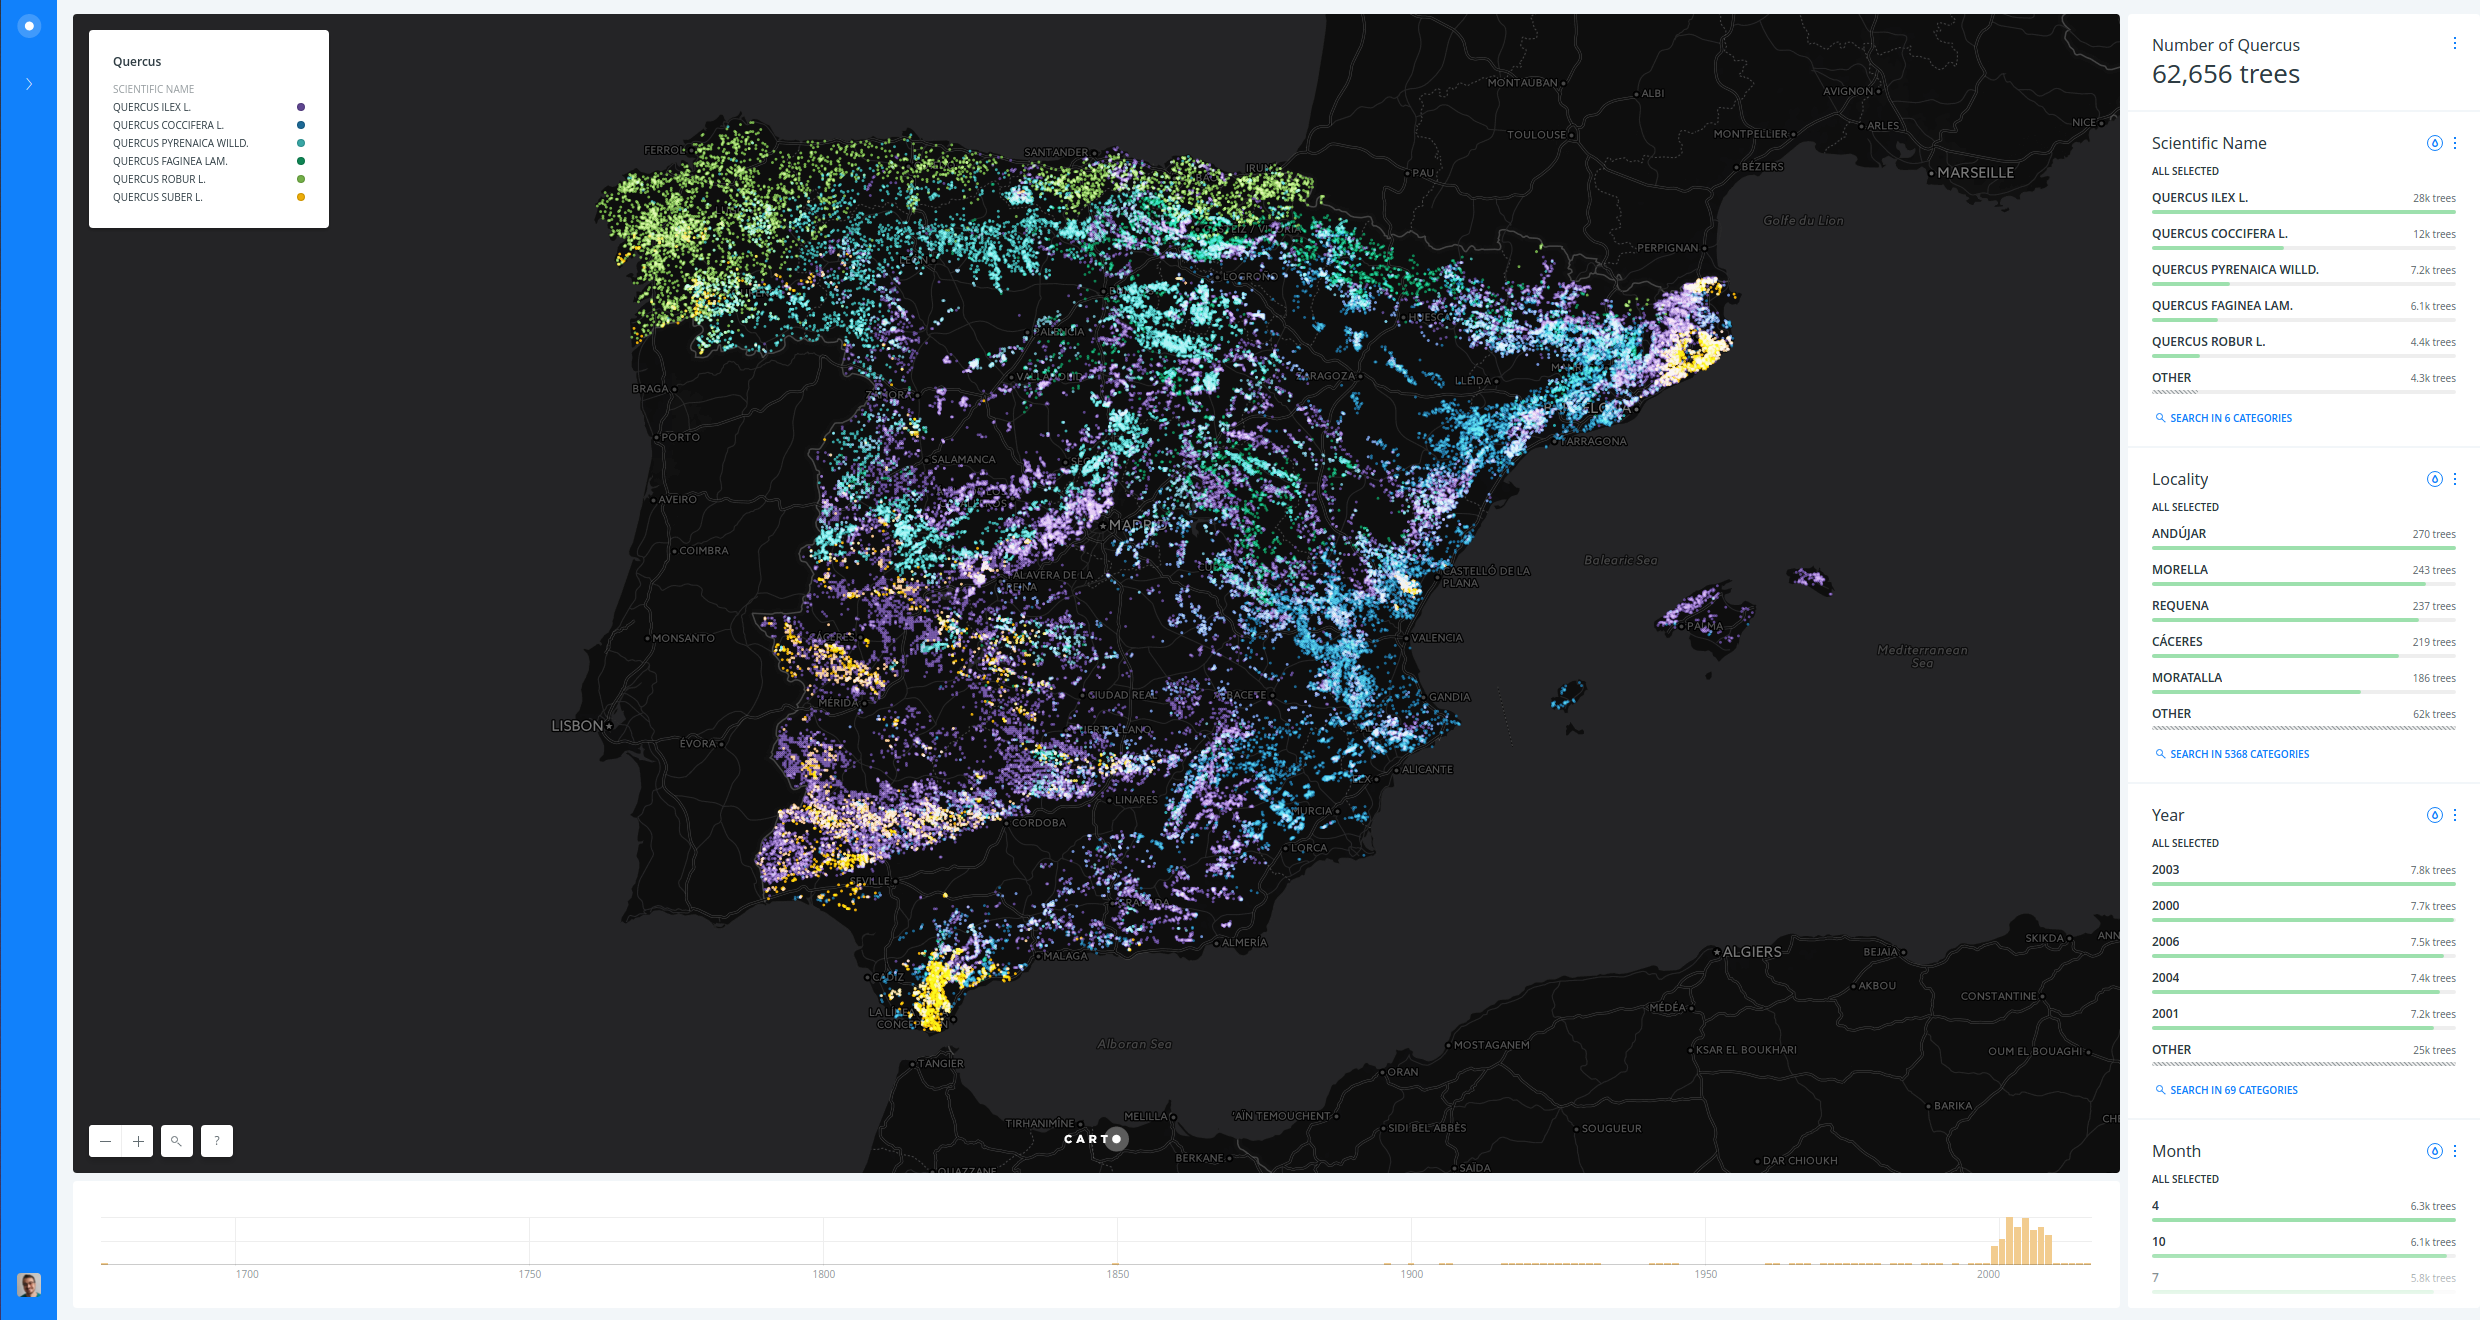
A. Quercus diversity
- Create a map connecting
quercusdataset. - Rename map title and layer name.
- Change basemap from “Positron” to “Dark Matter”.
- Add
Georeferenceanalysis to the layer, usinglatitude___processedandlongitude___processedfields. - Change layer style, setting the marker width to
3, removing the markerSTROKEand setting theBLENDINGmethod toscreen. - Add some widgets:
point count,scientific_name,locality,event_date___parsed. - Publish and share your map.
https://public.carto.com/builder/ec23a1f2-bfb3-46d6-9512-0b872e820e3c/embed
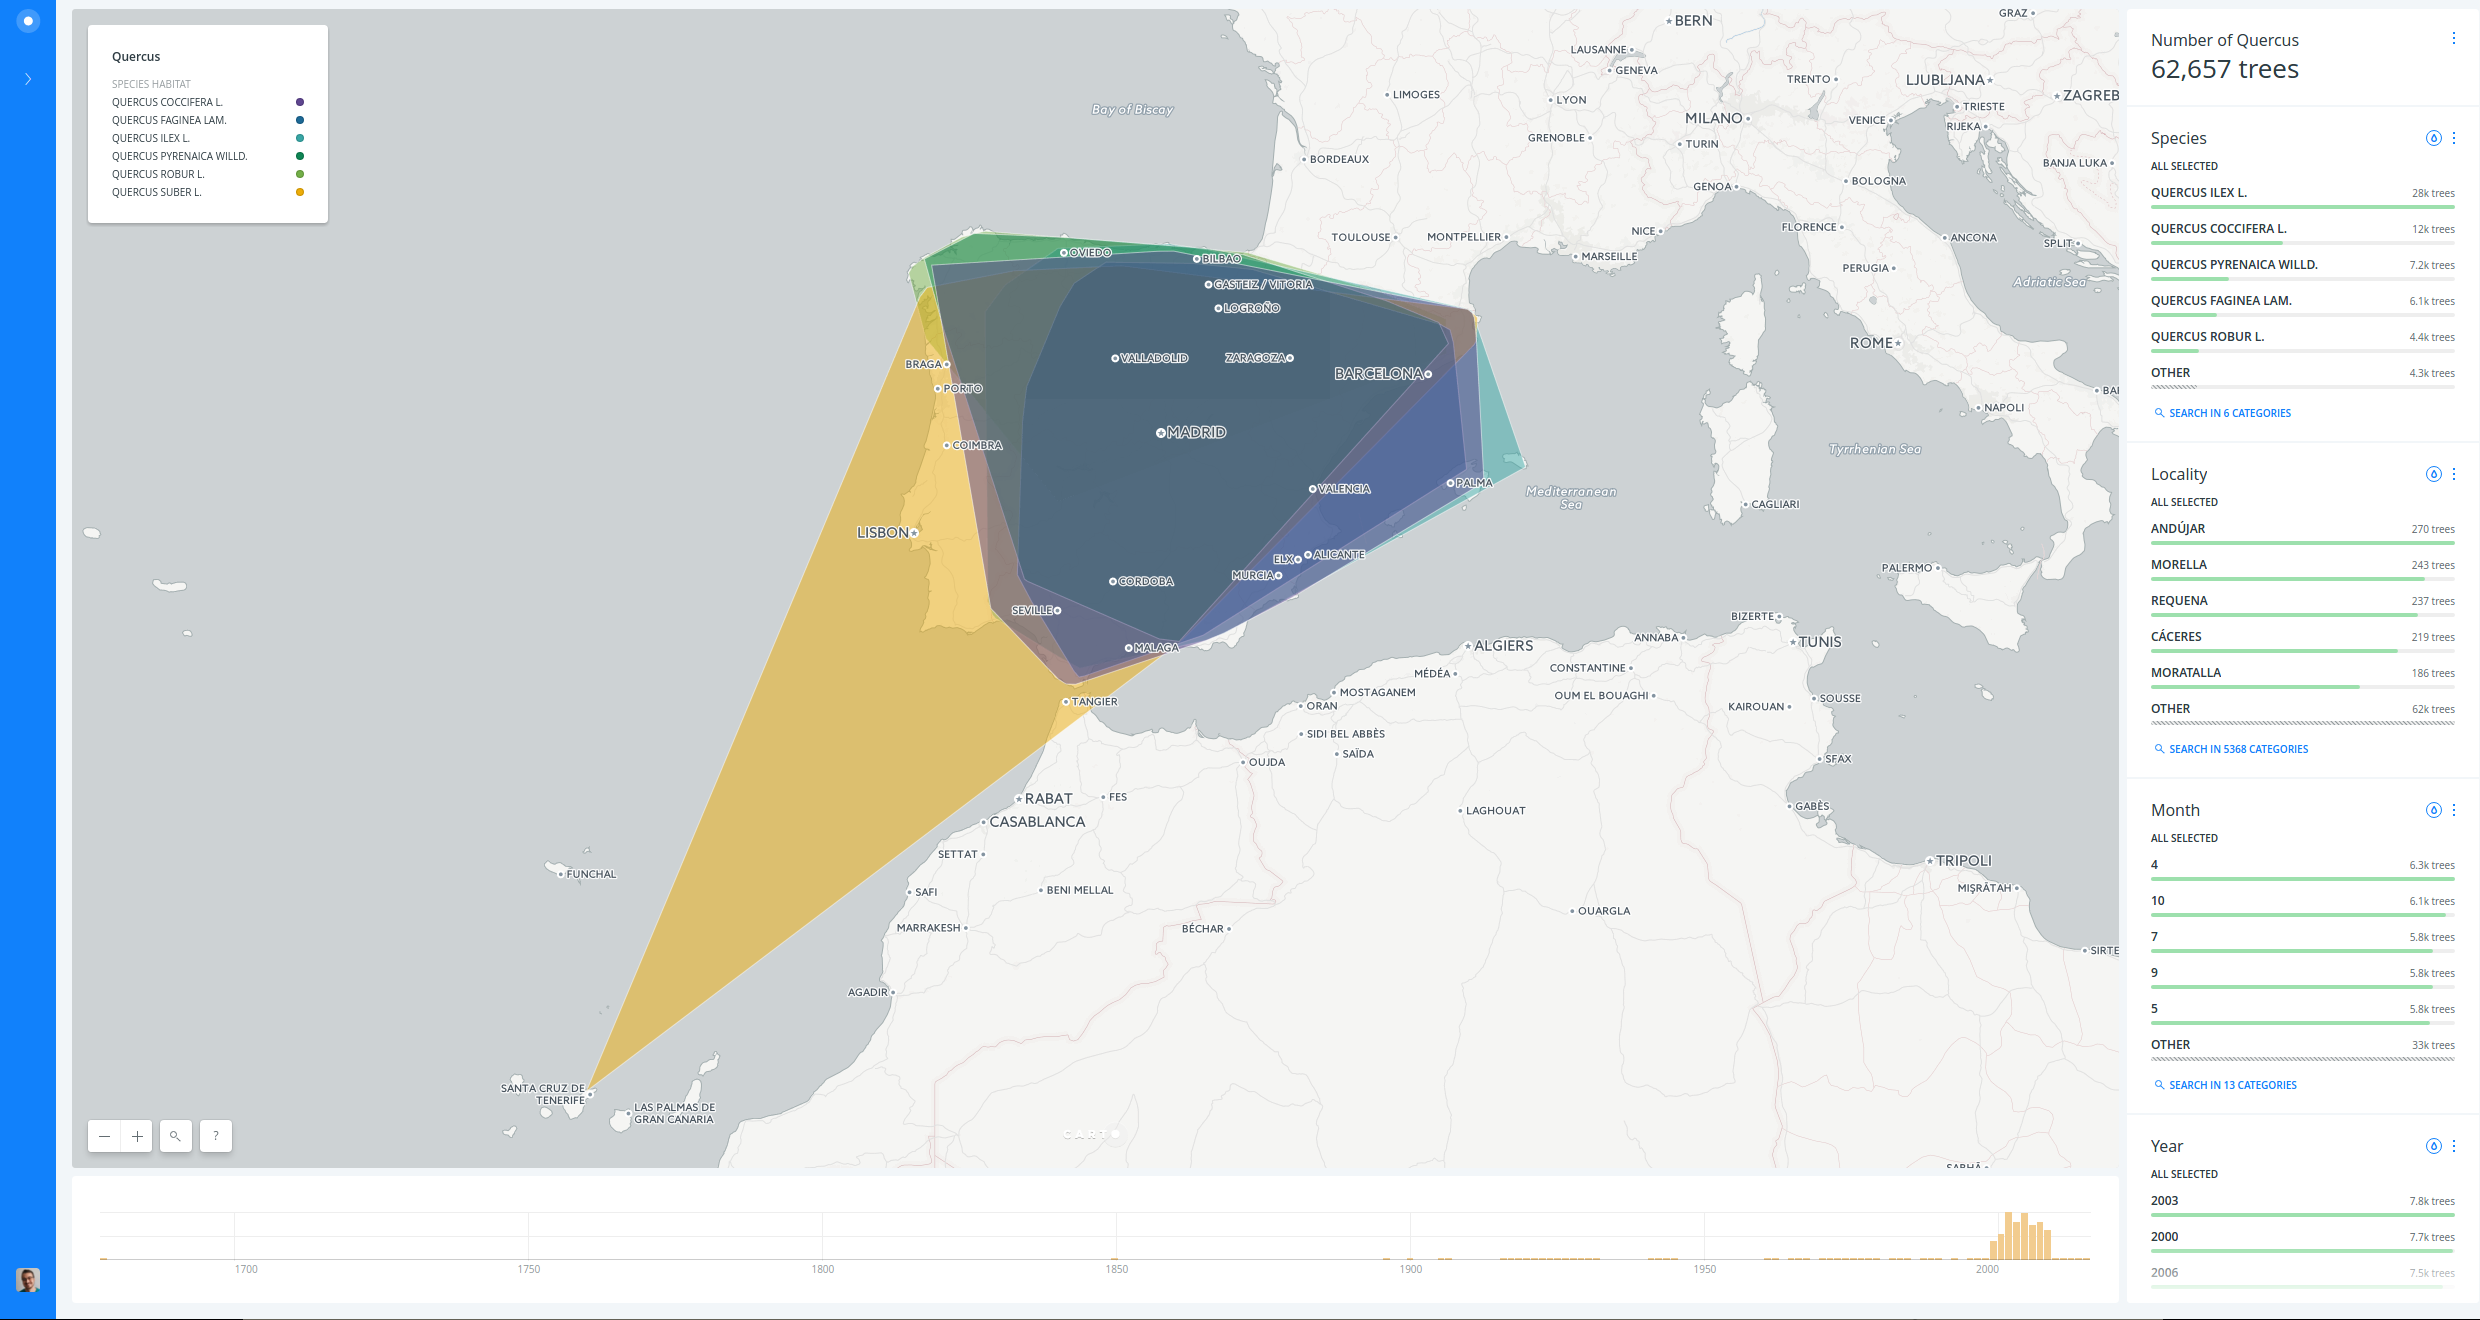
B. Quercus habitat
- Create a map connecting
quercusdataset. - Rename map title and layer name.
- Add
Georeferenceanalysis to the layer, usinglatitude___processedandlongitude___processedfields. - Add some widgets:
locality,event_date___parsed,monthandyear(edit these last two from histograms to categories). - Add
Group points into polygonsanalysis to the layer, grouping byscientific_nameand leaving theOPERATIONasCOUNT. - Add some widgets:
count_vals(change it fromavgtosum) andcategory. - Change layer style, make a category map using the
categoryfield. To make the visualization better, go to the CartoCSS view and set thepolygon-opacityto0.5. - Publish and share your map.
https://public.carto.com/builder/a57ae361-bb6f-45ee-95b3-f540538eef16/embed
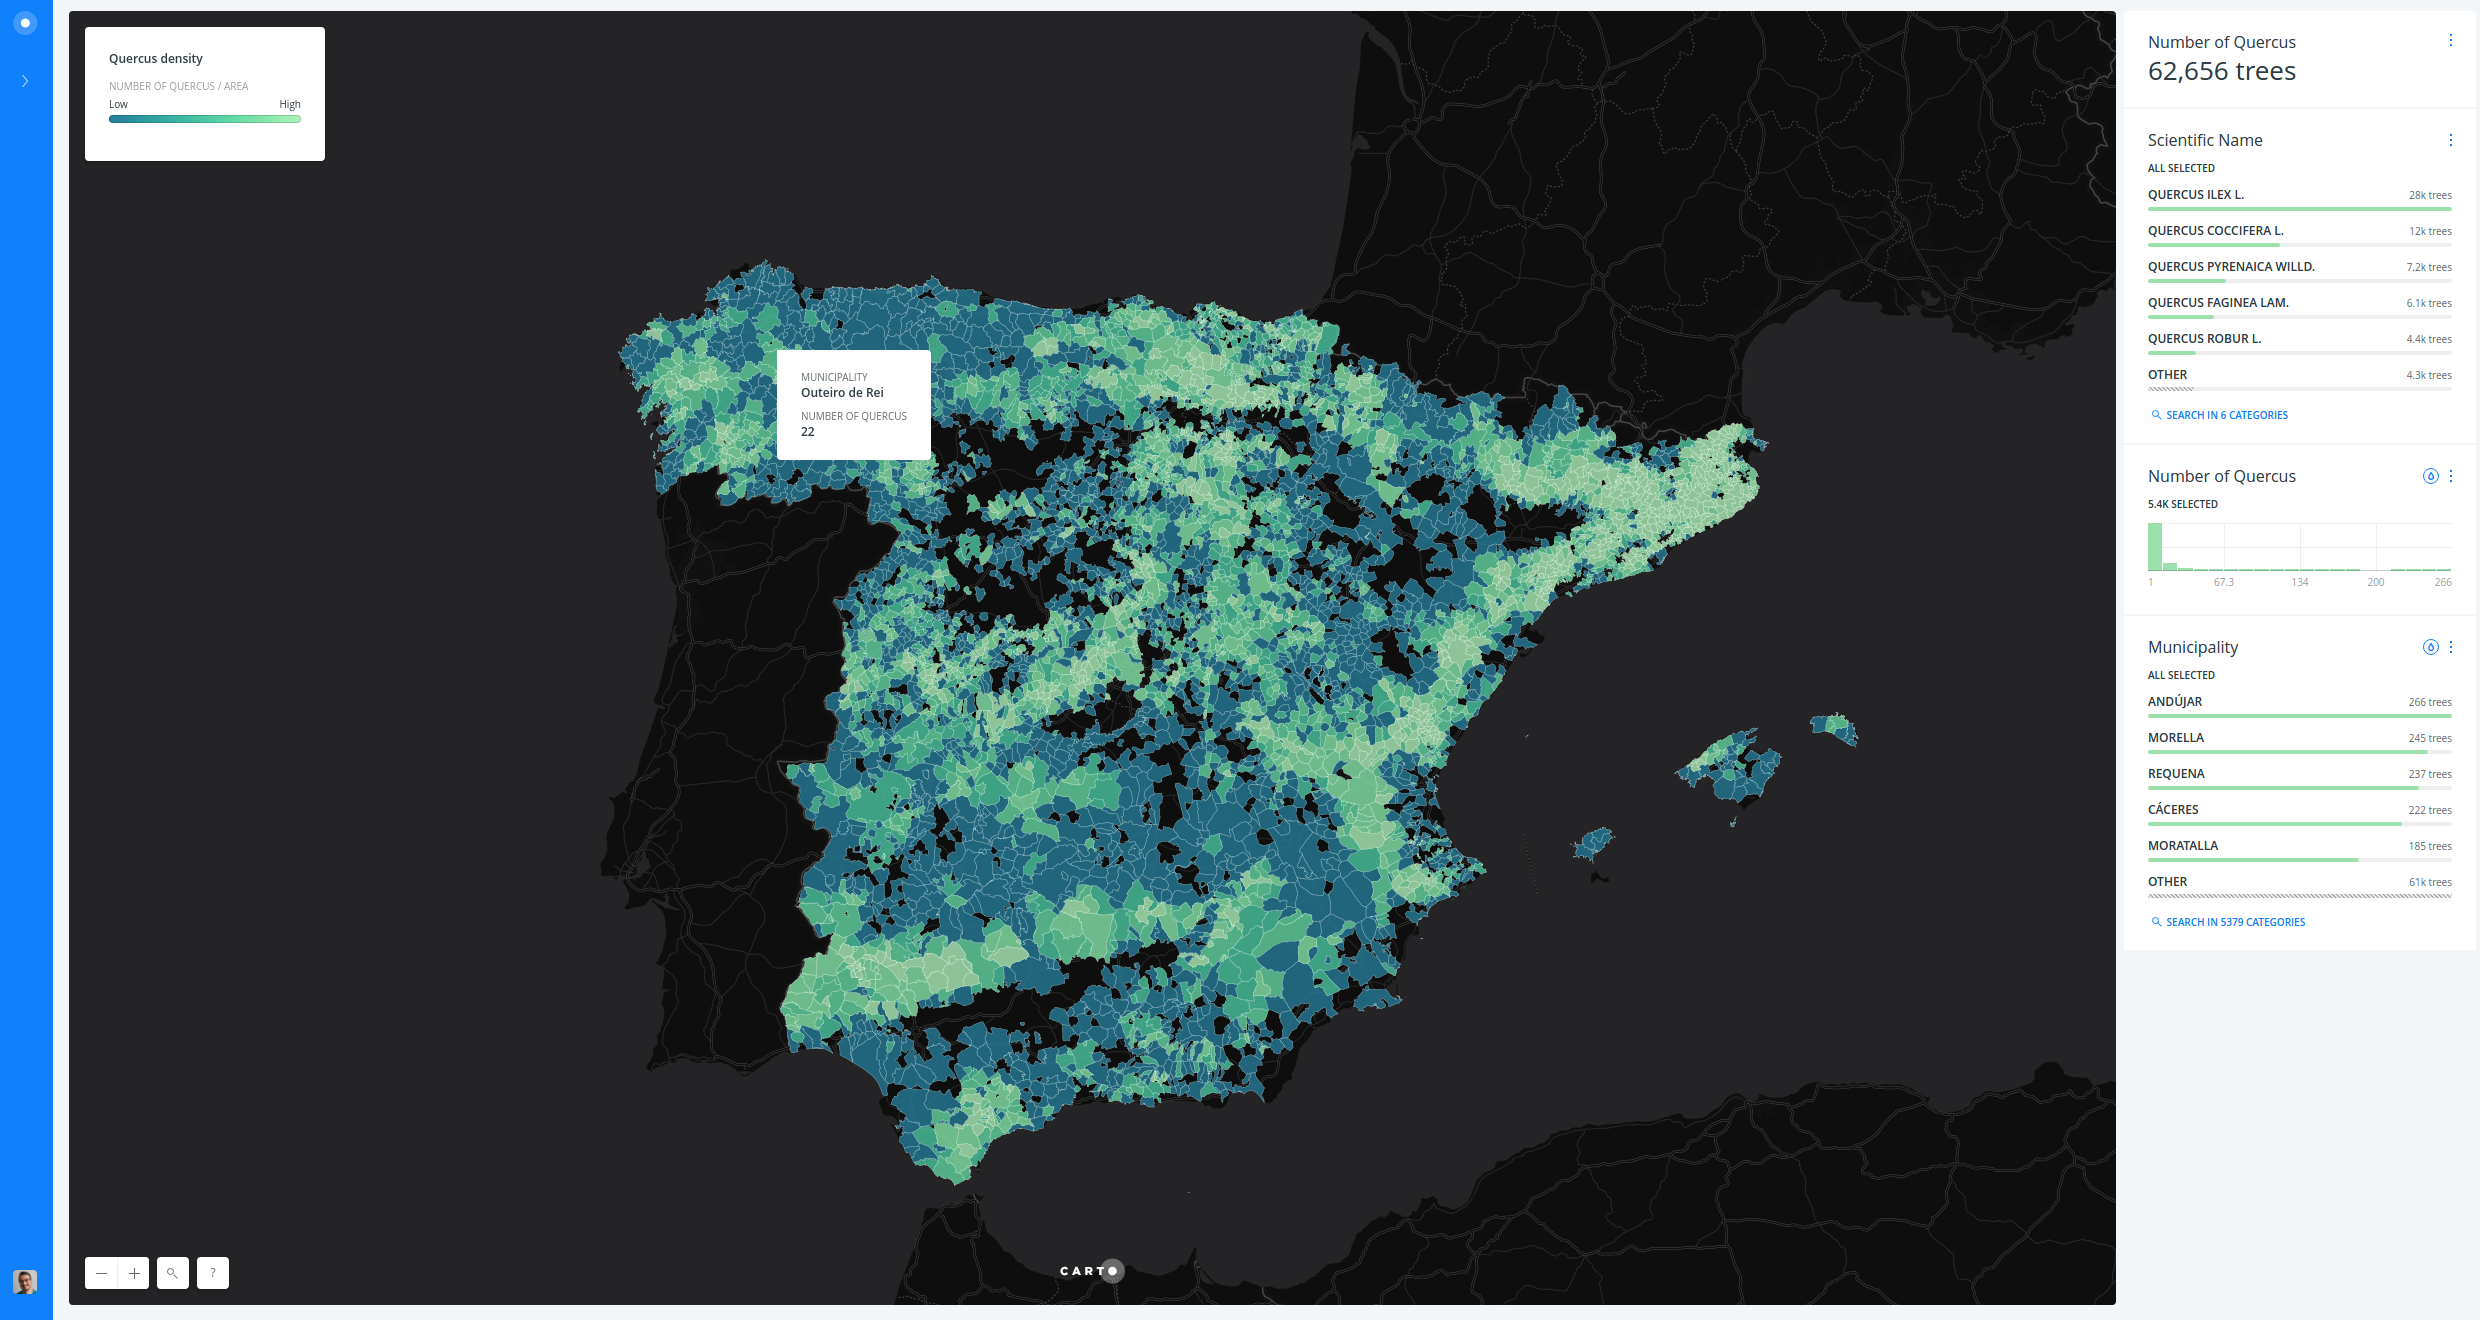
C. Quercus distribution
- Create a map connecting
quercusdataset. - Rename map title and layer name.
- Change basemap from “Positron” to “Dark Matter”.
- Add
Georeferenceanalysis to the layer, usinglatitude___processedandlongitude___processedfields. - Add some widgets:
point countandscientific_name. - Add
ign_spanish_adm3_municipalitieslayer form CARTO Data Library. - Rename municipality layer name.
- Add
Intersect with second layeranalysis to the municipalities layer, setting the quercus layer asINTERSECT LAYERand leavingCOUNTasOPERATION. - Disable the view of quercus layer.
- Add some widgets:
nameunitandcount_vals. - Change municipality style, make a choropleth map using the
count_vals_densityfield. To make the visualization better, go to the CartoCSS and add some custom properties. - Publish and share your map.
https://public.carto.com/builder/889c68e5-027e-488d-b966-d5b4b3d4c2c2/embed