Find Nearest
Find a defined number of points from one dataset and calculate the nearest, linear distance to another dataset in CARTO Builder.
The Find nearest analysis enables you to find the closest points between two datasets in CARTO Builder. This is useful if your map contains a large amount of point data within a close proximity.
“Nearest” is measured by linear distance, which calculates the spatial relationship from one point of an input layer to another point of a target layer.
- You can define the maximum number of points to be visualized near your target.
- Additionally, you can enhance the analysis by finding the closest results per group; which calculate and categorize results by a specified column from your dataset.
The result is a modified dataset that includes the target geometries as a new column.
Some examples of how you can use the Find nearest analysis might be to find the five closest ATMs near a cash-only bar, identify the top two competitors near your store, or locate the closest open spaces available for real-estate development in urban areas. For this guide, let’s find the closest fast food restaurants near downtown metro stops in Madrid, Spain.
Find the Nearest Results
- Import the template .carto file packaged from “Download resources” of this guide and create the map. Builder opens with Madrid Metro Lines as the first map layer, Station Names as the second layer, and Fast Food Locations as the third map layer.
Click on “Download resources” from this guide to download the zip file to your local machine. Extract the zip file to view the .carto file(s) used for this guide.
- From the LAYERS list, create a new layer from the original source of data for the Station Names.
CHEATSHEET: Create Layer from original source data
Each map layer identifies the connected dataset as the original source of data. From the LAYERS pane of Builder, drag and drop the original source above or below the selected layer to create a new layer. Note that the original source data is separate from analysis nodes of data (A1, A2, B1, B2), which are temporary cached results for the map layer.
- From Layer
B(Station Names), click the original source of data,madrid_stations.
Click the original source of data connected to the layer. For more details about how to use map layers, see the Understanding Map Layers in Builder Guide.
- Drag it above layer
B(Station Names), underneath layerC(Fast Food Locations).
A new layer, D, is created.
- Rename the map layer to Nearest Food to Metro.
-
Click the Nearest Food to Metro layer.
-
Click the ANALYSIS tab to add an analysis to the layer.
-
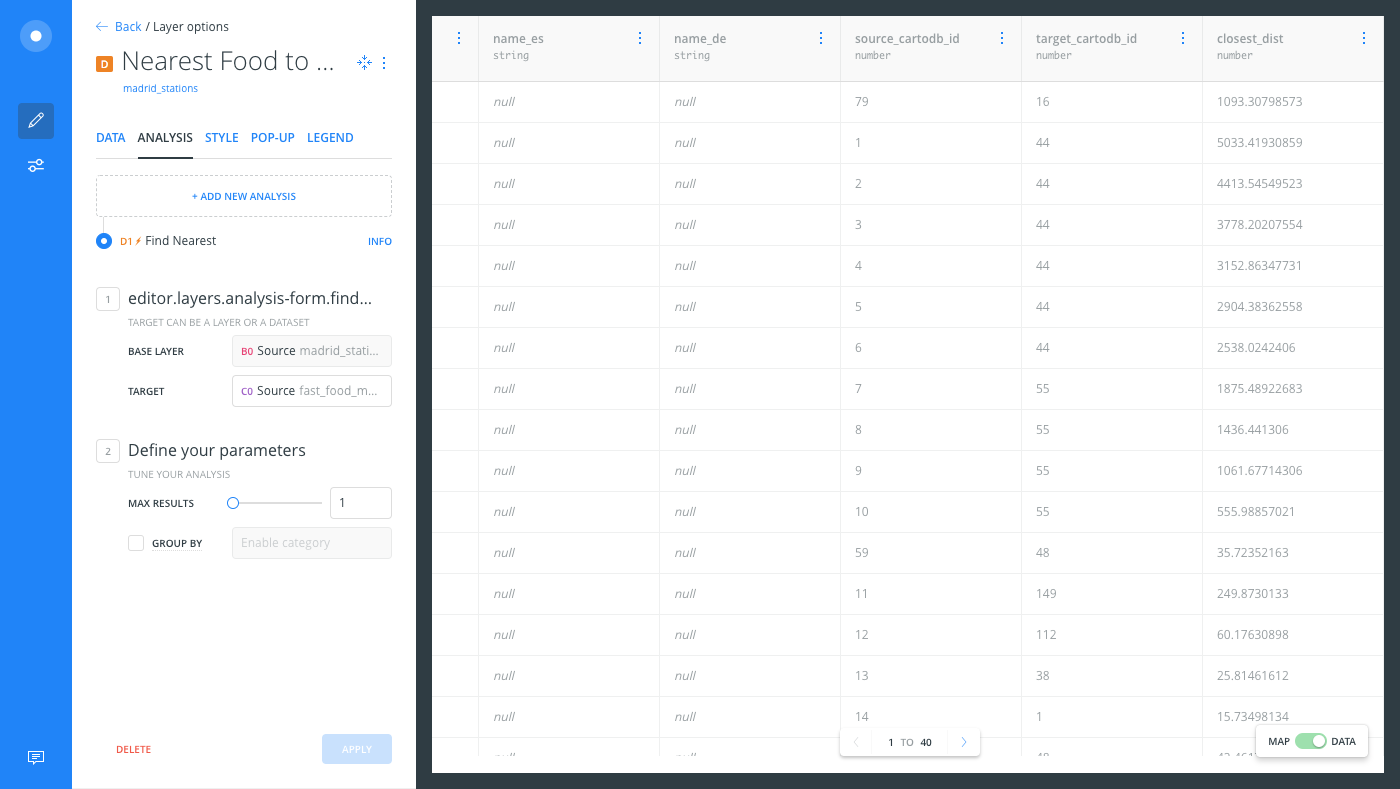
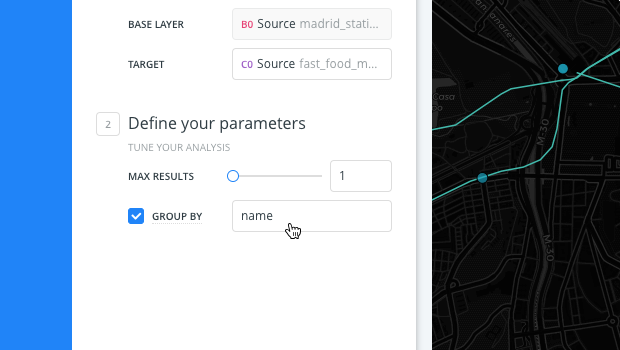
Apply the Find nearest analysis using the following parameters:
- The BASE LAYER is the selected layer.
- For the TARGET, select layer C0 Source.
- For MAX RESULTS, keep the default of 1 selected. This indicates that only a single, closest result will appear.
- Leave GROUP BY unspecified for now.
- Click APPLY.
The result displays the closest fast food location near every metro station. Optionally, you can change the MAX RESULTS to change the closest number of results. For example, show me the top three results, or the top five results, and so on.
Styling Results
- Switch to the Data View of the Nearest Food to Metro layer to see the new columns that were added to your data,
source_cartodb_id,target_cartodb_id, andclosest_dist.
The Data View and Map View appear as buttons on your map visualization when a map layer is selected. Click to switch between viewing your connected dataset as a table, or show the map view of your data.
Let’s apply some styling to better visualize the results.
-
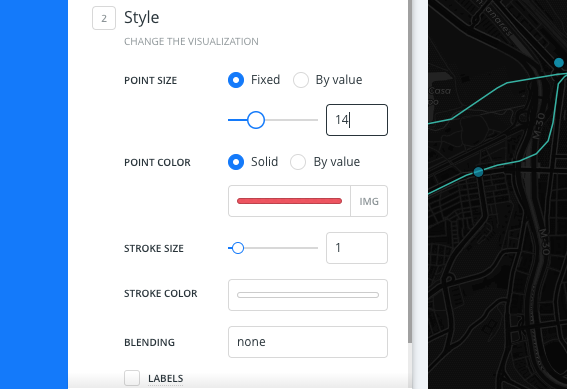
Switch back to the Map View and modify the size of the marker:
-
Click the STYLE tab.
-
Edit the POINT SIZE to 14.
-
-
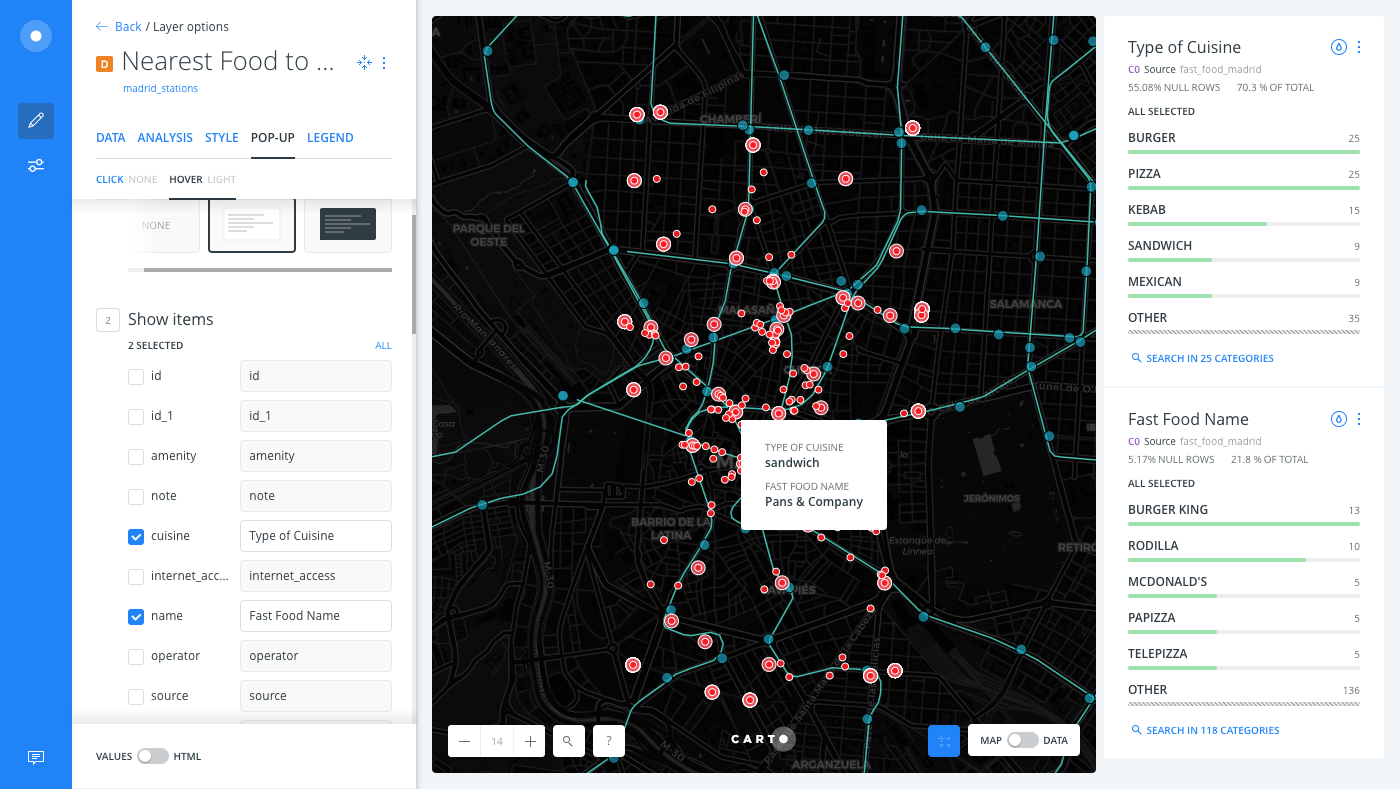
Enable hover pop-up information windows to display more details about the data:
- Click the POP-UP tab.
- Select the HOVER subtab.
- Select the LIGHT style for the pop-up.
- Click the checkbox next to the
cuisineandnamecolumns. - Rename them Type of Cuisine and Fast Food Name, respectively.
View Nearest Results per Group
Optionally, you can enhance the Find nearest analysis using the PER GROUP option, which enables you to categorize search result by a specified column. This results in a larger number of points, since you are visualizing the closest results for each group of data.
If calculating Find nearest PER GROUP, duplicated points may be generated in order to represent every instance near a group. This is intentional by design. Output geometries may be duplicated, but will have different ids.
-
From the Nearest Food to Metro layer, click the ANALYLSIS tab.
-
From the Find nearest parameter options, enable the PER GROUP checkbox.
-
Select name as the column to categorize results by.
-
Click APPLY to rerun the analysis.
The results display the closest Fast Food location, by name (McDonalds, Burger King, KFC, and so on), near each metro station. Try using the widgets to filter the results by cuisine and/or Fast Food Name.
Download the final .carto file, packaged from the “Download resources” of this guide, to view how all of these enhancements were made. The final map also contains a custom legend, which include symbols and text to describe your map data. Additional enhancements could be to join the results to the source dataset as another analysis, or style the layer by a column value (using the newly created columns).
Limits
This analysis has a limit on the number of rows that it can process. If the layer has more than 1000000 rows, then the analysis will return an error.
External Resources
If you are interested in using the underlying functions in the SQL view of Builder, view the ST_Distance PostGIS documentation about spatial relationships, and the ORDER BY description about PostGIS operators.