Geocoding with Builder using Latitude and Longitude
Apply the Geocode analysis to convert latitude and longitude data into geometries with CARTO Builder.
Why do you need this?
-
 You have a dataset with latitudes and longitudes that you need to visualize.
 -
 You are a Builder user.
Types of Geocoding
Check out this article to learn about all the different ways you can geocode your data using CARTO.
To learn more about our different geocoders that we use in CARTO, check out this article.
See the Preparing and Formatting Data Guide for tips about prepping data before it is imported.
Objective
For this guide, we will use latitude and longitude to plot addresses in Paris.
Geocode Data into Point Geometries
We will use the location of Paris addresses, provided by openaddresses.io. This example displays the intense flooding that occurred in Paris; similar to the flood that occurred in 1910. The data is derived from Open Data of Paris, and the results are applied as point coordinates.
-
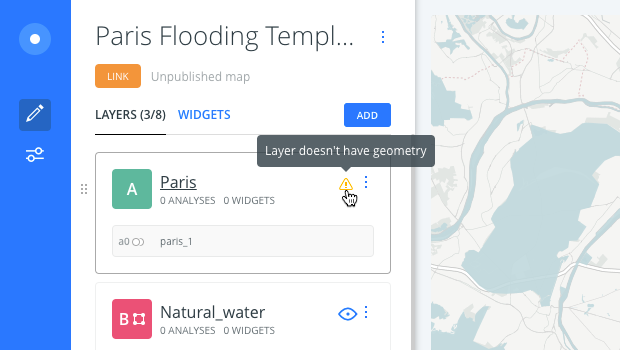
Import the template .carto file, packaged from “Download resources” of this guide and create the map. Builder opens with Paris data as the first map layer, Natural_water as the second map layer, and Flood_zone as the third map layer.
Click on “Download resources” from this guide to download the zip file to your local machine. Extract the zip file to view the .carto file(s) used for this guide.
Notice that the Paris map layer does not identify what type of geometry the data contains.

-
Switch to the Data View of the Paris map layer and you will notice that there are various columns with address information.
The Data View and Map View appear as icons on your map visualization when a map layer is selected. Click to switch between viewing your connected dataset as a table, or show the map view of your data.
Since the original data is in French, the translation of languages may complicate the geocoding of data. We will use the
lonandlatcolumns from our dataset to geocode all of the geometry coordinates. -
Click the ANALYSIS tab to add an analysis to the Paris map layer.
-
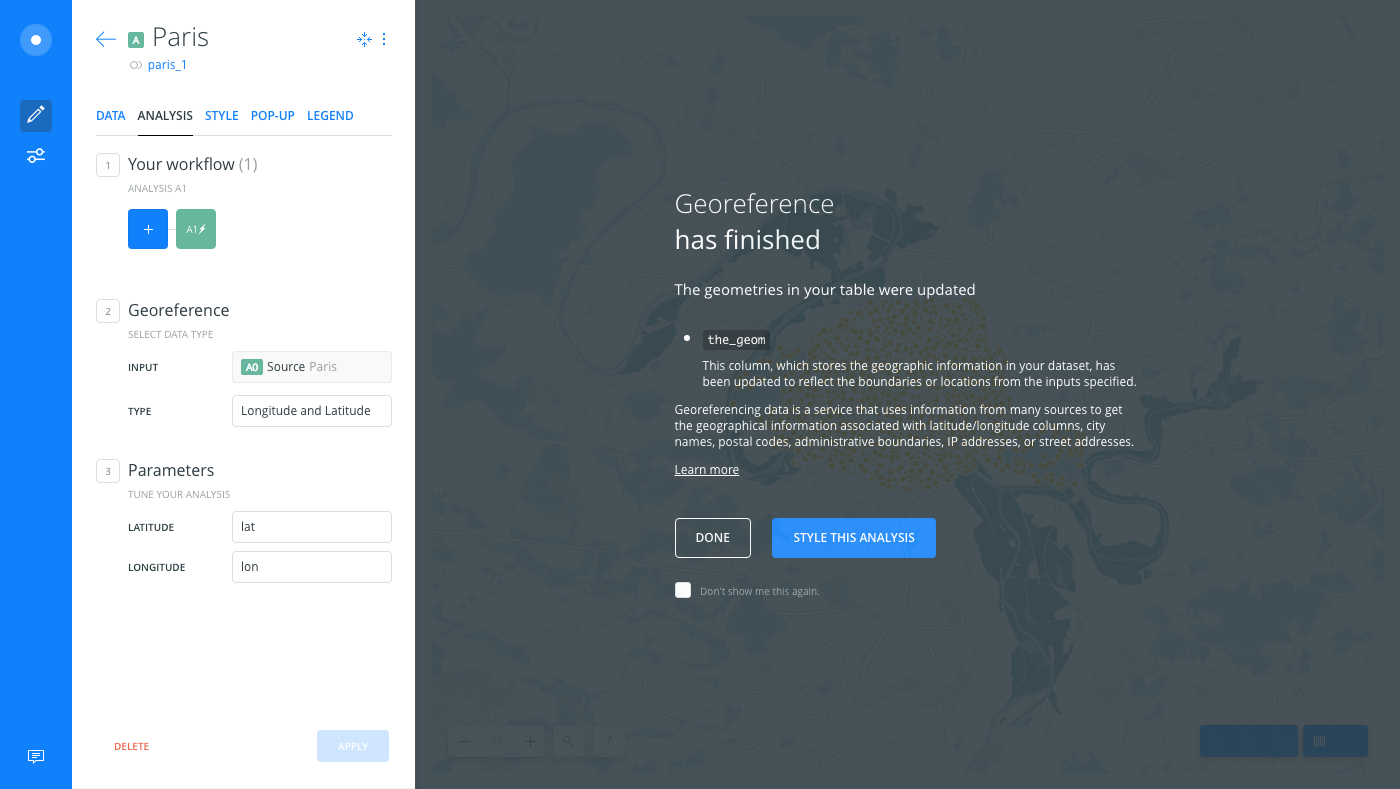
Select Geocode from the Add a new analysis options.
-
Keep Longitude and Latitude selected as the Geocode TYPE.
-
You must enter the LATITUDE and LONGITUDE parameters before applying the analysis. For this example, select the lat and lon columns from the Paris dataset.
-
Click APPLY. The analysis confirmation dialog appears, which you can use to apply styling.

-
-
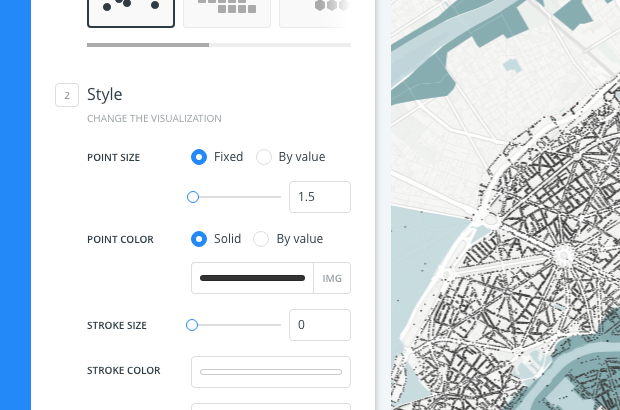
Click STYLE THIS ANALYSIS to visually enhance the buildings within the flood-zone.
- Change the POINT SIZE to 1.5.
- Change the POINT COLOR to black.
- Change the STROKE SIZE to 0.

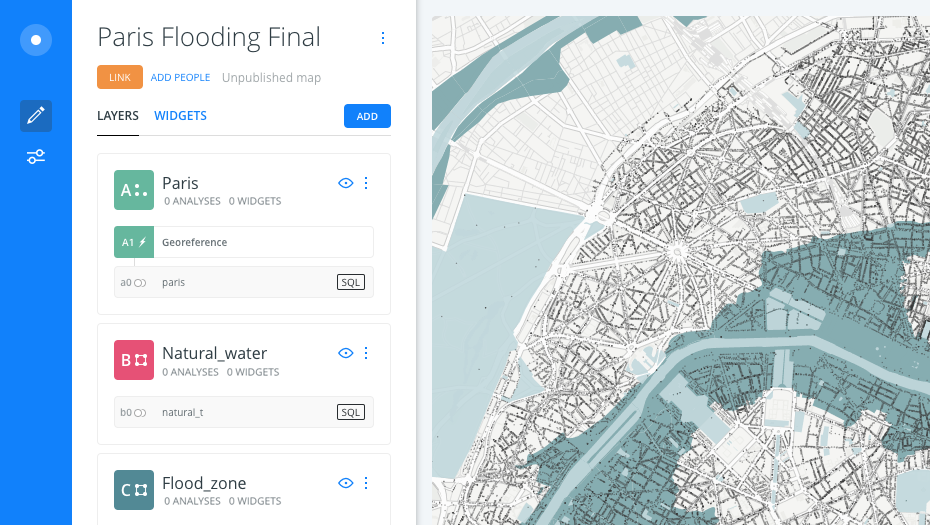
Optionally, download the final .carto file from the “Download resources” of this guide to see the styling options that were applied.
The analysis geocoded the Paris data into point geometries, and the Geocode analysis is linked to the map layer. You can continue to explore the point geometry data for Paris.

Geocode with the API
If you are a developer and have access to the CARTO Engine’s to manage your data, view the Geocoding Functions that can be applied with the Data Services API.
 What’s next?
-
 Learn how to geocode city and admin regions in Builder.
-
 Learn how to geocode country borders and IP addresses in Builder.
-
 Learn how to geocode street addresses in Builder.