Link Second Layer
Link Second Layer allows you to connect data from two or more layers, and filter the results with a single widget.
When exploring data with widgets, filtering subsets of data is easy to visualize. If you have a map with multiple layers, you can apply the Link Second Layer analysis to create a virtual link between two layers. This enables you to filter two layers using one widget. In order to apply this analysis, there must be a related column from both map layers.
The Link Second Layer analysis is a widget-only enhancement that is specific to linking multiple layers to one widget. If you styled the base layer by column value, any custom styling is removed and replaced with default styling when Link Second Layer is applied.
For this guide, we will link population data within borders of the world, and use a category widget to filter both map layers.
Create Map and Filter Data
This section provides a default map with two layers. Each layer contains a widget that filters data related to the connected map layer.
-
Import the template .carto file packaged from “Download resources” of this guide and create the map. Builder opens with World Borders as the first map layer, and Populated Places as the second map layer.
Click on “Download resources” from this guide to download the zip file to your local machine. Extract the zip file to view the .carto file(s) used for this guide.
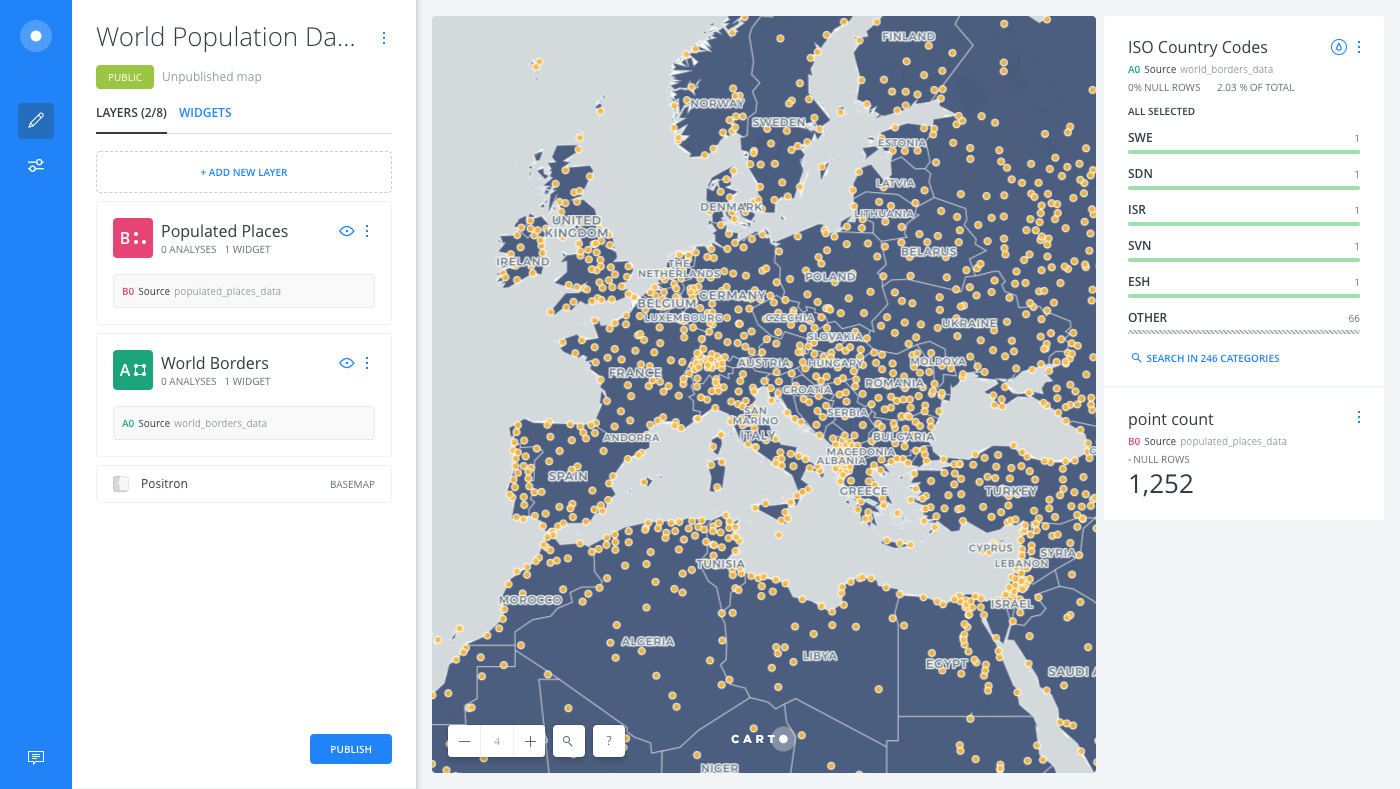
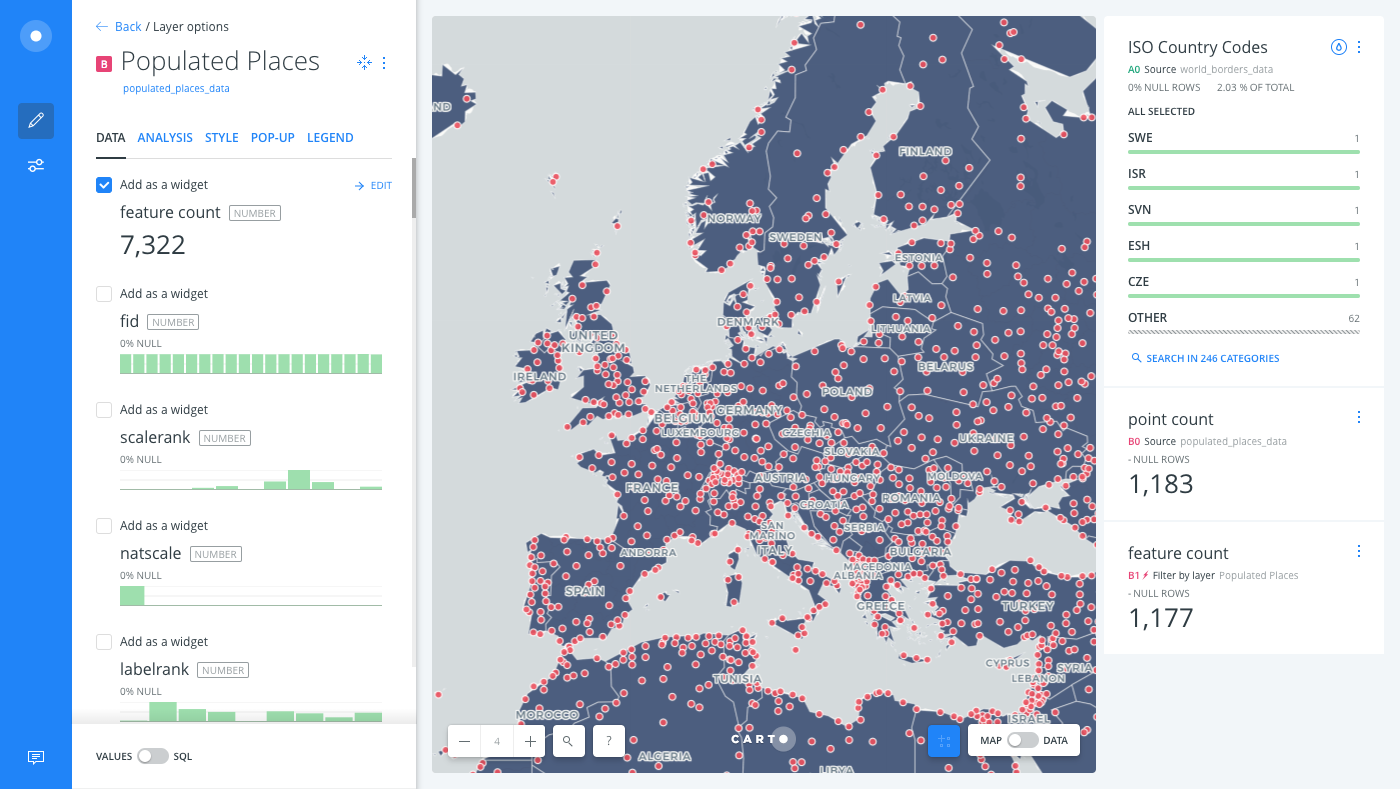
A category widget displays International Organization for Standardization (ISO) country codes from the World Borders layer(A0). A formula widget displays the total point count from the Populated Places layer (B0).
-
From the Map View, zoom in (+) to visualize how both widgets filter data, based on the zoom level of your map visualization.
-
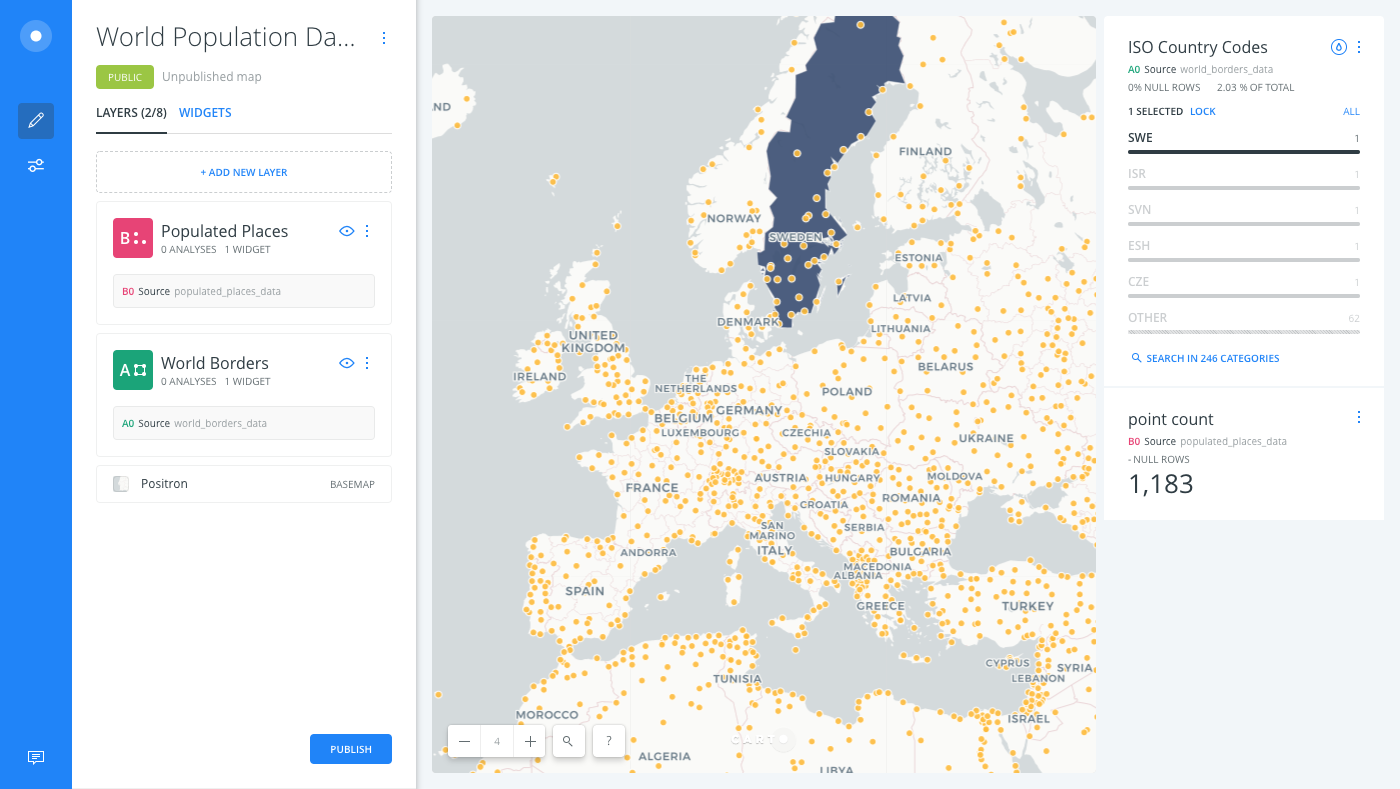
Filter data by the Populated Places layer.
Select SWE to show default filtering when one category is selected. While the map visualization changed, the Populated Places point count widget did not update, since that data that data is connected to a different map layer.
Link Second Layer
Apply the Link Second Layer analysis to the Populated Places layer. This will link the category widget to both map layers.
-
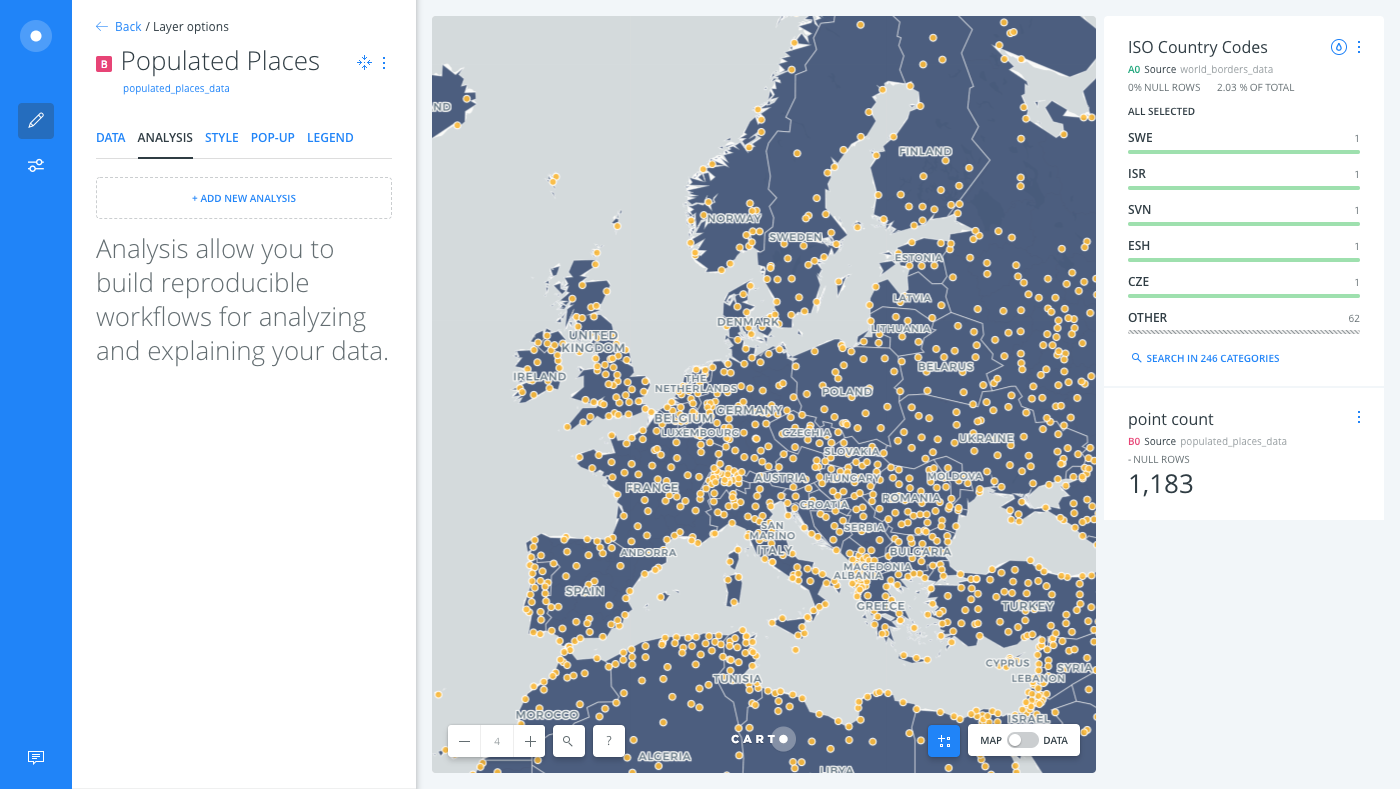
From the LAYERS list in Builder, click the Populated Places map layer.
-
Click the ANALYSIS tab to add an analysis to the layer.
-
Apply the Link Second Layer analysis.
- From Link Second Layer, select
World Borders. - Select
sov_a3as the SOURCE COLUMN, which include Natural Earth ISO 3-digit alpha codes for world borders. - Select
iso3as the FILTER COLUMN, which include ISO 3-digit alphabetic codes for population data. - Click APPLY.
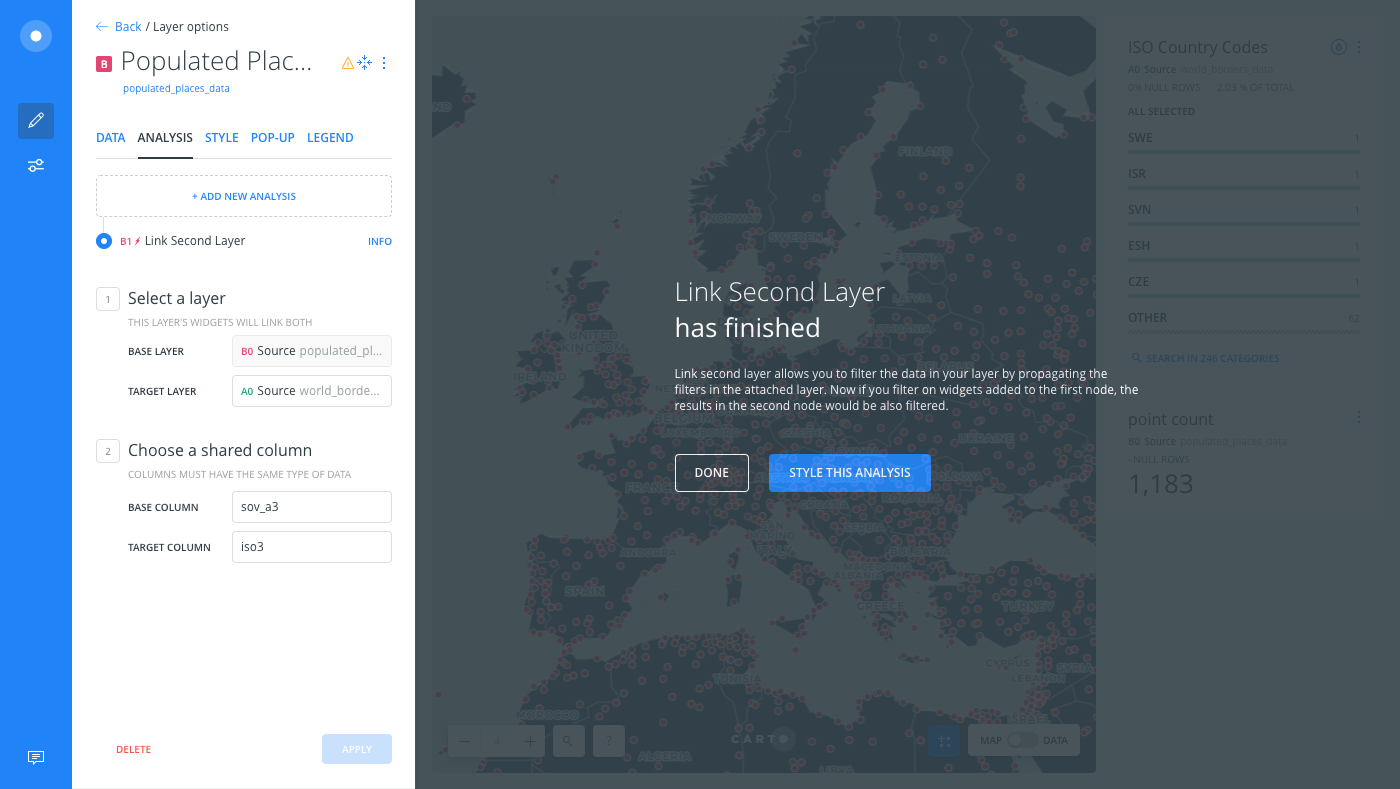
The original point count widget does not update automatically, since it is still linked to the original source of the Populated Places layer (B0). As the result of the Link Second Layer analysis, a new node of data (B1) contains an updated point count with the filtered results from the World Borders layer.
- From Link Second Layer, select
-
Click the DATA tab of the Populated Places layer to add the updated formula widget that is linked to populated places.
-
Click the checkbox next to point count.
There are two point count widgets. In the next section, rename the widget and filter data to visualize the difference between the original widget (B0) and the analysis results widget (B1).
Rename and Delete Widget
Rename the newly added widget, so that we can visualize the change in behavior, and delete the old widget.
-
From the DATA tab of the Populated Places layer, click EDIT next to the point count widget that you just added.
The WIDGETS list opens, from which you can manage and add widgets.
-
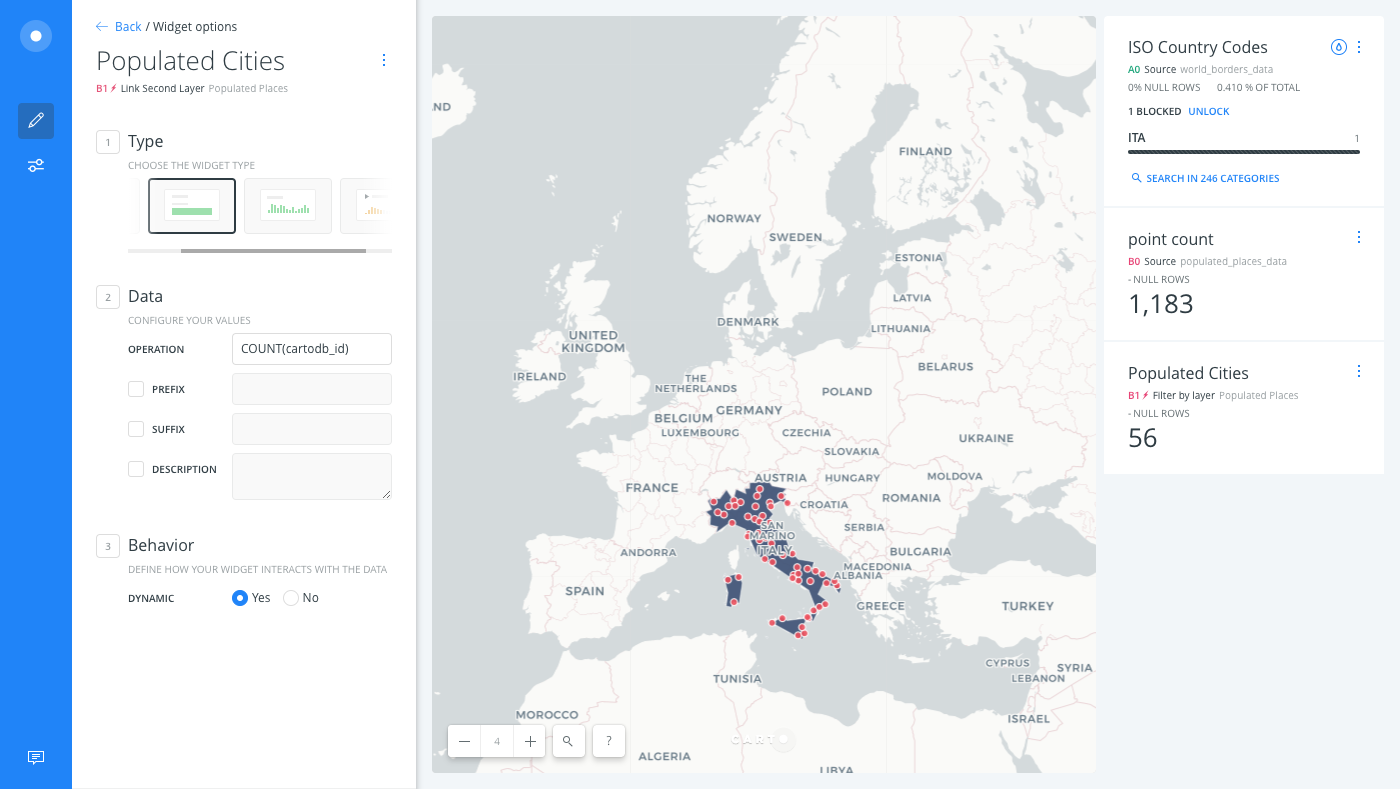
Double-click on point count and type Populated Cities.
The widget displays the renamed title.
-
Filter data by the Populated Places layer.
Select ITA to show filtering when one category is selected. The map visualization changes and the Populated Cities updates!
-
Since we do not need the original point count widget that is still connected to the Populated Places layer (B0), delete it.
You can delete widgets directly from the map by using the widget name context menu. Note that the WIDGETS list displays the layer (or analysis node) that widgets are attached to.