Subsample Percent of Rows
Subsample percent of rows enables you to view a random subset of data and keeps your data size more manageable.
The Subsample percent of rows analysis enables you to view a random subset of data. This is useful if you need to sample the size of a large dataset. You can also use this analysis to reduce the size of data for a connected map layer while you are defining an analysis workflow. This keeps your data more manageable and improves performance.
Behind the scenes, a percentage of rows is randomly applied to a base layer. The result displays a selection of rows from the selected map layer.
If you have a long-running analysis, apply Subsample percent of rows as the first analysis in the workflow for your map layer. This helps improves the performance of the rest of the analyses in the chain. You can always use widgets to visualize all of the values from the original source of data.
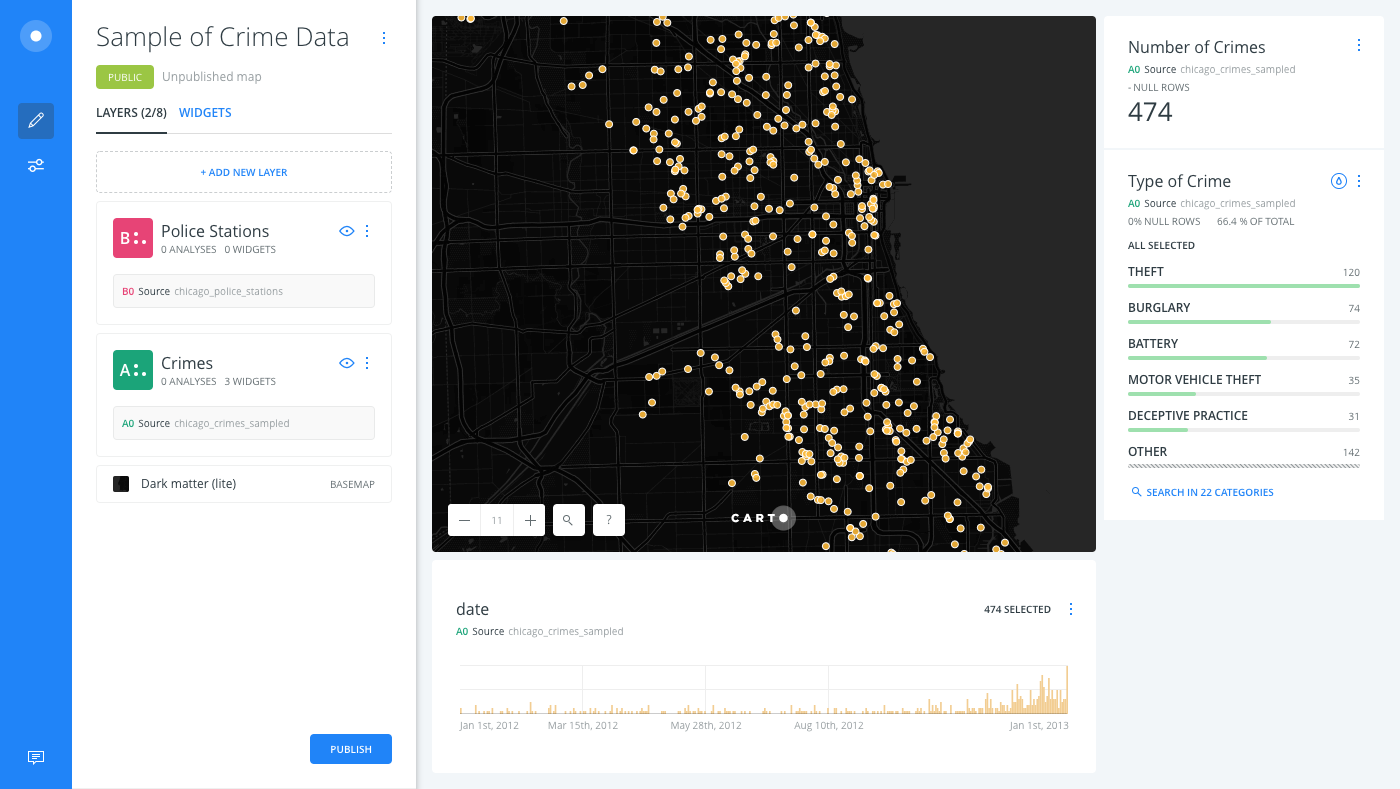
For this guide, let’s view reported crime activity located around police stations in Chicago. Since there is a large amount of crime data, let’s sample and visualize only 10% percent of the crime data.
Randomly Reduce the Size of the Dataset
-
Import the template .carto file packaged from “Download resources” of this guide and create the map. Builder opens with Crimes as the first map layer, and Police Stations as the second map layer.
Click on “Download resources” from this guide to download the zip file to your local machine. Extract the zip file to view the .carto file(s) used for this guide.
There are several widgets on the map that allow you to filter the crime data. View the widget guides for details about how to create widgets.
-
From the LAYERS list, click the Crimes layer.
-
Click the ANALYSIS tab to add an analysis to the layer.
-
Apply the Subsample percent of rows analysis.
- The BASE LAYER is the selected layer, A0 Source.
- Keep the default % OF DATA as 10.
- Click APPLY.
The result is a sample of your original data that was randomly selected to display approximately 10% of the rows from the Crime dataset.
Viewing Crime Data with Widgets
If you click on the WIDGETS list, notice that the widgets are still filtering the entire crime dataset, A0 Crime.
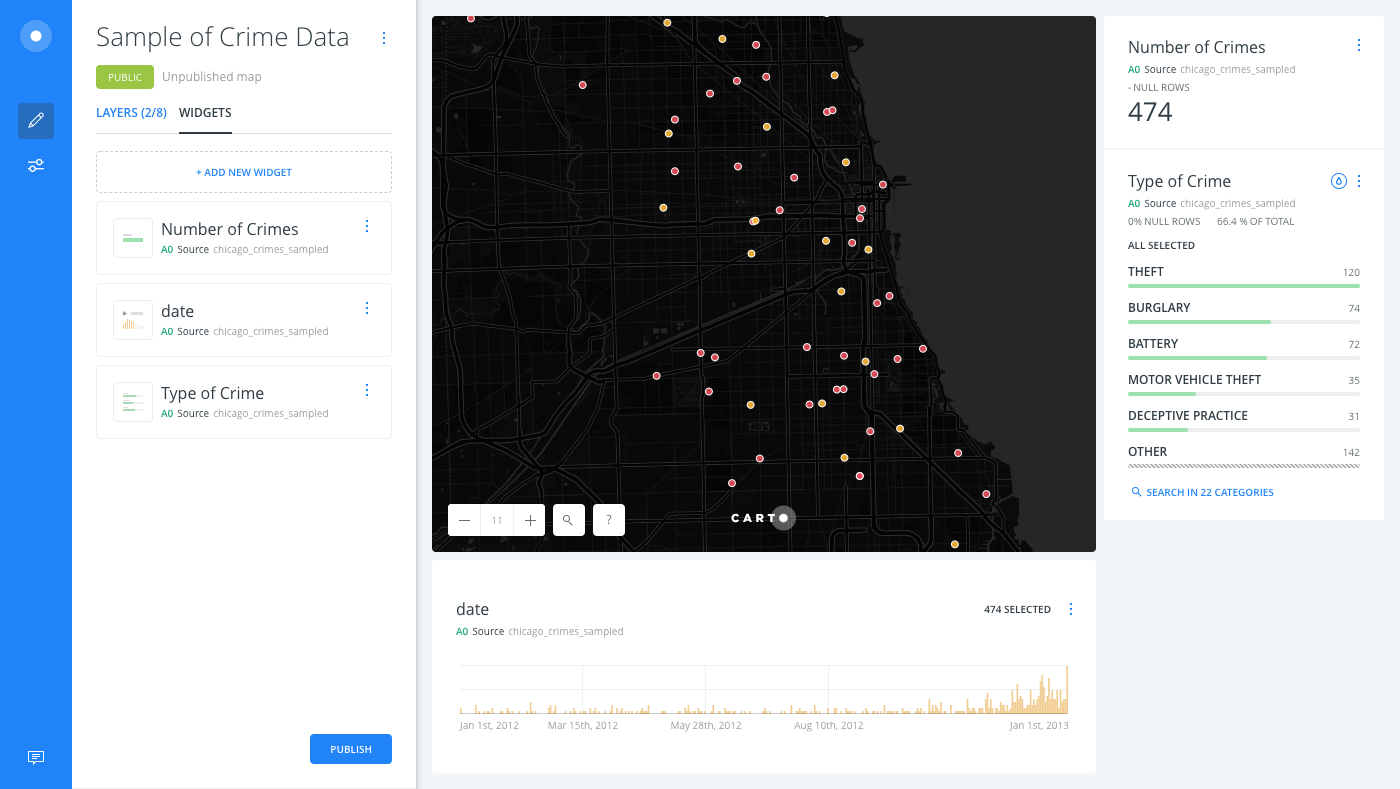
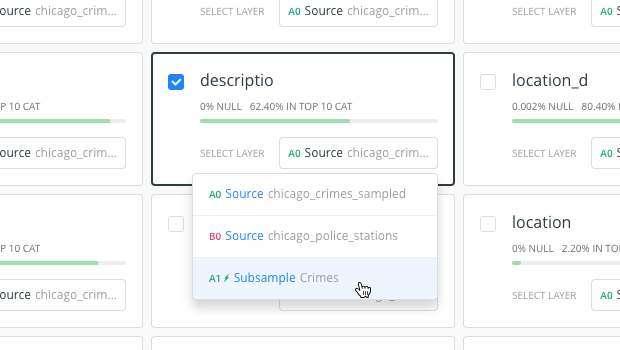
If you wanted to filter only the sampled data, you could add a new widget to filter by the analysis results, A1 Subsample.
View Understanding Map Layers for details about working with map layers in Builder.
Limits
This analysis has a limit on the time that it takes to execute the analysis. If the analysis takes more than 5 minutes, CARTO will return a timeout error.
External Resources
If you are interested in using the underlying functions in the SQL view of Builder, view the random() PostgreSQL documentation about mathematical functions.