Understanding Map Layers in Builder
A guide about how map layers are used to discover key insights about your data in CARTO Builder.
Who can use this feature?
-
 Every kind of role can use this feature.
 -
 Available on free and paid plans.
Once datasets are connected to your CARTO account, use Builder to add map layers and discover key insights about your location data. This guide describes how to view and work with map layers in CARTO Builder.
If you are unsure how to connect data to your CARTO account, view the Getting Started with CARTO Builder Guide.
Viewing Map Layers in Builder
When opening a map in Builder for the first time, LAYERS and WIDGETS for the selected map appear. The LAYERS list appears by default, displaying the basemap and map data layer(s) that are the backbone for rendering your visualization. The WIDGETS list enables you to add interactive widgets for visualizing and filtering your data.
The following map displays a single layer in the LAYERS list, which contains point geometries.
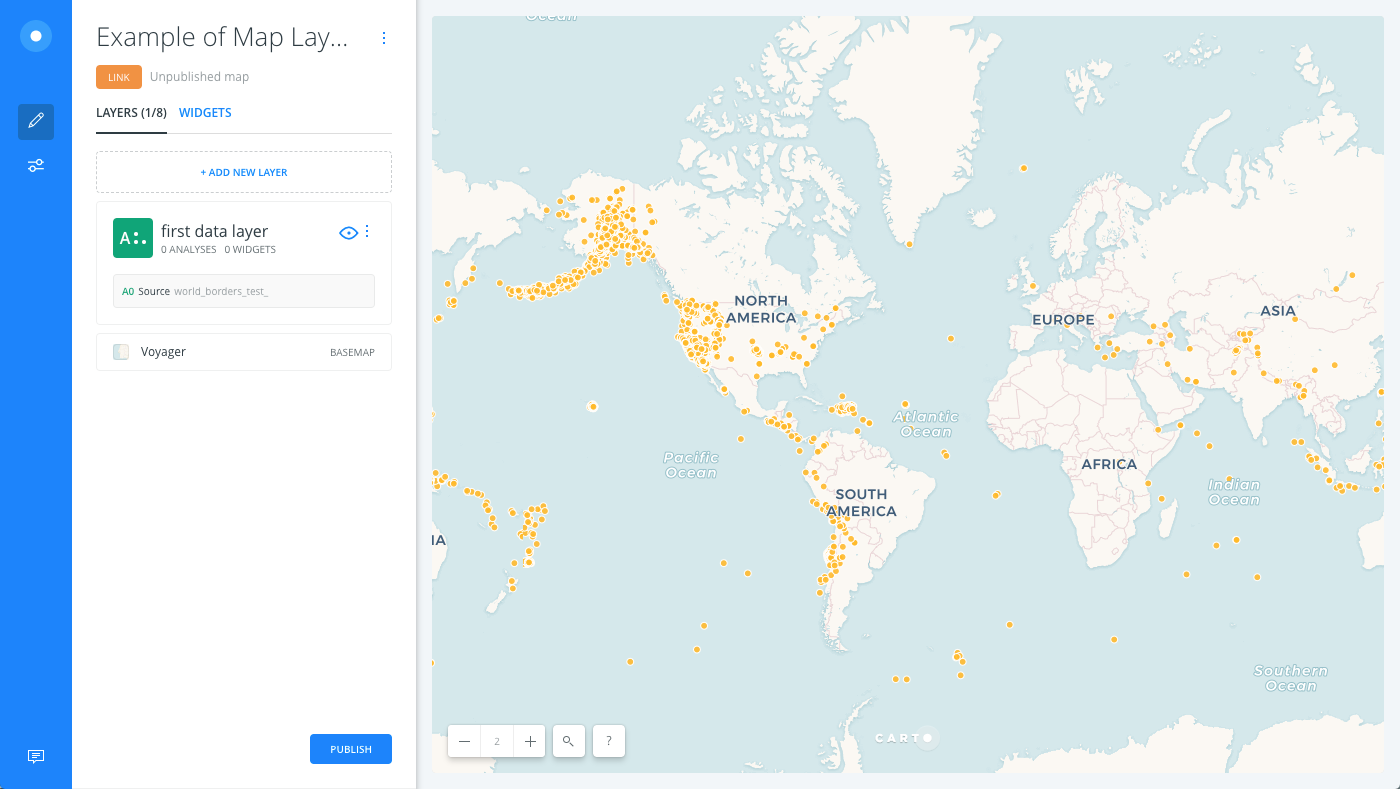
The default basemap (Voyager) that is used to render the background image of your map also appears in the LAYERS list. You can edit the basemap source and style.
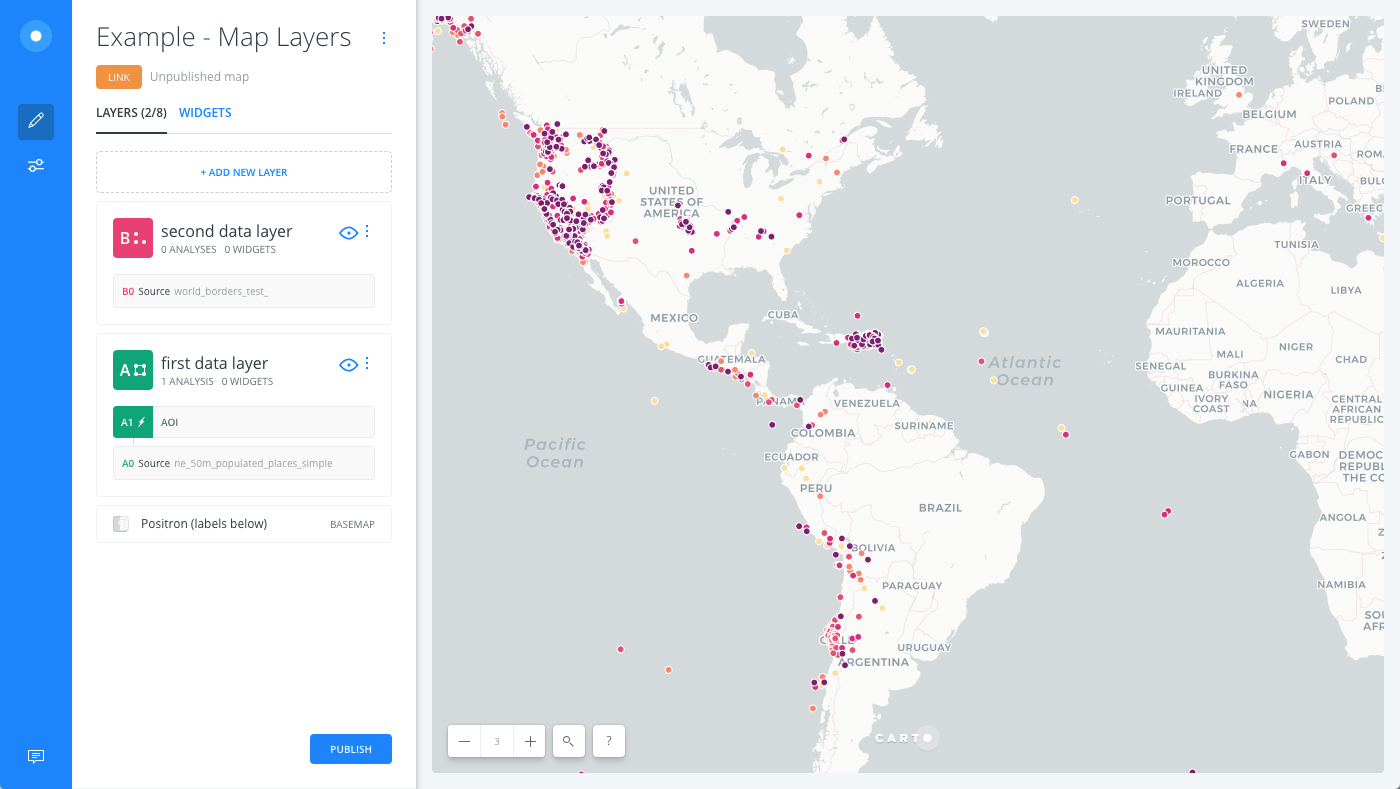
As another example, the following image displays a map with multiple layers, A and B. Note that layer A has an analysis A1 applied as part of the workflow for rendering the data, and the basemap was changed to Positron (labels below).
Working with Map Layers
When working with layers in the LAYERS list of Builder, the following features are available:
-
Click ADD NEW LAYER to add a new layer to your map. The number of layers allowed is based on your account plan.
-
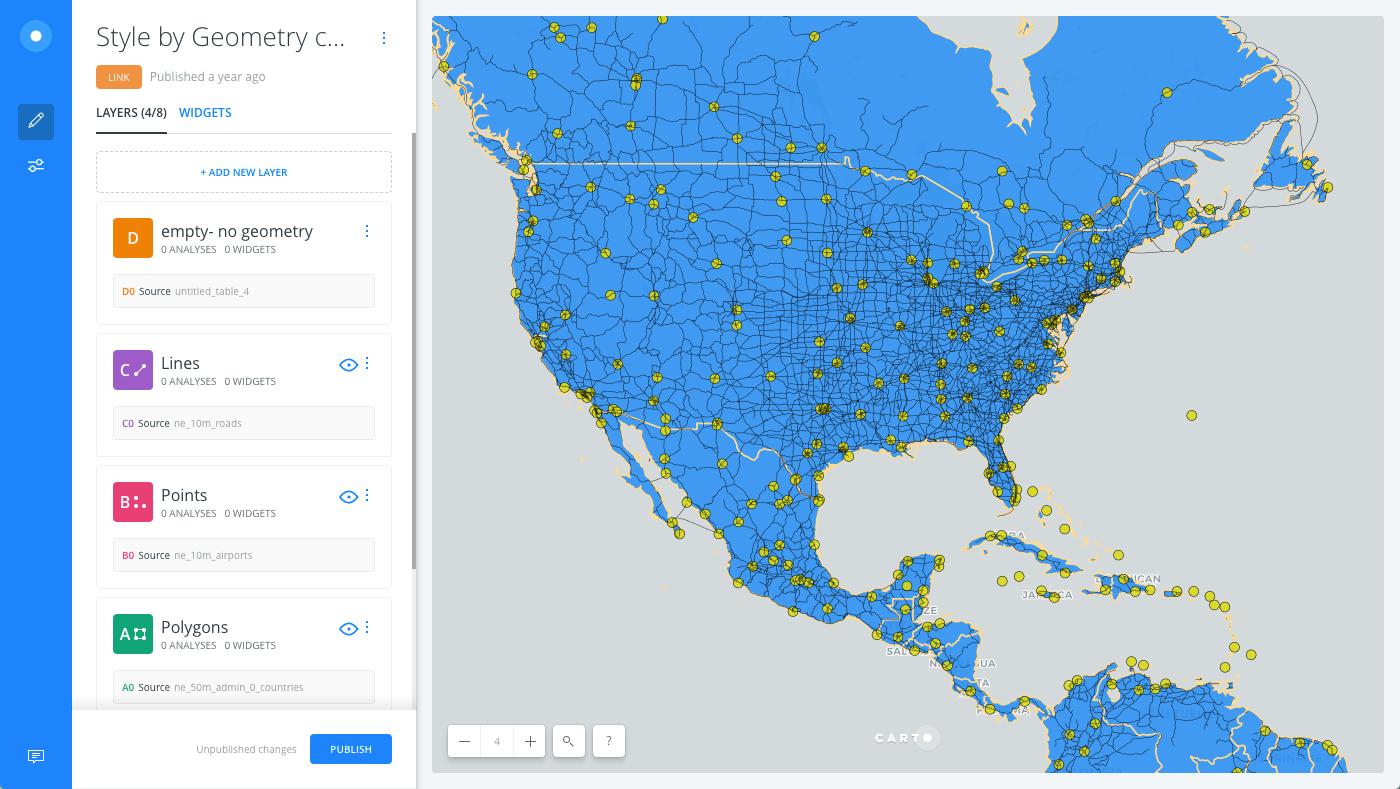
Layers are created alphabetically (A, B, C, D) and each layer displays a unique color. Each layer icon displays the geometry type behind the data as either point, line, polygon, or empty.
 If your layer does not contain any geometries, you can create and manage data by drawing geometries. For datasets without geometries, apply the Geocode analysis option to your layer.
 -
Layers are rendered from bottom to top, with basemaps being the bottom layer.
-
Click and drag a layer to rearrange the hierarchal order of how layers are rendered on your map.
Why rearrange the hierarchal order of layers? When styling a map with multiple layers, the order of the layers reflects the order in which they are visualized. You may need to adjust the styling for each layer to accommodate conflicting features.
You cannot reorder where the basemap appears in the LAYER list of Builder. This is intentional by design, so that your visualization appears correctly.
-
When you click on a layer, the DATA, ANALYSIS, STYLE, POP-UP, and LEGEND options are available for the selected layer.
When a map layer is selected, you can access the CartoCSS view (from the STYLE tab of a selected layer), the HTML view (from the POP-UP tab and LEGEND tab of a selected layer), and the SQL view (from the DATA tab of a selected map layer).
-
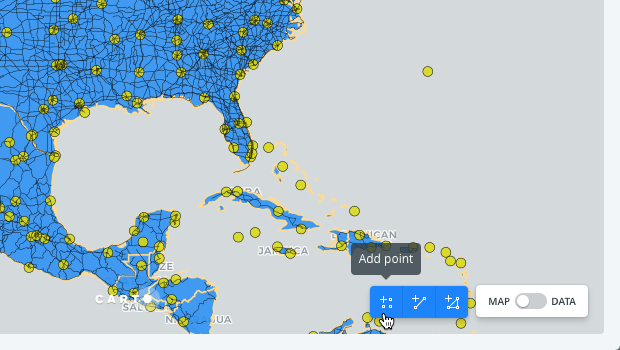
The Data View and Map View appear as buttons on your map visualization when a map layer is selected. Click to switch between viewing your connected dataset as a table, or show the map view of your data. Additionally, you can access the connected dataset directly from the selected layer.
The Map View also displays icons to edit the geometries in your connected map layer. The icons that appear vary, depending on your data. For details, see the Create and Manage Data by Drawing Geometries Guide and the Editing Geometries with Analysis Guide.
-
If your connected dataset was manually modified, the map layer indicates that a SQL query was applied.
-
Show or Hide a layer from your visualization by clicking the eyeball icon. All layers are displayed by default. This is helpful when you are styling multiple layers, or if you want to show or hide selected layers for your published map.
-
Manage the details of the layer by clicking the three vertical dots, located next to the layer name. These options enable you to manage the details of your layer in Builder. For example, you can rename or delete a selected layer.
-
Center map on layer refreshes your Map View by centering the map on the selected layer. You can access this option from icon when a layer is selected.
-
If an analysis workflow is applied to your data, the layer displays the analyses nodes (A1, A2, B1, B2) that are applied to your layer.
-
Analysis nodes act like sublayers in association with each map layer that they are applied to. You can automatically create a new layer from analysis results by clicking the analysis node (A1, B2) from the LAYERS list, and dragging it above or below the selected layer to create a new layer.
Similarly, you can click and drag the original source of data from a map layer to create a new layer.
-
Analysis nodes (A1, B2) can be selected as the source for creating widgets, initiating dynamic filtering.
Now that you understand how to work with layers, explore your data by selecting each layer and apply custom styling, analysis, and widgets.