How to convert arrays to json objects
Learn how to convert arrays to json objects to display their data in Builder popups
CARTO supports json (and jsonb) data types. The json_agg PostgreSQL function allows us to aggregate information in json objects*.
  SELECT wb.cartodb_id,
         wb.name as country,
         wb.the_geom,
         json_agg(
             row_to_json(
                 ( SELECT r
                     FROM ( SELECT pp.name as city,
                                  pp.pop_max as population
                          ) r
                 ),
                 true
             )
         ) as json
    FROM world_borders wb
    JOIN populated_places pp
      ON wb.name = pp.adm0name
GROUP BY wb.cartodb_id
You will end up with a table with rows similar to this one:
| cartodb_id | the_geom | city | json |
|---|---|---|---|
| 166 | Polygon | Portugal | [{“city”:”Coimbra”,”population”:106582},{“city”:”Aveiro”,”population”:54162},{“city”:”Leiria”,”population”:45112},{“city”:”Viana Do Castelo”,”population”:15555},{“city”:”Beja”,”population”:35854},{“city”:”Evora”,”population”:55620},{“city”:”Portalegre”,”population”:15581},{“city”:”Santarem”,”population”:29385},{“city”:”Braganca”,”population”:34375},{“city”:”Castelo Branco”,”population”:33479},{“city”:”Guarda”,”population”:32111},{“city”:”Viseu”,”population”:26364},{“city”:”Vila Real”,”population”:17001},{“city”:”Braga”,”population”:826833},{“city”:”Covilha”,”population”:24828},{“city”:”Horta”,”population”:6611},{“city”:”Angra do Heroismo”,”population”:12045},{“city”:”Portimao”,”population”:61226},{“city”:”Faro”,”population”:41355},{“city”:”Setubal”,”population”:117974},{“city”:”Porto”,”population”:1337000},{“city”:”Funchal”,”population”:204767},{“city”:”Ponta Delgada”,”population”:61526},{“city”:”Lisbon”,”population”:2812000}] |
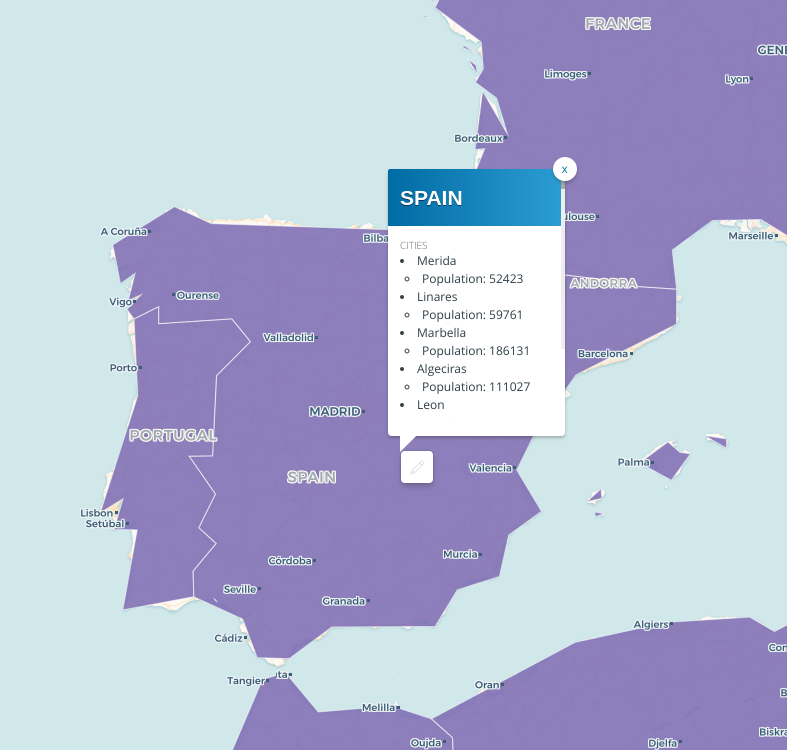
This aggregated information can be extracted with a custom popup iterating over the objects with MustacheJS. First you need to assign the json object to the ul element using {{#json}}, and then iterate it to get the city and population values for each item of the list using and respectively.
<div class="cartodb-popup header blue v2">
  <a href="#close" class="cartodb-popup-close-button close">x</a>
  <div class="cartodb-popup-header">
    <h1></h1>
    <span class="separator"></span>
  </div>
  <div class="cartodb-popup-content-wrapper">
    <div class="cartodb-popup-content">
      <h4>Cities</h4>
      <ul style="list-style-type: disc; list-style-position: inside; ">
      {{#json}}
      <li>
        <ul style="margin-left:5px;list-style-type: circle; list-style-position: inside; ">
          <li>Population: </li>
        </ul>
      </li>
      {{/json}}
      </ul>
    </div>
  </div>
  <div class="cartodb-popup-tip-container">
  </div>
</div>

*If you are in the dataset view, a [Object Object] value will be shown in the dataset cells.