Managing your data with CARTO Editor
Learn how to manage your data with CARTO Editor.
While you can apply many styling options with the CARTO Editor, you can also geocode your data and run several types of queries to manage and visualize your data.
Geocoding Data
CARTO understands that geocoding is essential to data management. You can edit your dataset (or map) and apply geocoding coordinates to transform your data. This section describes the available geocoding options.
Editing Geocoded Data
-
Visit the Data page and click on a dataset.
The page refreshes displaying the Data View for the selected dataset.
-
Select Georeference from the Edit drop-down menu.
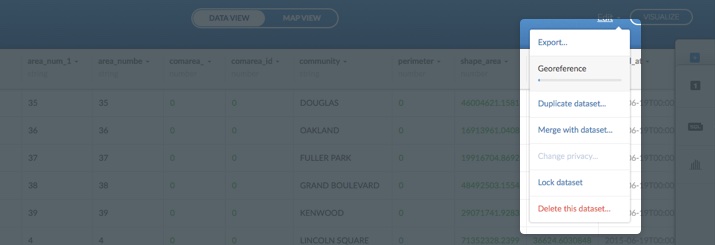
Tip: If editing geocoding data from a map, the geocoding coordinates appear as a layer within a map. Select Georeference layer from the Edit map options of a selected map.
The georeference options appear.
-
Select the georeference data category.
The following table describes the available georeference data categories.
Georeference Category Description Long/Lat Columns When uploading a dataset, the map automatically renders the marker and polygon values as the latitude and longitude coordinates. To identify a georeference data point, select the specific longitude and latitude column from the drop-down menu
The following image displays the default georeference data options, with Lon/Lat Columns selected.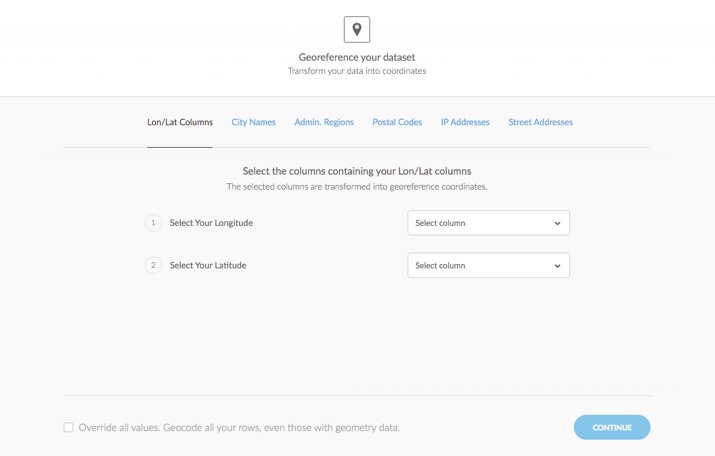
Tip: Click the georeference category name to refresh the view and display the related options.City Name Click City Names to view the georeference city name options, and select the column where your city names are stored in your dataset. To improve the accuracy of the georeference data, you can also indicate the administrative region and country (if known). Admin. Regions Click Admin. Regions to view the georeference administrative region options, and select the column where your region names are stored in your dataset. If the selected region column is not country data, you can also indicate the column where this type of data is stored.
Note: The CARTO database automatically loads polygon region data for states and municipalities.Postal Codes Click Postal Codes to view the georeference postal code options, and select the column where your postal codes are stored in your dataset. To improve the accuracy of the georeference data, you can also indicate the country where the postal codes are located (if known).
Note: For the USA, US Census Zip Code Tabulation Areas (ZCTA) are used to reference geocodes for USPS postal codes service areas. See the FAQs about datasets and data for details.IP Addresses Click IP Addresses to view the georeference IP Address name options, and select the column where your IP Addresses are stored in your dataset. This enables you to convert IP Addresses into geographical locations on your map. Street Addresses Click Street Addresses to view the georeference street address options, and select the column where your street addresses are stored in your dataset. To improve the accuracy of the georeference data, you can also indicate the state/province and country (if known).
Note: Street address data is allocated to your account and based on a permitted amount of credits per month. Any geocode matches to the indicated street address consumes credits from your account. -
Click CONTINUE to save and apply the georeference data coordinates.
Note: CARTO may use a third party to provide geocoding and reverse geocoding services. Geocoding services are subject to the third parties terms and conditions.
cartodb_georef_status Column
As a result of geocoding your data, the cartodb_geof_status column appears in your Data View. It displays the boolean status of your geocoded data for each row. You can override the default status by double-clicking on a value in this column. Tip: You can also run an SQL query for this process.
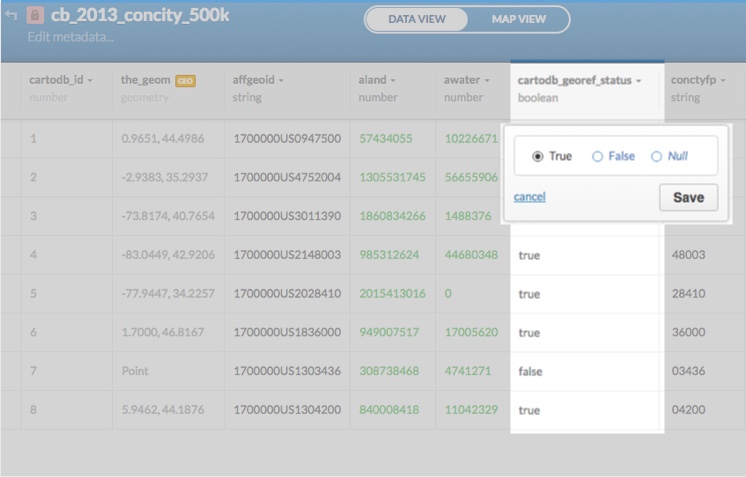
Note: The cartodb_georef_status column does not appear if you geocode your Lon/Lat columns. Longitude and latitude geometries are drawn as points on a map, and not considered geocoded.
The following table describes how geocoded statuses are determined after each geocoding process.
cartodb_georef_status |
Description | Geocoding Process |
|---|---|---|
| True | The row has been geocoded successfully. | The row is NOT geocoded if a new geocoding process is run. |
| False | The row has not been geocoded. | The row is geocoded if a new geocoding process is run. |
| Null | Null indicates that the status is neutral, as if the column does not exist (or if an error occured). | Null values are geocoded by default. For example, if you have a dataset that already contains a geocoding status column, if you add a new row, its value would be null. |
Running SQL Queries
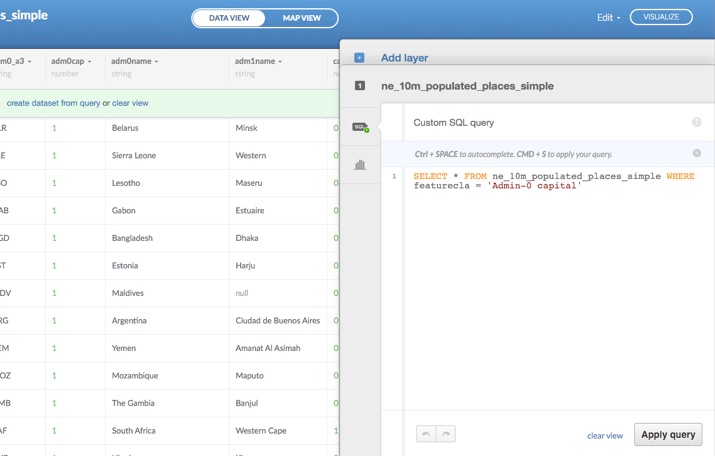
CARTO enables you to query data using the Structured Query Language (SQL). We provide particular support for PostGIS SQL commands, which allows you to filter data spatially. Some common uses of PostGIS SQL queries are to answer questions such as, “How many points from one dataset are located within a polygon from another dataset?” Or commands such as, “Give me all my data within 50 kilometers of a certain latitude longitude coordinate.”
Review the PostgreSQL documentation for how to use PostgreSQL flavored SQL, as well as the PostGIS documentation for tips on writing spatial queries.
To run an SQL query in the CARTO dashboard, open a dataset or map. In the righthand sidebar, click the SQL icon. The sidebar will expand and by default you will see the following query:
SELECT * FROM dataset_nameYou can modify this query and then hit the “Apply query” button or press cmd + s on a Mac OS or ctrl + s on a Windows OS. An example of a modified query might look like the following:
SELECT * FROM ne_10m_populated_places_simple WHERE featurecla = 'Admin-0 capital'This query will select all rows that have a “featurecla” column value of “Admin-0 capital” from the dataset “ne_10m_populated_places_simple.” Only the rows that match this SQL query will appear in the dataset and map view for this dataset. Remember that when applying SQL queries to maps, only the queried data will be shown.
Dataset from Query
It is possible to create a new dataset from an SQL query.
-
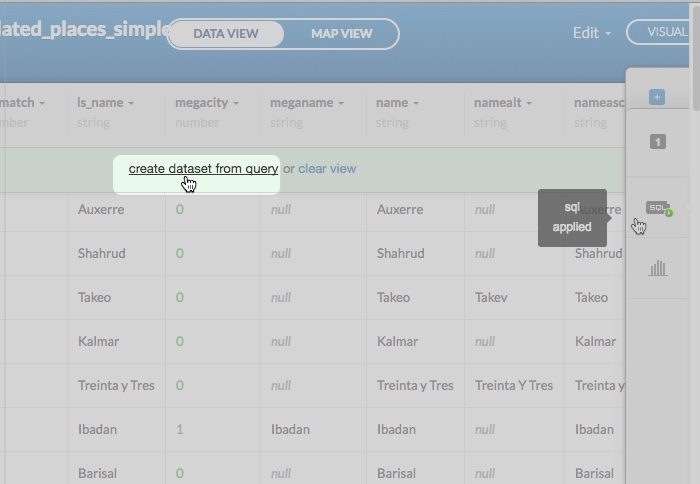
After applying your modified SQL query on a DATA VIEW or MAP VIEW, create dataset from query or clear view appears.
-
Click create dataset from query.
-
CARTO will create the dataset from the query, and load the results.
The name of the new dataset is appended with _copy. For example, after applying a SQL query to “ne_10m_populated_places_simple” dataset, click “create dataset from query”. A copy of the dataset appears as “ne_10m_populated_places_simple_copy”.
Merging Data
Merge your current dataset with another existing dataset by performing a column join (merges two datasets based on a shared value) or a spatial join (merges two datasets based on a number of intersecting records). This is useful if there is a shared value among different datasets, or if you want to merge values from different sources. For example, you can merge data from a public dataset (accessible from our Data Library) to one of your own private datasets that share a unique value, such as country ISO codes or country names.
The Merge with dataset option is available from the Data View or Map View Edit menu, from the Data page.
Tip: You can also apply an SQL query for merging and inserting data.
Merge by Column Join
Column joins are useful if you have two datasets that share a common row value. For example, country level datasets often contain an ISO code for each row. You can join all, or some, of these values into a single dataset with the Column join option.
-
Click your Data page from the dashboard menu.
The page refreshes, displaying a list of your datasets.
-
Select the name of the dataset that you want to merge column values with.
The page refreshes displaying the Data View for the selected dataset.
-
Select Merge with dataset from the Edit drop-down menu.
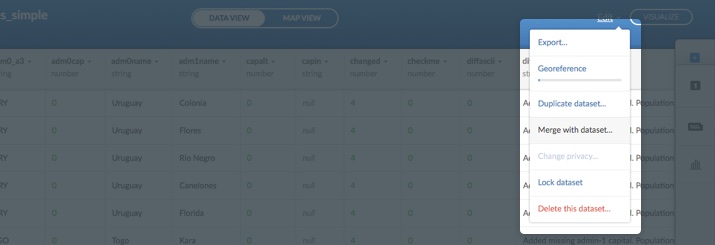
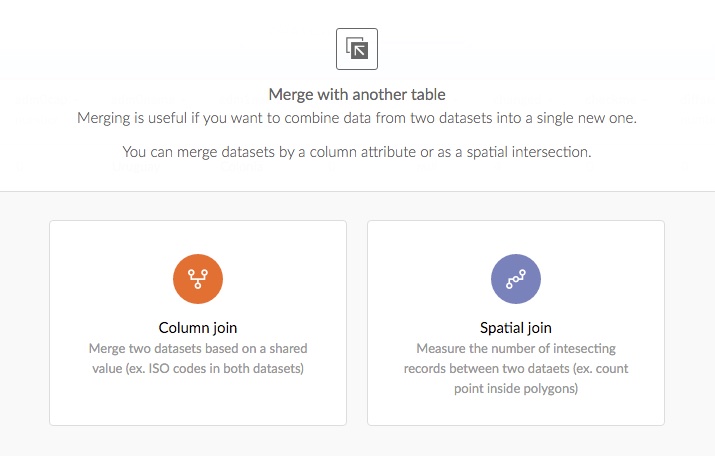
A list of merging data options appear. Selecting an option guides you through the rest of the steps for merging data.
-
Select Column join.
The next step of the column join options appear. Choose the merge columns.
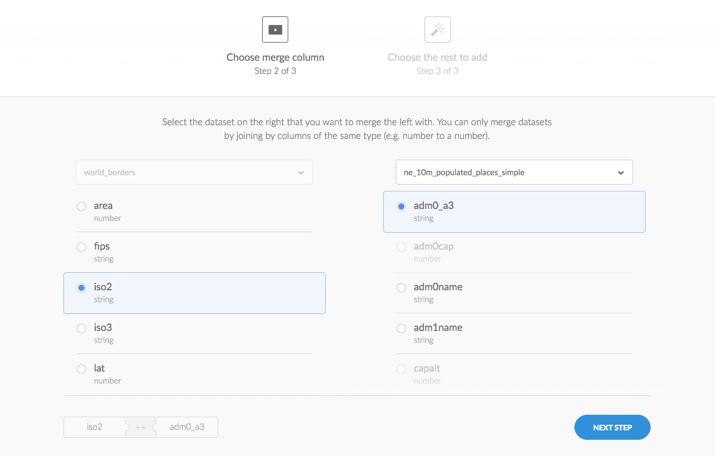
- The columns from the first selected dataset appear on the left. Select a radio button to choose the merge column from the first dataset.
- The right-side displays the second dataset. By default, the CARTO Editor looks for datasets with similar data. You can use the drop-down list to select a different dataset.
- Select columns from the second dataset to merge with the first. You can only merge columns with the same data type values, such as string, number, and so on.
- Click NEXT STEP to move on to the next step in the column join process.
- Alternatively, you can use the arrow button (located on the top left) to go back to the previous step.
-
The final step of the column join process displays the joined columns to be merged.
You can select any other columns to join using the slider button next to each column name, or you can select all columns.
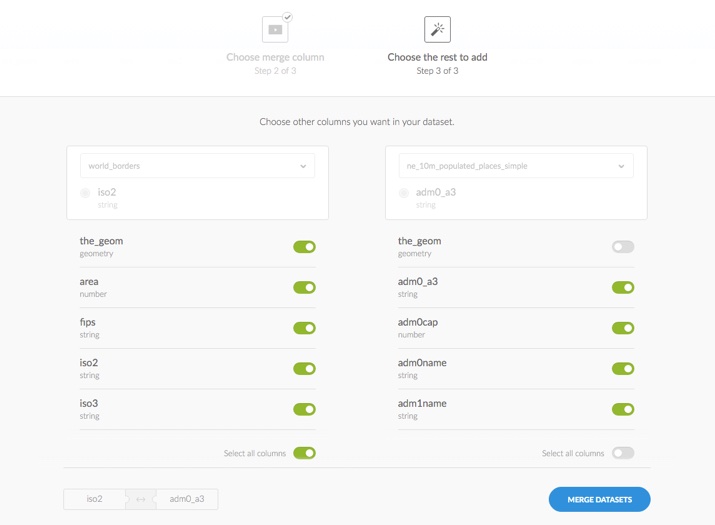
-
Click MERGE DATASETS.
A new dataset is created with the merged data, and displays in the Data View.
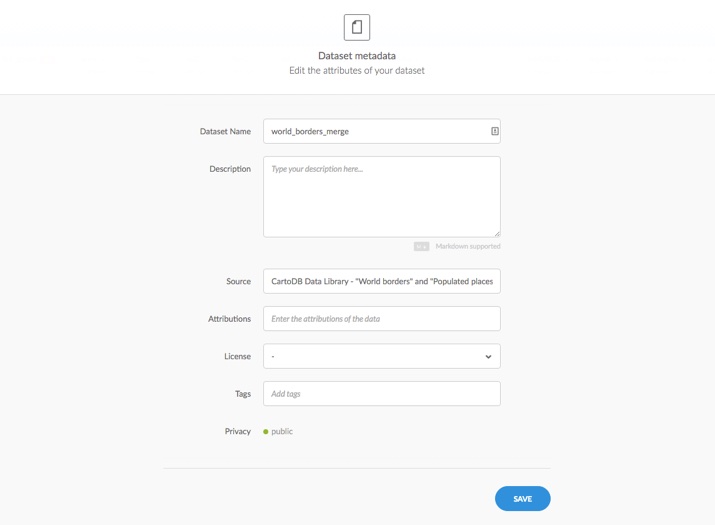
Note: The name of the merged dataset indicates that is was merged by default. Optionally, you can edit the metadata to change the title.
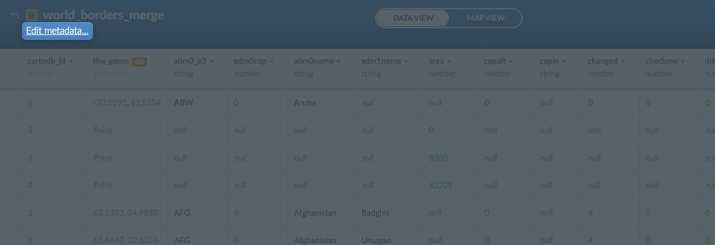
It is also suggested to include the details of the merged data in the Source field of the metadata options. This is especially useful if your datasets are public.
Merge by Spatial Join
Spatial joins merge two datasets based on a number of intersecting geospatial records. For example, the points in a polygon. Spatial joins are performed by applying operators (SUM, COUNT, AVG), similar to Excel, that calculate how the intersecting records are handled.
-
Click your Data page from the dashboard menu.
The page refreshes, displaying a list of your datasets.
-
Select the name of the dataset that you want to merge intersecting records with.
The page refreshes displaying the Data View for the selected dataset.
-
Select Merge with dataset from the Edit drop-down menu.

A list of merging data options appear. Selecting an option guides you through the rest of the steps for merging data.

-
Select Spatial join.
The next step of the spatial join options appear. Select a dataset from the drop-down list.
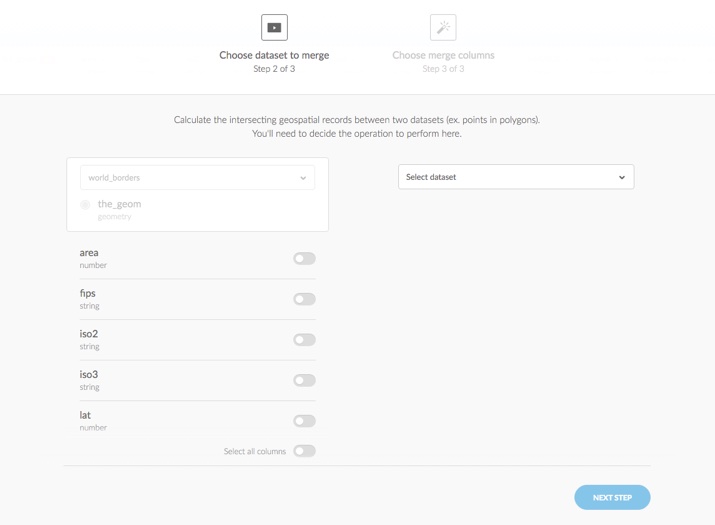
-
Choose the merge columns.
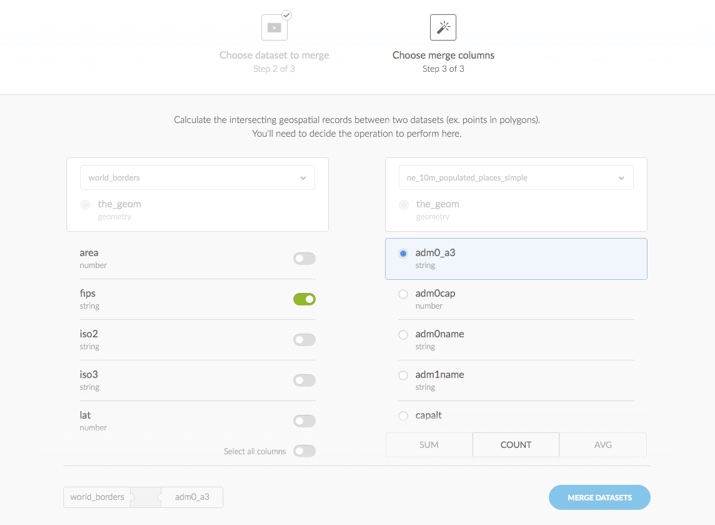
- The columns from the first selected dataset appear on the left. Use the slider button to select a single column, multiple columns, or select all columns.
- The right-side displays the second dataset columns. Select a radio button to choose the merge column.
-
Select the calculation operator for the intersecting records.
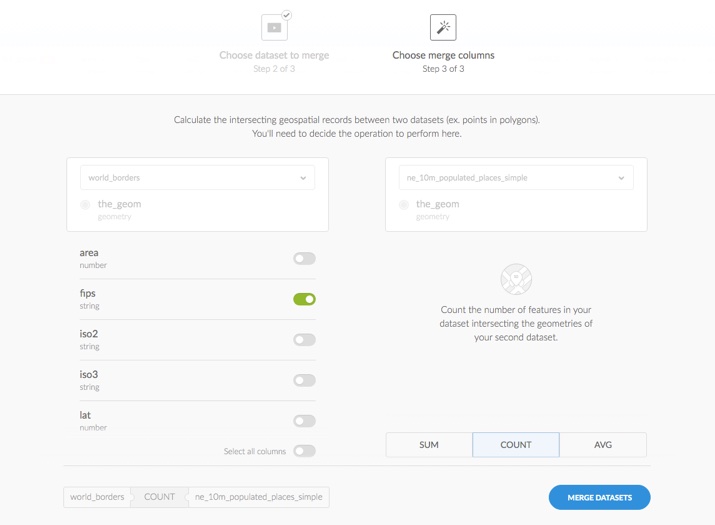
The following table describes the available calculation operators.
Operator Description SUM Adds together values, in a numeric column, for all intersecting records.
For example, if one dataset contains the numeric columnpop_maxand inclues the valueSpain, the pop_max column adds up all intersecting values that contain Spain from the second dataset.
Tip: When you select SUM as the operator, the spatial join options only display numerical columns from the datasets.COUNT Calculates the number of intersecting records.
For example, if two datasets contain the valueSpain, all of the Spanish populated places are counted and displayed in an intersected row.AVG Provides the average value of a column for all intersecting records, from the second dataset. Tip: You can use the arrow button (located on the top left) to go back to any of the previous steps.
-
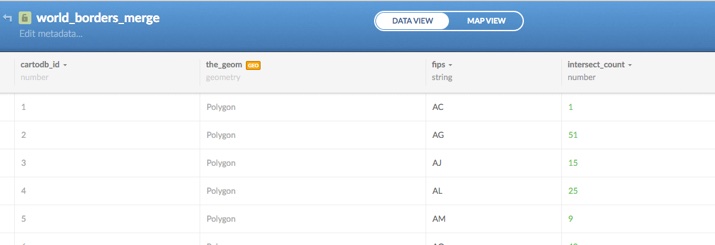
Click MERGE DATASETS.
A new dataset is created with the merged data, and displays in the Data View.
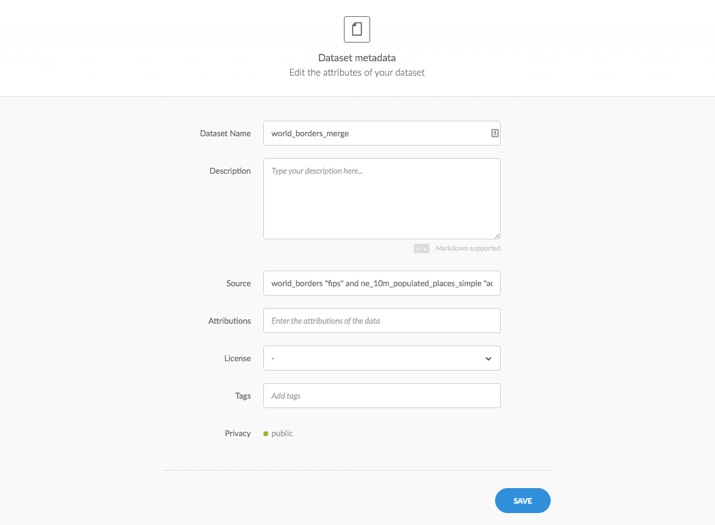
Note: The name of the merged dataset indicates that is was merged by default. Optionally, you can edit the metadata to change the title.
It is also suggested to include the details of the merged data in the Source field of the metadata options. This is especially useful if your datasets are public.
Export data
You can export any of your datasets for use offline. The Export option is available from the Edit menu when a dataset is selected. Additionally, you can also export a dataset layer directly from a selected map with the Export layer menu option.
-
Visit the Data page.
-
Click on the name of a dataset.
-
The selected dataset opens in the Data View.
-
Select Export from the Edit drop-down menu.
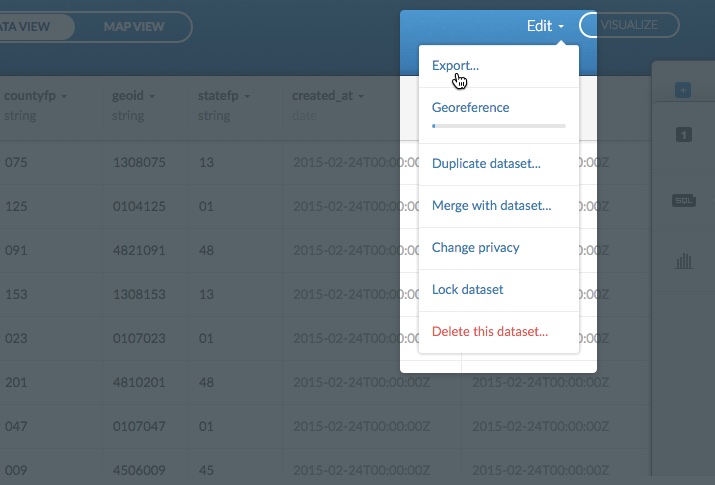
Tip: You can also export a dataset layer directly from a selected map. From your maps dashboard, select Edit layer from the Edit map options of a selected map.
The export dataset options appear. Options may vary, depending on your data.
-
Select the preferred file format.
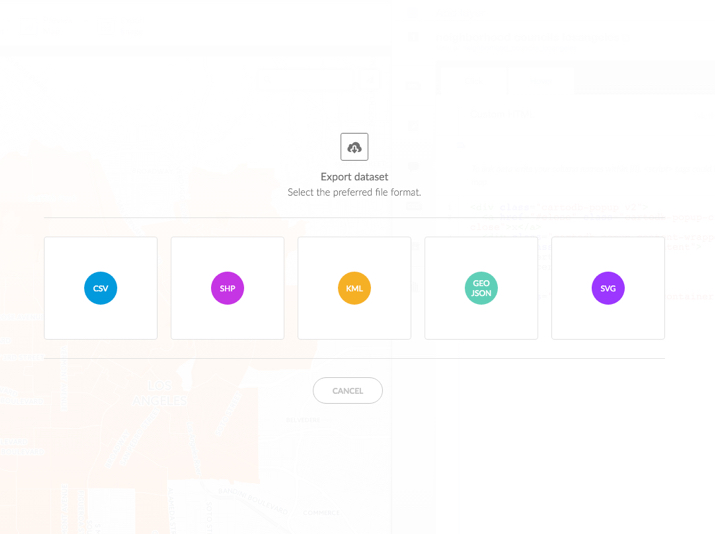
Note: CARTO supports the following file formats for exporting geospatial data: CSV, Shapefile, KML, GeoJSON, and SVG formats.
The dataset is downloaded based on your web browser process.
Tip: If you are using the SQL API, you can use your table URL to run a response query and export downloads in different formats. For example, the following sample code shows the CSV export format for an SQL API request.
http://{USERNAME}.cartodb.com/api/v2/sql?format=csv&q=SELECT+*+FROM+tm_world_borders_simFor more information about using the SQL API, see this section of the CARTO Developer Center.
Download by URL
There is a pro-tip for accessing downloads by using your direct dataset URL. You can make use of the SQL API to run any query and ask for the results to be retrieved in different formats. For example: DOWNLOAD BY URL.
https://{username}.carto.com/api/v2/sql?format=csv&q=SELECT+*+FROM+tm_world_borders_sim