How to customize the Map Viewer style
Learn how to customize the layer visualization in CARTO Map Viewer.
Customizing your map style using deck.gl declarative language
deck.gl supports a declarative system for describing layers and their props. This feature can be used to generate powerful visualizations directly from a JSON document. You can describe a visualization in abstract terms and you can view the results without needing to write JavaScript code.
This declarative system is used in deck.gl Playground and supports the layers from CARTO’s module. It is also the system used in CARTO Viewer to create and share tilesets visualizations.
The declarative language allows you to define the style and cartography of your visualization and set other general map options. Technically this language is based on JSON that gets transformed into Javascript objects and functions. Check out the official documentation on the JSON format for further technical details.
In this guide we are going to focus more on providing an overview of different options the language provides. We will also document the most common visualizations.
API reference
The declarative system creates deck.gl objects from a JSON representation. For instance, the initialViewState element in the JSON representation (declarative way) corresponds to a view state object when you are working with deck.gl in a programmatic way.
Usually the name-value pairs in the JSON representation correspond to object properties in deck.gl objects and the arrays correspond to JavaScript arrays. There are a couple of specific name-value pairs that are very useful:
-
@@type. It is used to indicate the class of the object we want to create; for instance, for specifying the type of layer we want to use. -
@@function. It is used to specify a function to be executed to evaluate a data accessor; for instance, for using helpers to specify the color that we want to assign to features.
In the sections below we have included links to the deck.gl documentation.
General parameters
initialViewState
Type: object
Description: Defines the initial view state for the visualization.
| Property Name | Type | Description |
|---|---|---|
| latitude | number | Latitude at the map center. |
| longitude | number | Longitude at the map center. |
| zoom | number | Initial zoom level. |
| pitch | number | Default: 0. Pitch angle (in degrees). |
| bearing | number | Default: 0. Bearing angle (in degrees). |
| minZoom | number | Default: 0. Min zoom level. |
| maxZoom | number | Default: 20. Max zoom level. |
| minPitch | number | Default: 0. Min pitch angle. |
| maxPitch | number | Default: 60. Max pitch angle. |
Example: Visualization centered at (0, 0) coordinates, zoom level 2.
{
  ...
  "initialViewState": {
    "latitude": 0,
    "longitude": 0,
    "zoom": 2,
  },
  ...
}
views
Type: array
Description: Defines the views
Each view object has the following properties:
| Property Name | Type | Description |
|---|---|---|
| @@type | string | Use MapView in the CARTO viewer for a Web Mercator Projection. Other types of views are also supported by the declarative syntax (but not in CARTO viewer) like FirstPersonView, Globeview, OrtographicView or OrbitView. |
| controller | boolean | Indicates if the map is interactive (supports pan, zoom…) or not. |
| mapStyle | number | Basemap to use in the map. It can be a full URL to a vector style like this one, or it can be a string from this dictionary |
Example: Configuring an interactive MapView with the CARTO Positron basemap.
{
  ...
  "views": [
    {
      "@@type": "MapView",
      "controller": true,
      "mapStyle": "@@#CARTO_BASEMAP.POSITRON"
    }
  ],
  ...
}
Layers (Basic Properties)
Type: array
Description: Layers to overlay on the map. It is an array so you can compose multiple layers and define their blending functions.
| Property Name | Type | Description |
|---|---|---|
| @@type | string | “CartoBQTilerLayer” or “CartoSQLLayer” |
| data | string | In the case of a BigQuery TileSet you indicate the project.dataset.table_name. In the case of CartoSQLLayer you indicate the SQL used to retrieve data from your CARTO account. |
| credentials | object | CARTO authentication credentials |
| credentials.username | object | CARTO username |
| credentials.apiKey | object | CARTO API Key. For private maps you add the api key here, for a public map you can use default_public. |
| credentials.region | object | Default: us. Region where the user’s database is located; possible values are us or eu. Only needs to be specified if you’ve specifically requested an account in the eu region. |
| credentials.mapsUrl | object | Default: https://{user}.carto.com/api/v1/map. If you’re an on-premise user or you’re running CARTO from Google’s marketplace, you need to set the URL to point to your instance. |
| credentials.sqlUrl | object | Default: https://{user}.carto.com/api/v2/sql. If you’re an on-premise user or you’re running CARTO from Google’s marketplace, you need to set the URL to point to your instance. |
| pickable | boolean | Default: false. Indicates whether the layer responds to mouse pointer picking events. |
| uniqueIdProperty | string | Default: cartodb_id. Needed for highlighting a feature split across two or more tiles if no feature id is provided. An string pointing to a tile attribute containing a unique identifier for features across tiles. |
| visible | boolean | Default: true. Indicates whether the layer is visible or not. Under most circumstances, using the visible prop to control layer visibility is recommended instead of using conditional rendering. |
Example: Visualizing a BigQuery Tileset Layer from a public tileset (using public credentials) named cartobq.maps.osm_buildings that responds to mouse pointer picking events.
{
  ...
  "layers": [
    {
      "@@type": "CartoBQTilerLayer",
      "data": "cartobq.maps.osm_buildings",
      "credentials": {
        "username": "public",
        "apiKey": "default_public"
      },
      "pickable": true,
      ...
    },
    ...
  ]
  ...
}
Layers (Styling Properties)
In this section we describe the styling properties for layers that can be used when working with @deck.gl/carto layers, based on the GeoJsonLayer.
| Property Name | Type | Description |
|---|---|---|
| autoHighlight | boolean | Default: false. When true, current object pointed to by mouse (when hovered over) is highlighted with highlightColor. Requires pickable to be true. |
| elevationScale | number | Default: 1. Elevation multiplier. The final elevation is calculated by elevationScale * getElevation(d). elevationScale is a handy property to scale all polygon elevations without updating the data. |
| extruded | boolean | Default: false. Whether to extrude the polygons (based on the elevations provided by the getElevation accessor). If set to false, all polygons will be flat. This generates less geometry and is faster than simply returning 0 from getElevation. |
| filled | boolean | Default: true. Whether to draw filled polygons (solid fill). Note that for each polygon, only the area between the outer polygon and any holes will be filled. This prop is effective only when the polygon is NOT extruded. |
| getElevation | number or @@function | The elevation used to extrude each polygon. If a cartographic projection mode is used, the height will be interpreted as meters, otherwise it will be in unit coordinates. Only applies if extruded: true. If a number is provided, it is used as the elevation for all polygons. If a function is provided it is called on each polygon, in order to retrieve the polygon’s elevation. Note: If 3D positions are returned by getPolygon, the extrusion returned by getElevation is added to the base altitude of each vertex. |
| getFillColor | array or @@function | The color, in RGBA array format, to use as the fill color. If a function is provided, it is called on each object to retrieve its color. Check the color ramps section for examples. |
| getLineColor | array or @@function | The color to use as a feature’s outline color, in RGBA array format. If a function is provided, it is called on each object (feature) to retrieve its color. Check the color ramps section for examples. |
| getRadius | number or @@function | The radius of each object, in units specified by radiusUnits (default meters). If a function is provided, it is called on each object to retrieve its radius. |
| getLineWidth | number or @@function | The width of the outline of each object, in units specified by lineWidthUnits (default meters). If a function is provided, it is called on each object to retrieve its outline width. |
| highlightColor | array or @@function | Default: [0, 0, 128, 128]. RGBA color to blend with the highlighted object (either the hovered over object if autoHighlight: true, or the object at the index specified by highlightedObjectIndex). When the value is a 3 component (RGB) array, a default alpha of 255 is applied. If an array is supplied, it is used for the object that is currently highlighted. If a function is supplied, it is called with a pickingInfo object when the hovered object changes. The return value is used as the highlight color for the picked object. Only works with autoHighlight: true. |
| lineJointRounded | boolean | Default: false. Type of joint. If true, draw round joints. Otherwise draw miter joints. |
| lineWidthMinPixels | number | Default: 0. The minimum line width in pixels. |
| lineWidthScale | number | Default: 1. The line width multiplier applied to all outlines of Polygon and MultiPolygon features if the stroked attribute is true. |
| opacity | number | Default: 1. The opacity of the layer. |
| pointRadiusMinPixels | number | The minimum radius for point features in pixels. |
| stroked | boolean | Default: true. Indicates whether to draw an outline around the polygon (solid fill). Note that both the outer polygon as well the outlines of any holes will be drawn. |
Creating visualizations
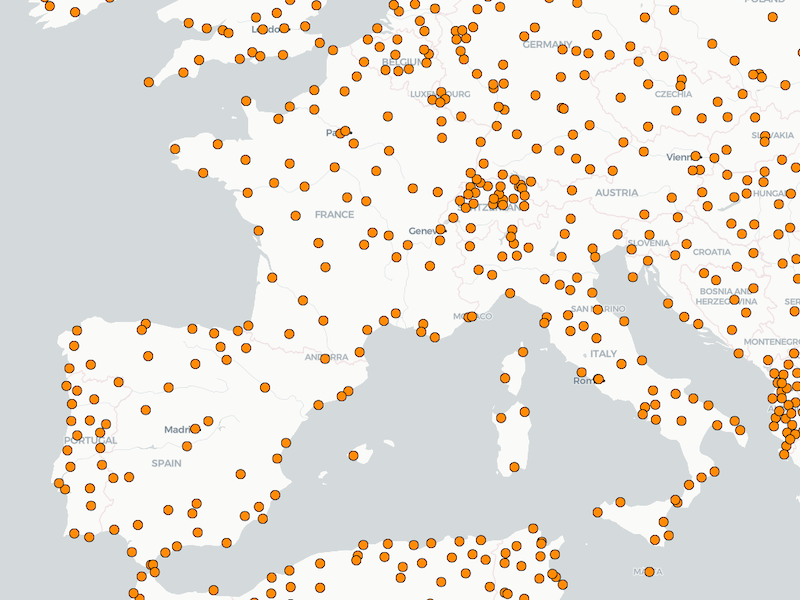
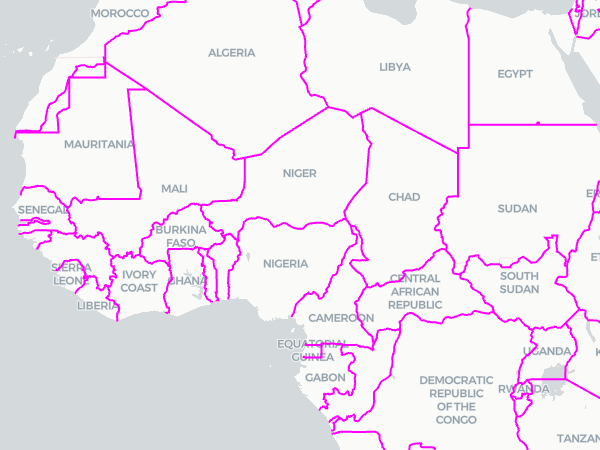
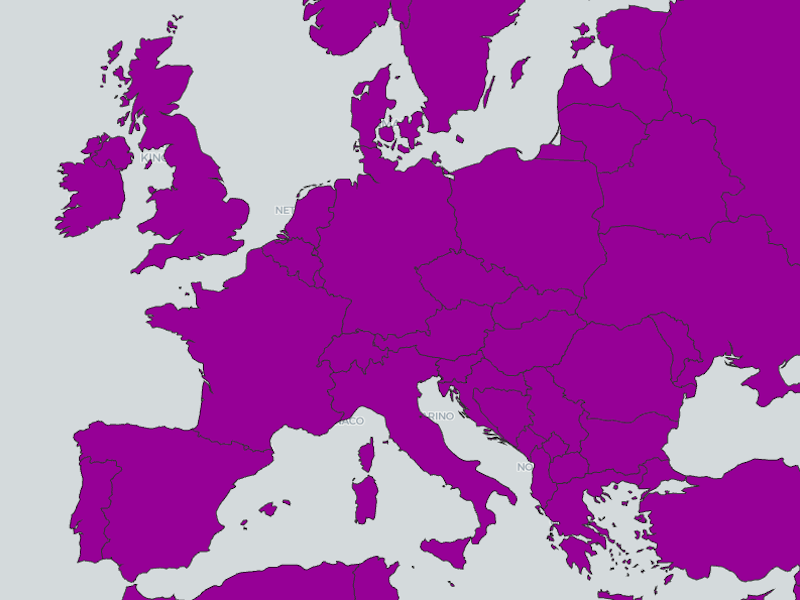
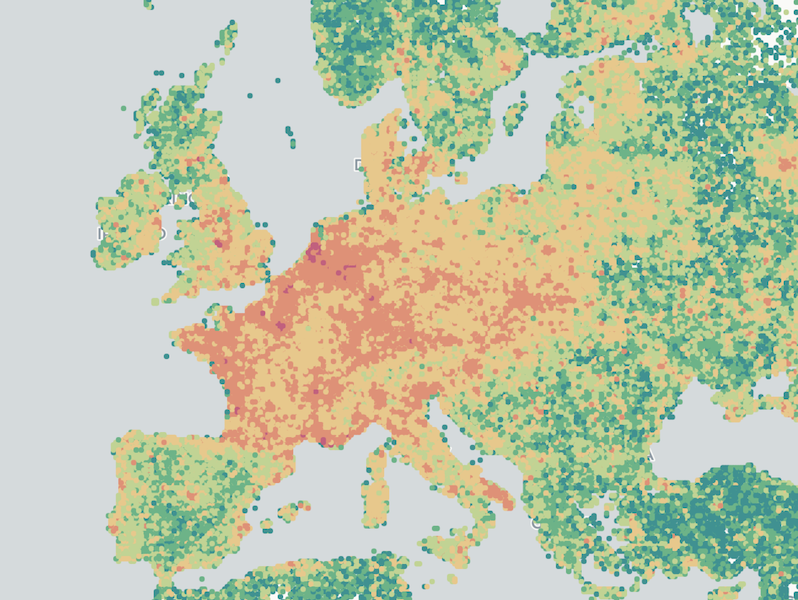
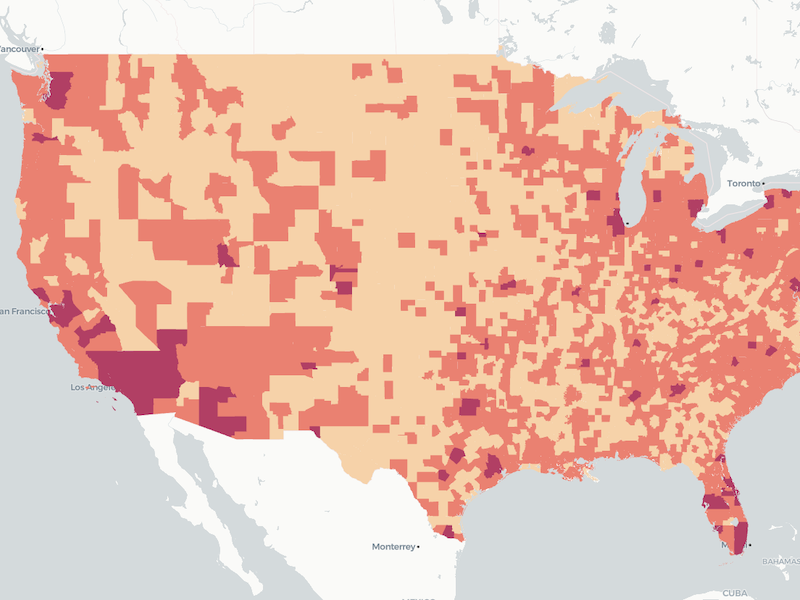
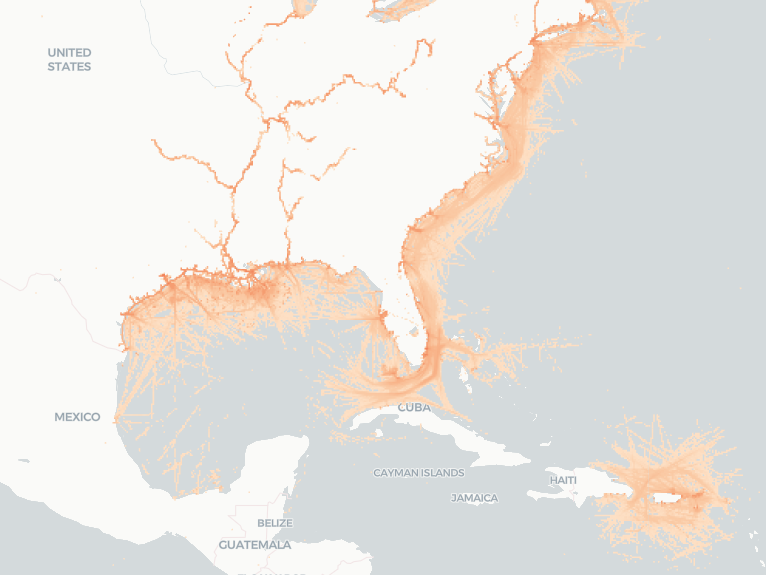
If you click in any of the following examples you will be redirected to CARTO Viewer, where you can inspect what JSON is needed for configuring each visualization. In the examples below you will find additional information regarding how you can use style helper functions to create advanced visualizations.
|
|
|
| Simple example with a point layer. | Simple example with a line layer. | Simple example with a polygon layer. |
|
|
|
| Assigning colors to bins. | Assigning colors to categories. | Assigning a continuous color ramp. |
Style helpers
In common types of thematic map visualizations, a color is assigned to each feature based on a property. When working with the CARTO viewer to visualize a BQTilerLayer or a CartoSQLLayer, you can use the available helper layers:
-
colorBins. Data values of each attribute are rounded down to the nearest value in the domain and are then styled with the corresponding color. -
colorCategories. Data values of each attribute listed in the domain are mapped one to one with corresponding colors in the range. -
colorContinuous. Data values of each field are interpolated linearly across values in the domain and are then styled with a blend of the corresponding color in the range.
These helper functions support the following properties:
| Property Name | Type | Description |
|---|---|---|
| attr | string | Attribute or column to symbolize by. |
| domain | array | For colorBins used to define class break values manually. For colorCategories defines the category list (must be valid). For colorContinuous defines the attribute domain used to specify the data range. |
| colors | string or array | Default: PurpOr. Color assigned to each domain value. If a string is provided, it must be a valid named CARTOColors palette. If an array is provided, it must be an array of colors in RGBA [ [r, g, b, [a]] ]. |
| nullColor | array | Default: [204, 204, 204]. Color for null values. |
| othersColor | array | Default: [119, 119, 119]. Only available for the ColorCategories helper. Fallback color for a category not assigned. |
ColorBins example
This example shows how you can create bins on a numeric feature property and assign a different color to each bin. We need to use the getFillColor data accessor and assign the following properties:
@@function:colorBins.@@attr: The feature property name with numeric data type.@@domain: An array with the manual breaks/bins.colors: The CARTOColors palette to use.
{
  ...
  "layers": [
    {
      ...
      "getFillColor": {
        "@@function": "colorBins",
        "attr": "aggregated_total",
        "domain": [
          10,
          100,
          1000,
          10000,
          100000,
          1000000
        ],
        "colors": "Temps"
      },
      ...
    }
  ]
}
View this example with a tileset in the CARTO viewer here
ColorCategories example
This example shows how you can assign a different color to each feature depending on a string property value for that feature. We need to use the getFillColor data accessor and assign the following properties:
@@function:colorCategories.@@attr: The feature property name with string data type.@@domain: The different values of the string property.colors: The CARTOColors palette to use.
{
  ...
  "layers": [
    {
      ...
      "getFillColor": {
        "@@function": "colorCategories",
        "attr": "pop_cat",
        "domain": [
          "low",
          "medium",
          "high"
        ],
        "colors": "RedOr"
      },
      ...
    }
  ]
}
View this example in the CARTO viewer here
ColorContinuous example
This example shows how you can assign a different color to each feature by interpolating between feature numeric property values. We need to use the getFillColor data accessor and assign the following properties:
@@function:colorContinuous.@@attr: The feature property name with numeric data type.@@domain: The values we want to use for interpolation. The first color in the palette is assigned to the first domain value, the second color in the palette is assigned to the second domain value, and so on…colors: The CARTOColors palette to use.
{
  ...
  "layers": [
    {
      ...
      "getFillColor": {
        "@@function": "colorContinuous",
        "attr": "aggregated_total",
        "domain": [
          1,
          100,
          1000,
          10000,
          500000
        ],
        "colors": "Peach"
      },
      ...
    }
  ]
}
View this example in the CARTO viewer here
Highlighting features
It is possible to highlight features on hover using the following attributes in the layer object:
"autoHighlight": true
"pickable": true,
"highlightColor": [232,133, 113],
"uniqueIdProperty": "id",
The uniqueIdProperty is needed to specify the attribute that identifies the feature uniquely across the dataset. It is case sensitive.