

This content applies to a previous version of CARTO
In October 2021 we released a new version of our platform. You can find the latest documentation at docs.carto.com
How (not) to lie with CARTO
Projections
- Free your maps from web mercator!
- CARTO map projections: application & block
- Other useful resources: Compare Map Projections & MAPfrappe
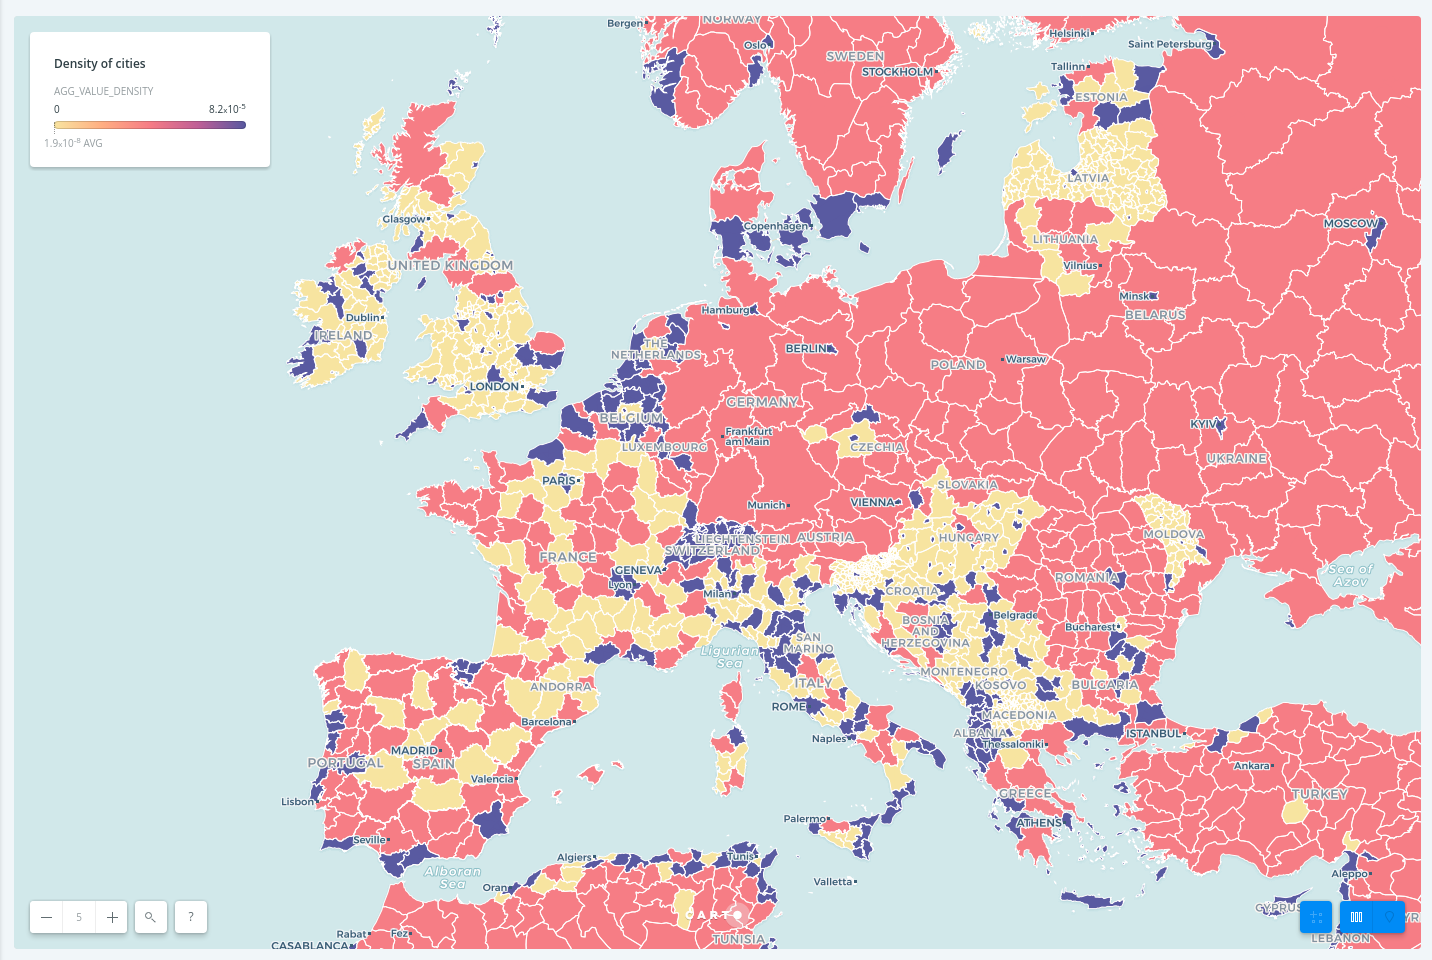
Be careful when making world maps!
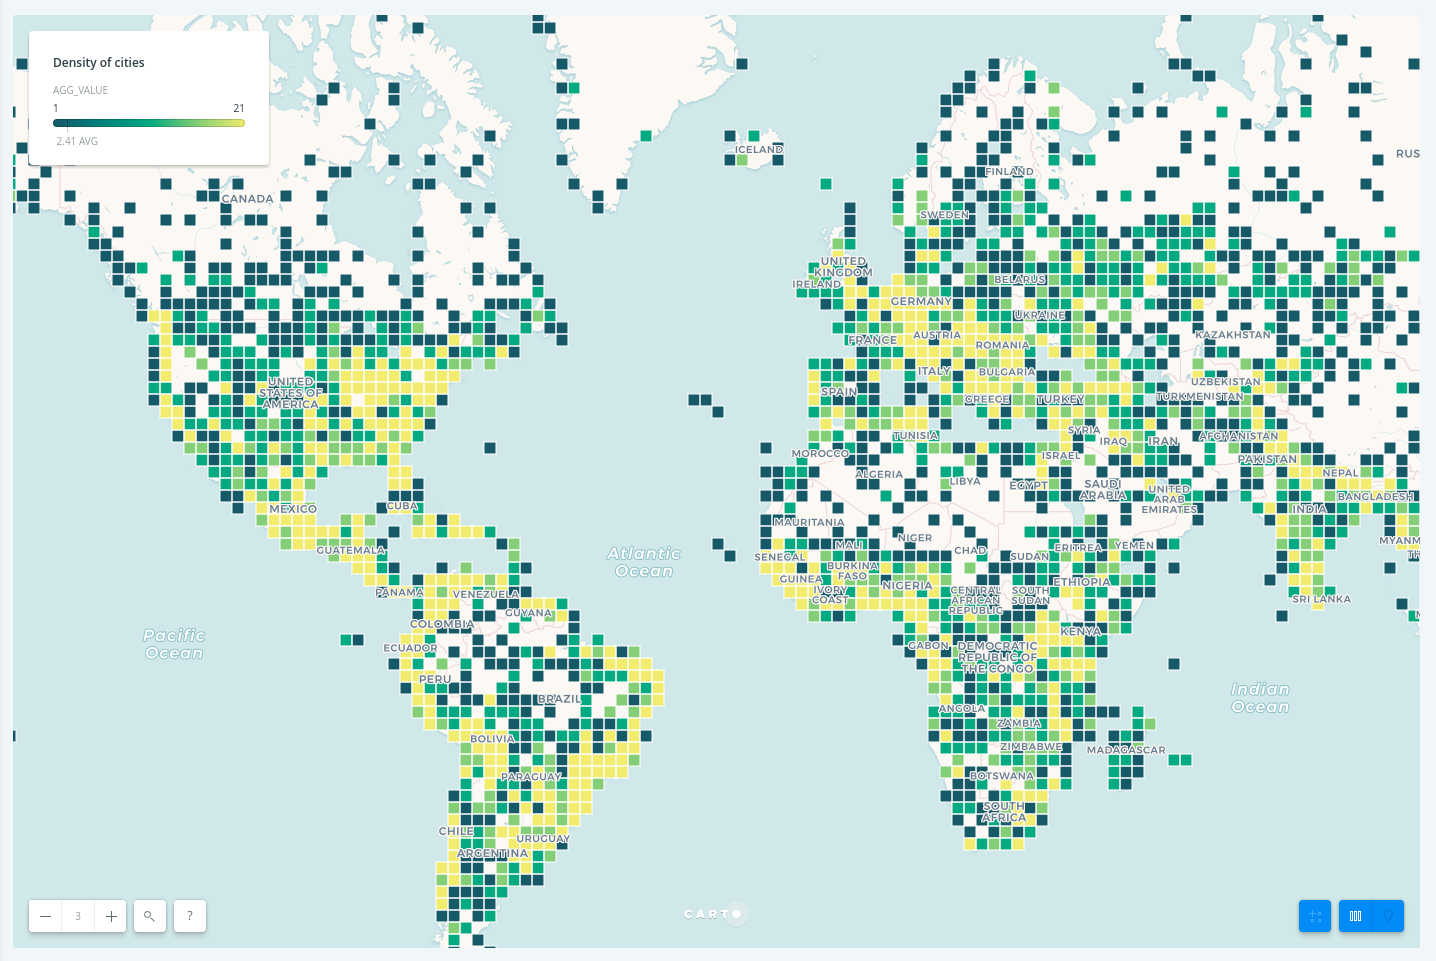
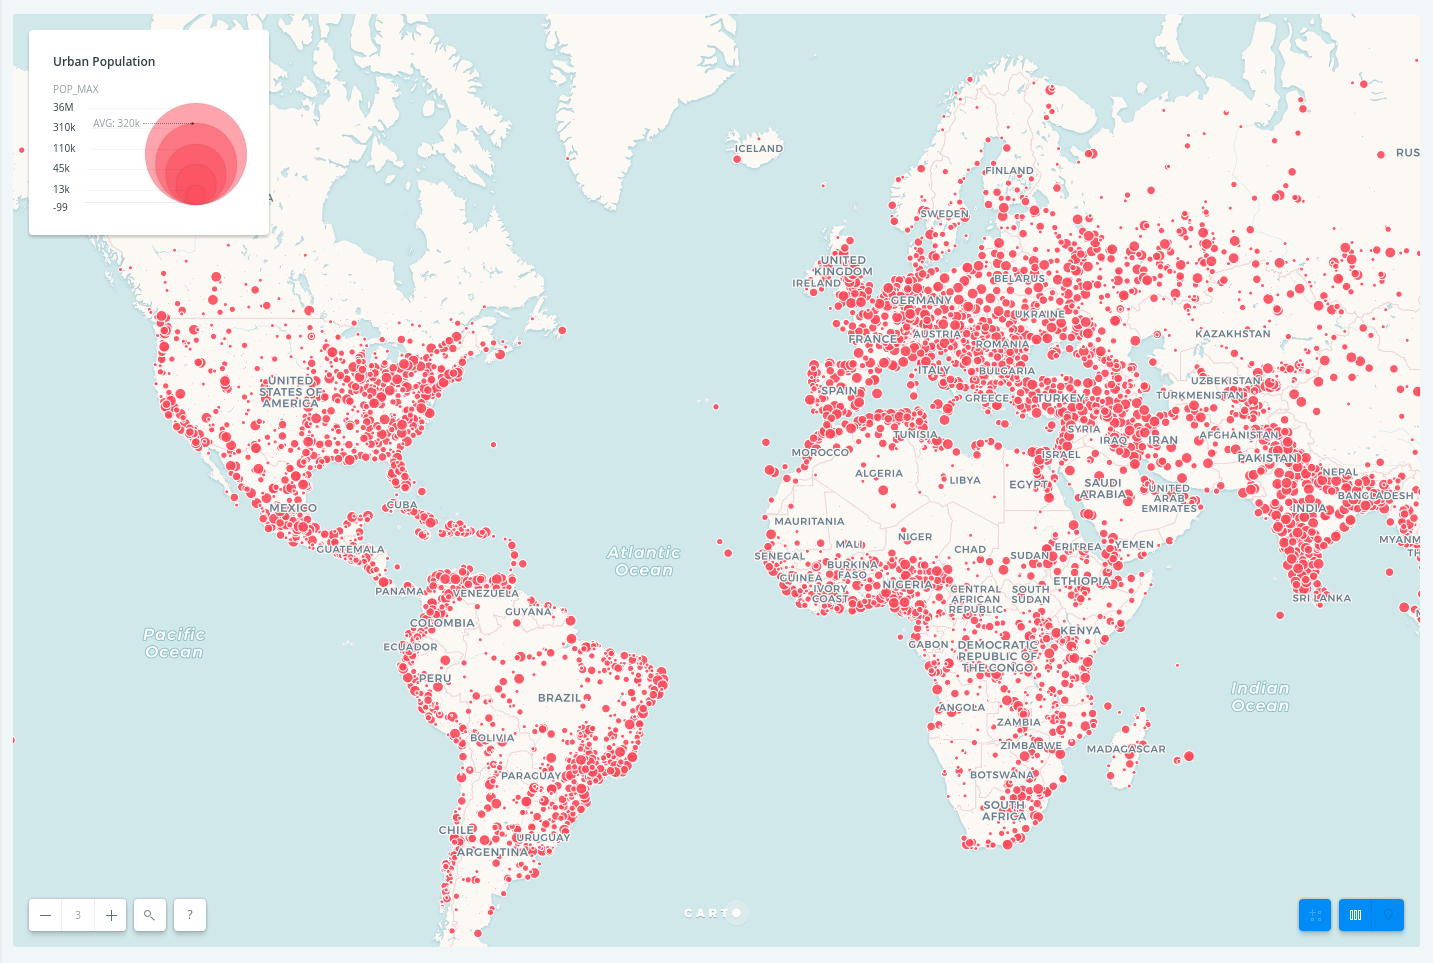
Tip: Try to avoid bubble maps or square/hexbin visualizations with world maps; use them for areas sharing comparable latitudes instead.
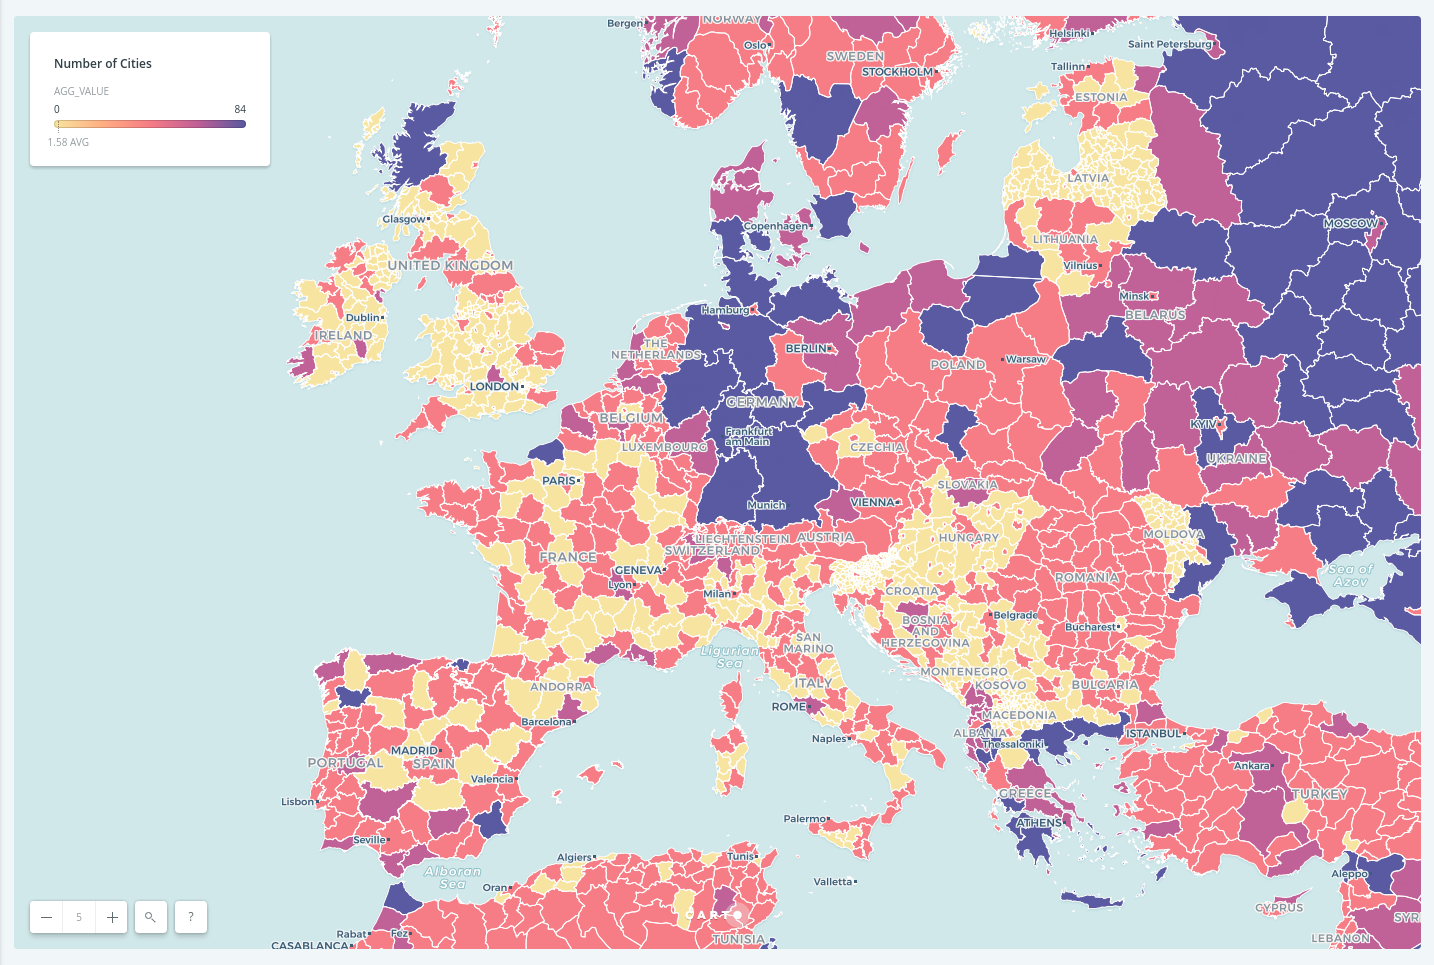
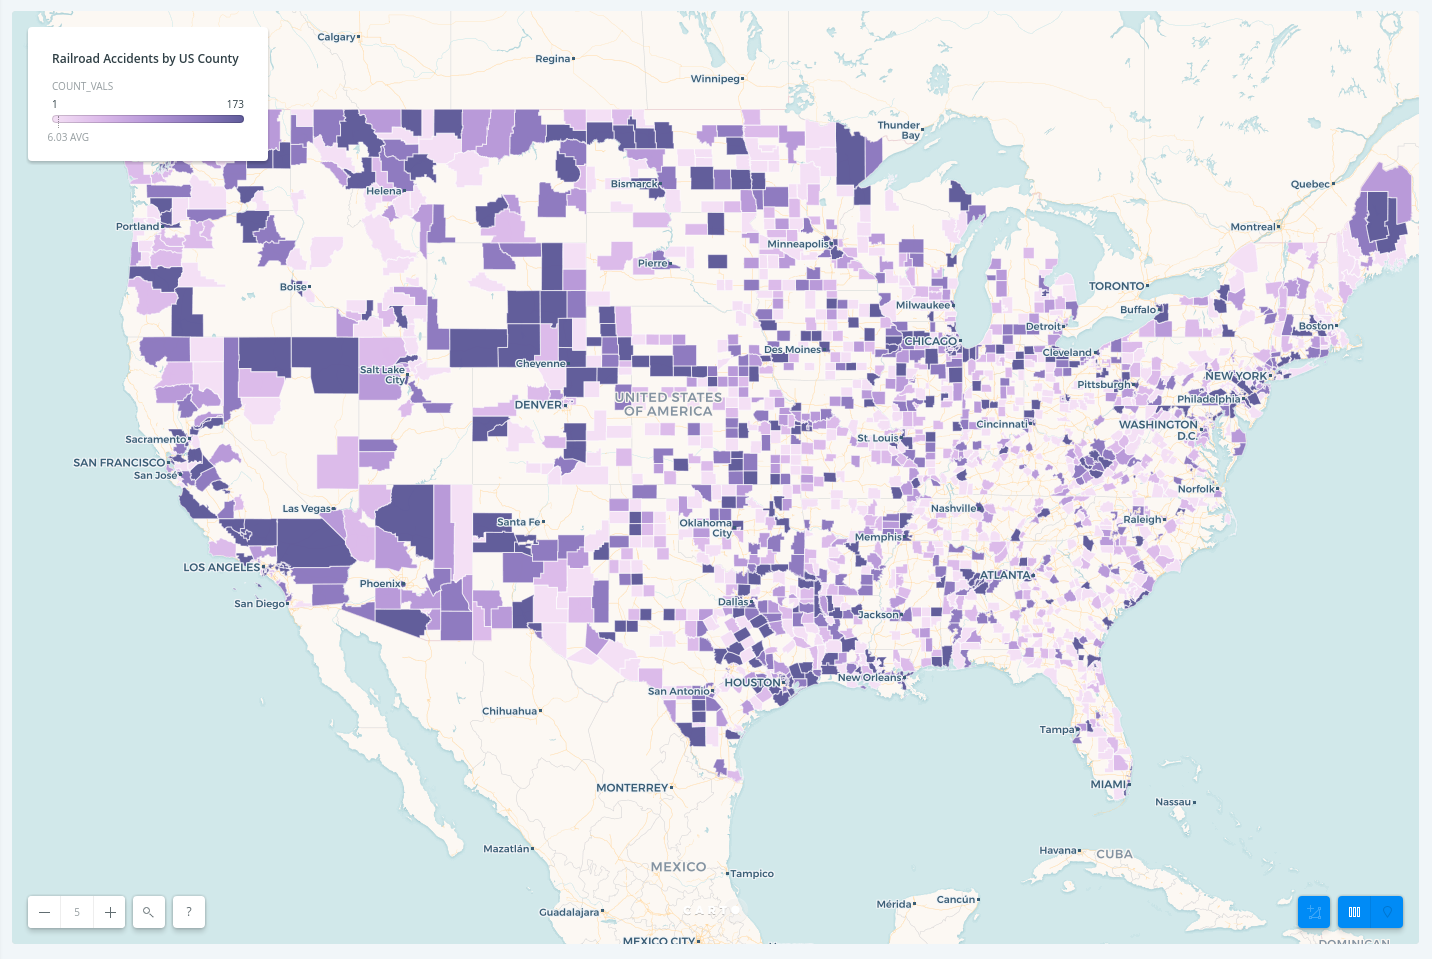
Choropleth maps
- Useful resources: style by value guide
a. Making maps counting points within polygons
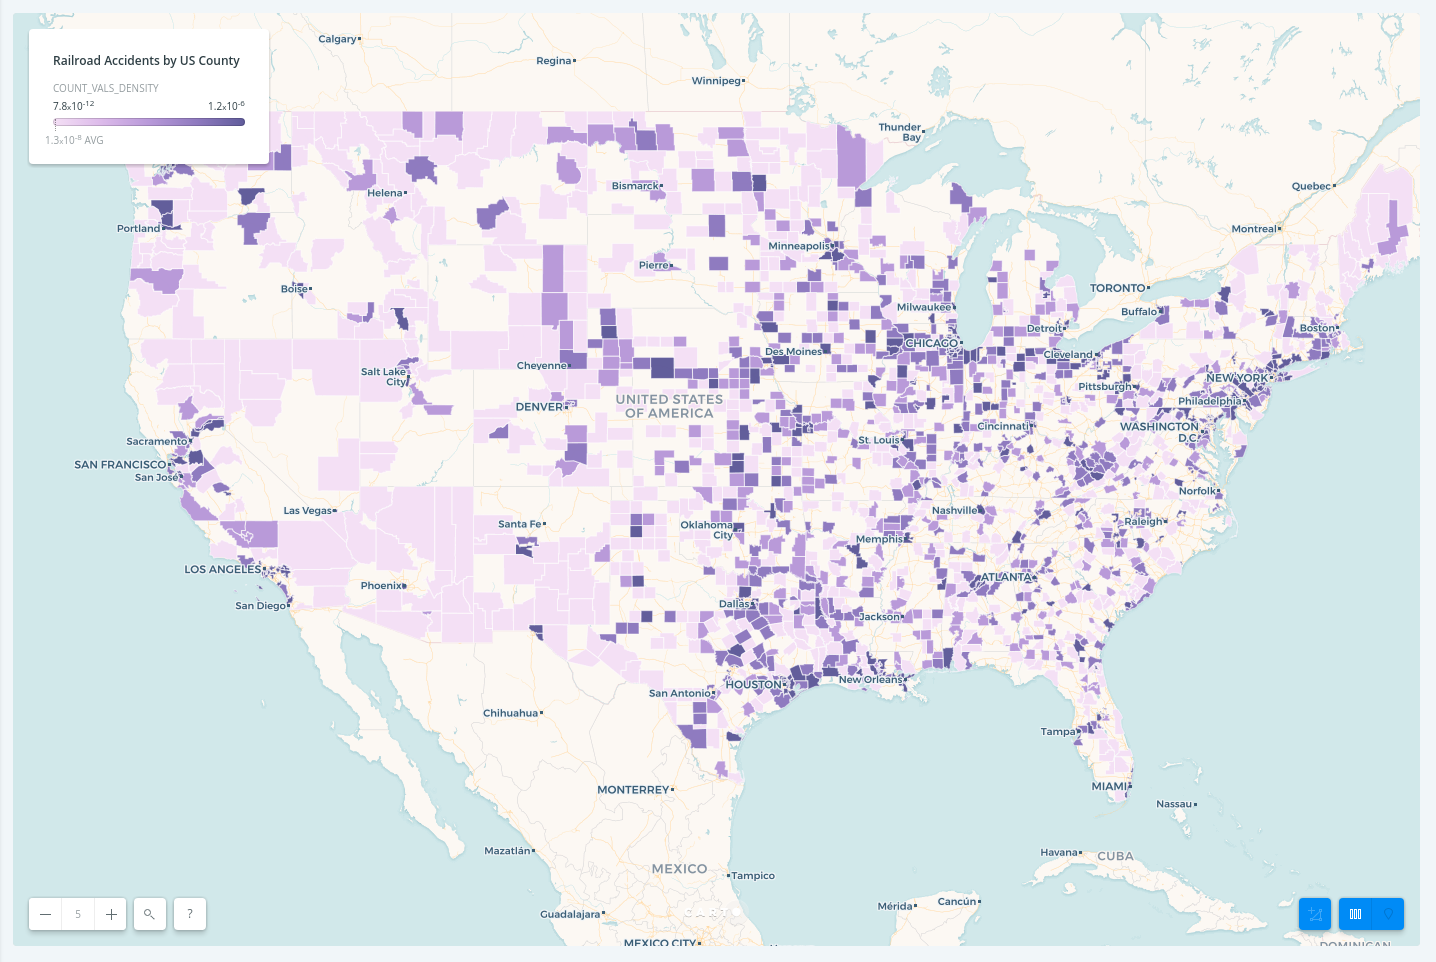
Choropleths should always be normalized!
Non normalized maps
Tip: When intersecting with a secondary layer, the Style by Adm. Region Agg. method provides both count and density values – always select density.
Normalized maps
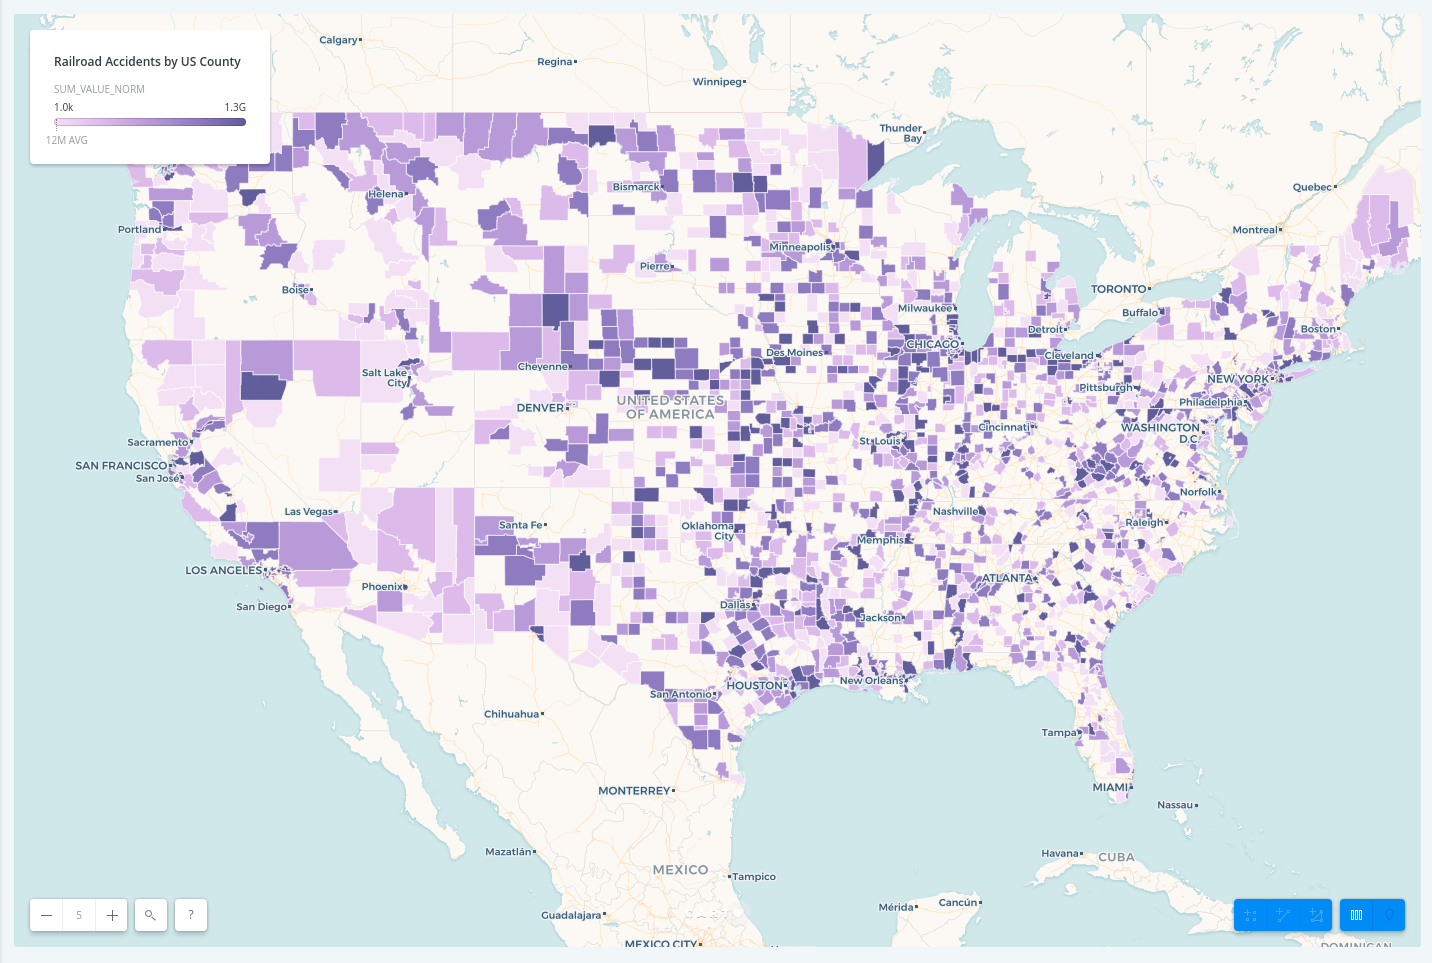
b. Making maps aggregating custom fields within polygons
Again, choropleths should always be normalized!
Non normalized maps:
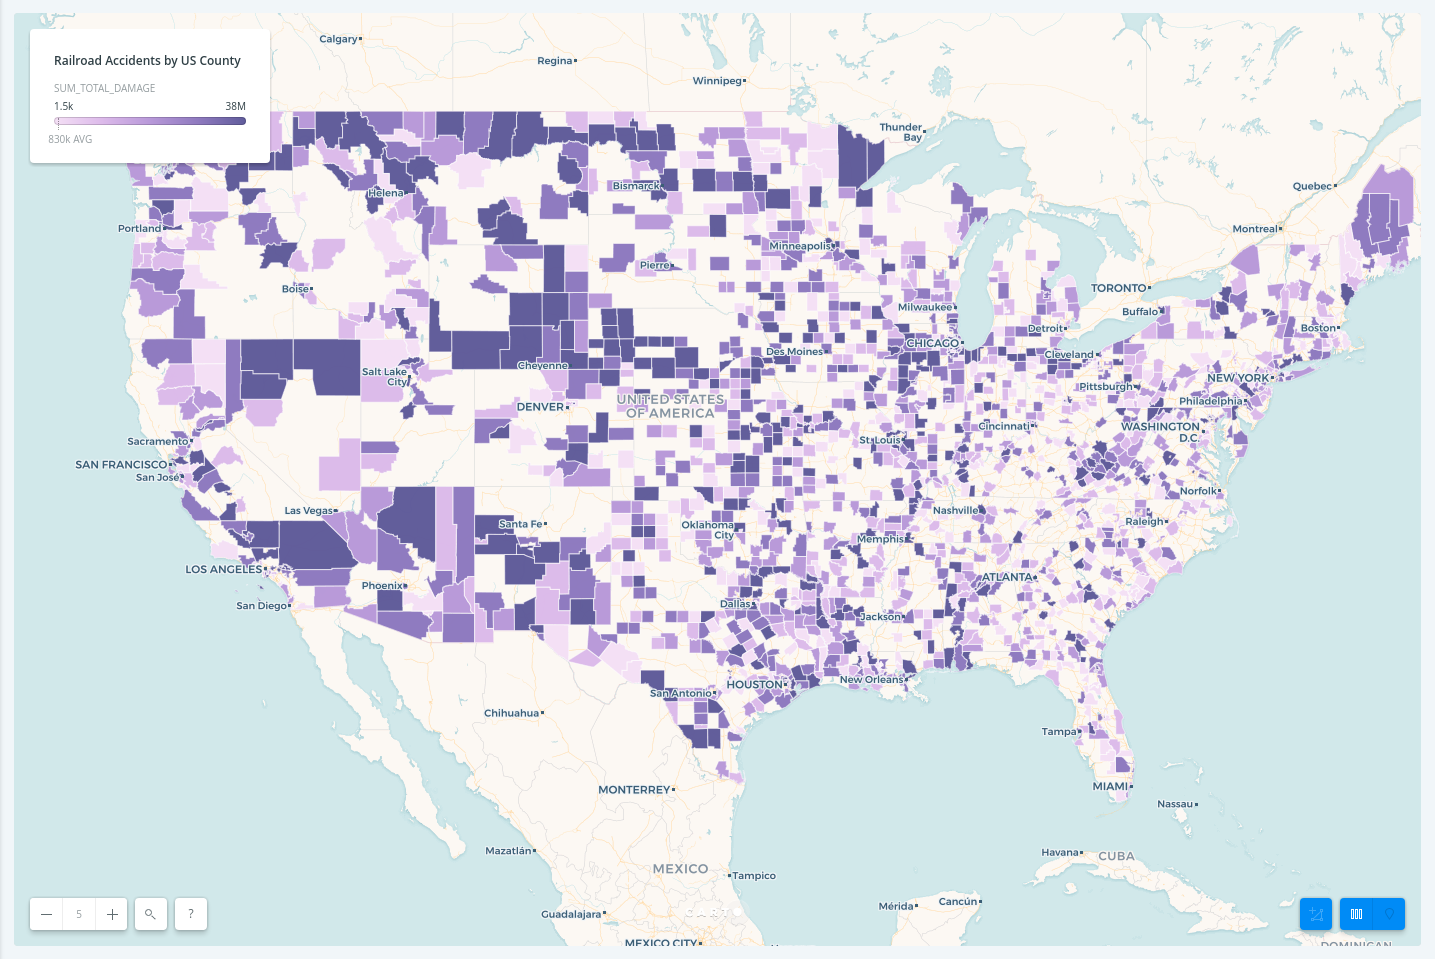
Tip: Normalize fields using ST_Area(the_geom), ST_Length(the_geom), population, or similar metrics.
Normalized maps:
TurboCARTO and CARTOcolors
TurboCARTO
Next-Gen Styling for Data-Driven Maps, AKA CartoCSS preprocessor. Turbo-Carto high-level API for ramps:
#selector {
    property: ramp([attribute], (...values), (...filters), mapping);
}
Where:
propertyis the CartoCSS property you want to create.[attribute]usually is a column/key name from your dataset.(...values)is whatpropertyis gonna get for different filters.(...filters)is howpropertyis gonna get the different values.mappingis the type of filter that will be applied: <, <=, >, >=, =.
Useful resources: GitHub repository, guides (basic & advanced) & workshop
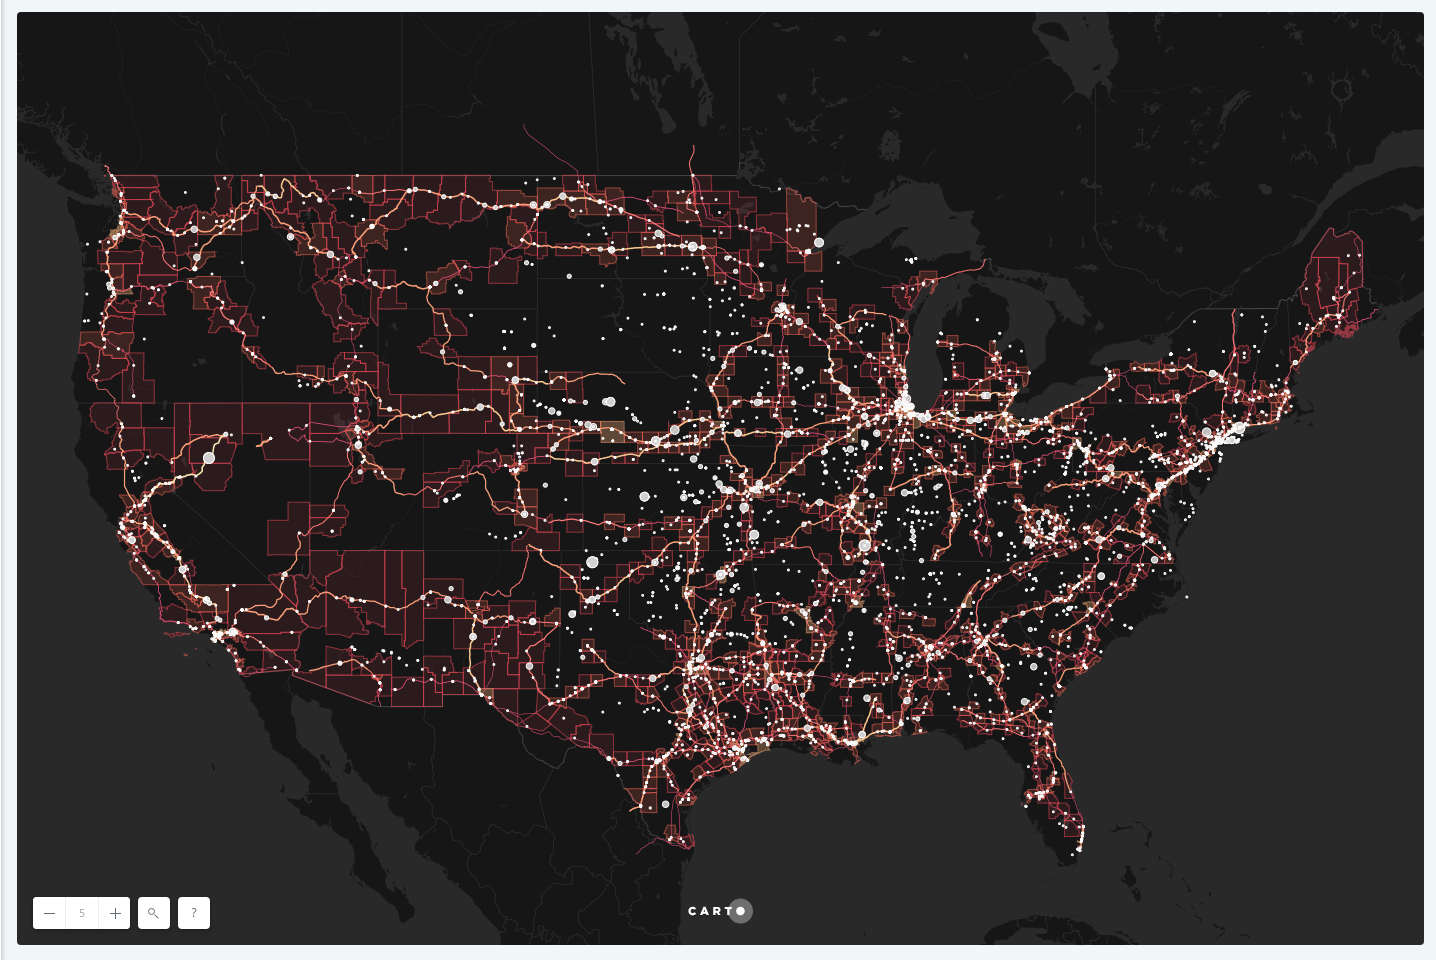
Tip: TurboCARTO proves particularly effective for bivariate or multivariate visualizations. Combining color, opacity, and width ramps creates extensive design possibilities.
#layer {
line-color: #FFF;
line-width: 0.25;
line-opacity: 0.5;
polygon-gamma: 0.5;
polygon-fill: #ff9900;
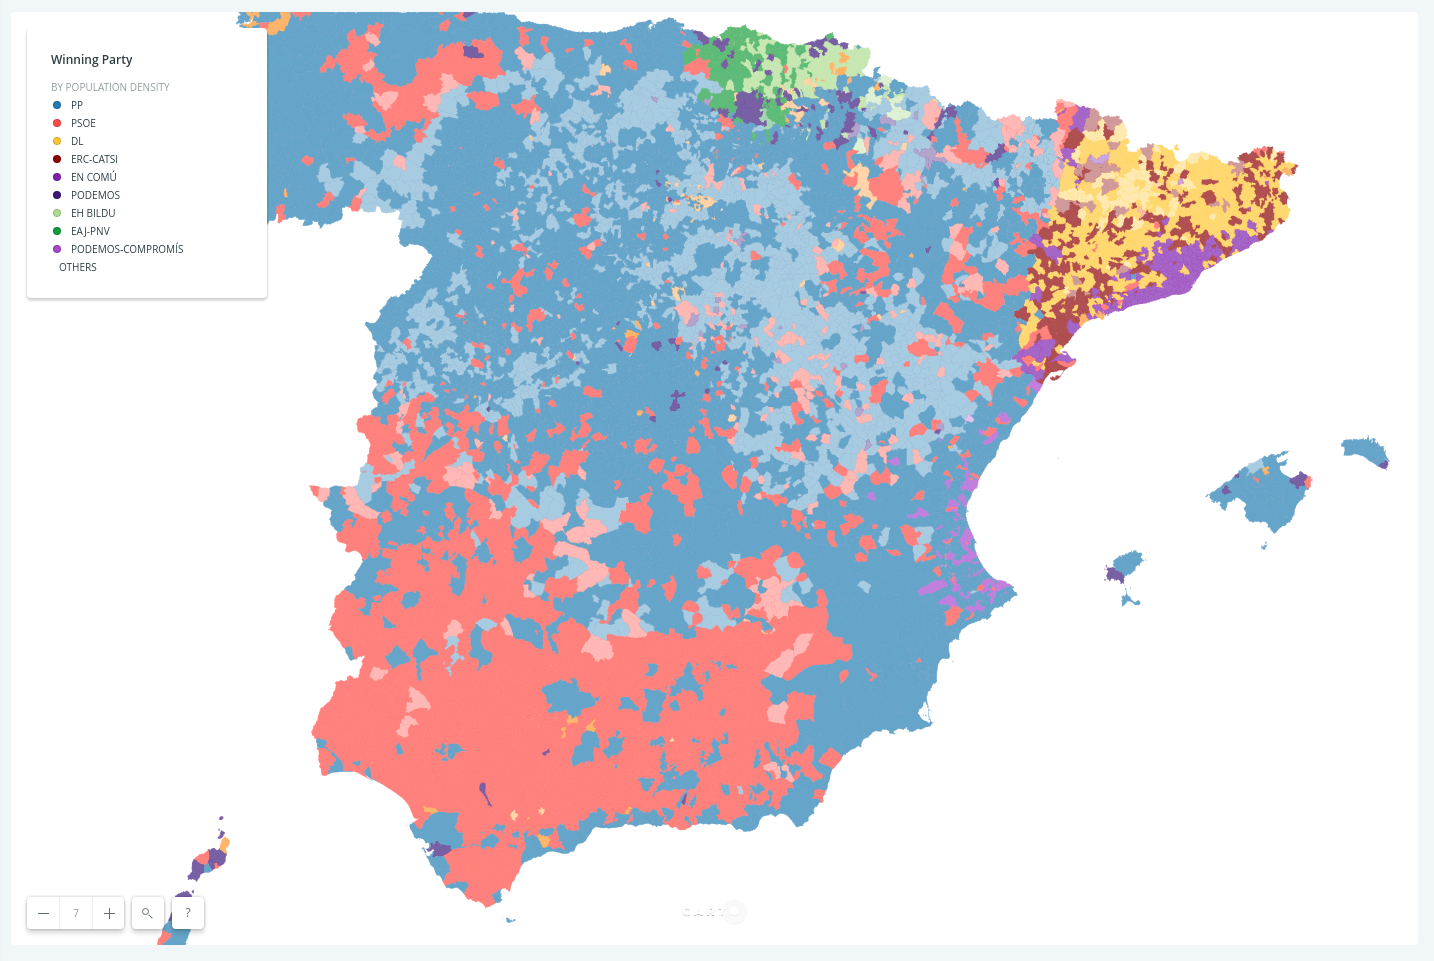
polygon-opacity: ramp([pop_density], (0.4, 0.7), quantiles(5));
polygon-fill: ramp([partido_ga], (#3e7bb6, #f84f40, #ffcc00, #850200, #7b00b4, #3b007f, #B2DF8A, #33A02C, #a53ed5), category(9));
}
#layer {
line-color: #FFF;
line-width: 0.25;
line-opacity: 0.5;
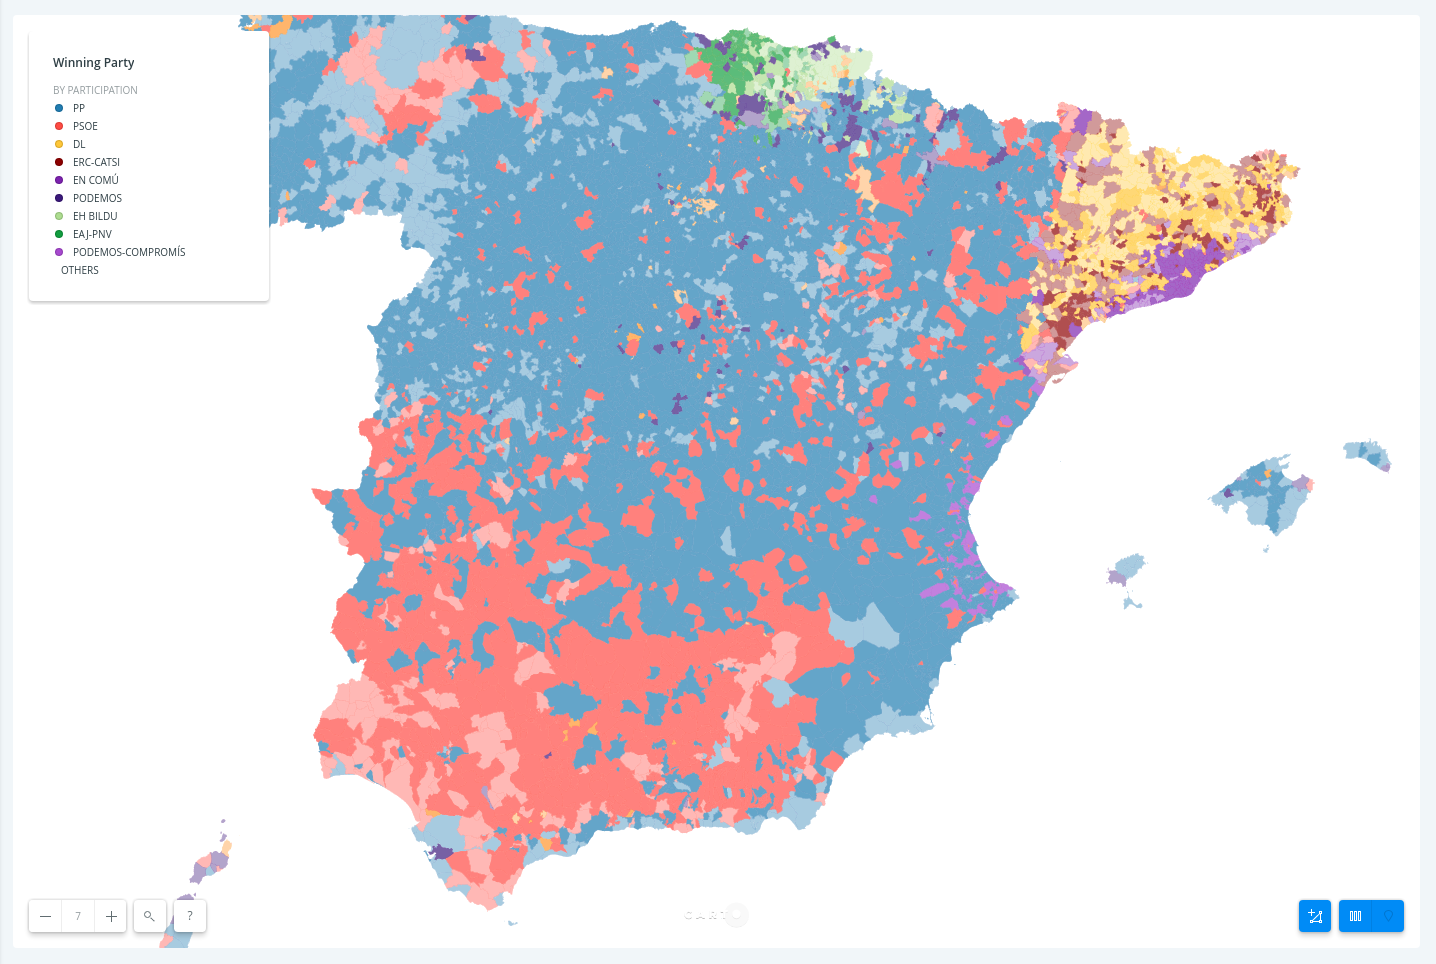
polygon-gamma: 0.5;
polygon-fill: #ff9900;
polygon-opacity: ramp([participation], (0.4, 0.7), quantiles(5));
polygon-fill: ramp([partido_ga], (#3e7bb6, #f84f40, #ffcc00, #850200, #7b00b4, #3b007f, #B2DF8A, #33A02C, #a53ed5), category(9));
}
Tip: Style polygon, line, and marker stroke width, color, and opacity as demonstrated in this guide.
CARTOcolors
a. ColorBrewer
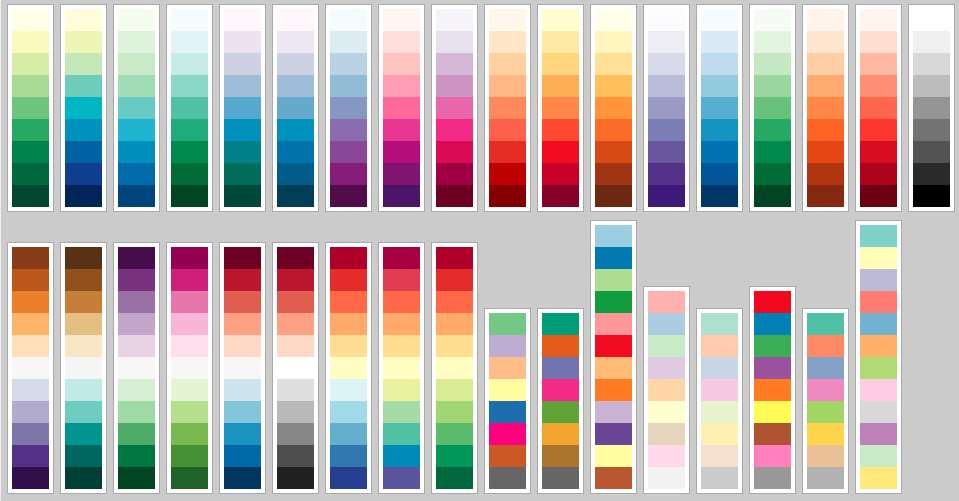
Useful resources: ColorBrewer2 & every ColorBrewser scale
b. CARTOcolors

Designed for web maps, work nicely with CARTO basemaps.
Useful resources: CARTOcolors landing page & GitHub repository
Tip: Consider what the thematic data represents, interactions between other layers and the basemap, visual hierarchy, your audience, and the device where the map will display.
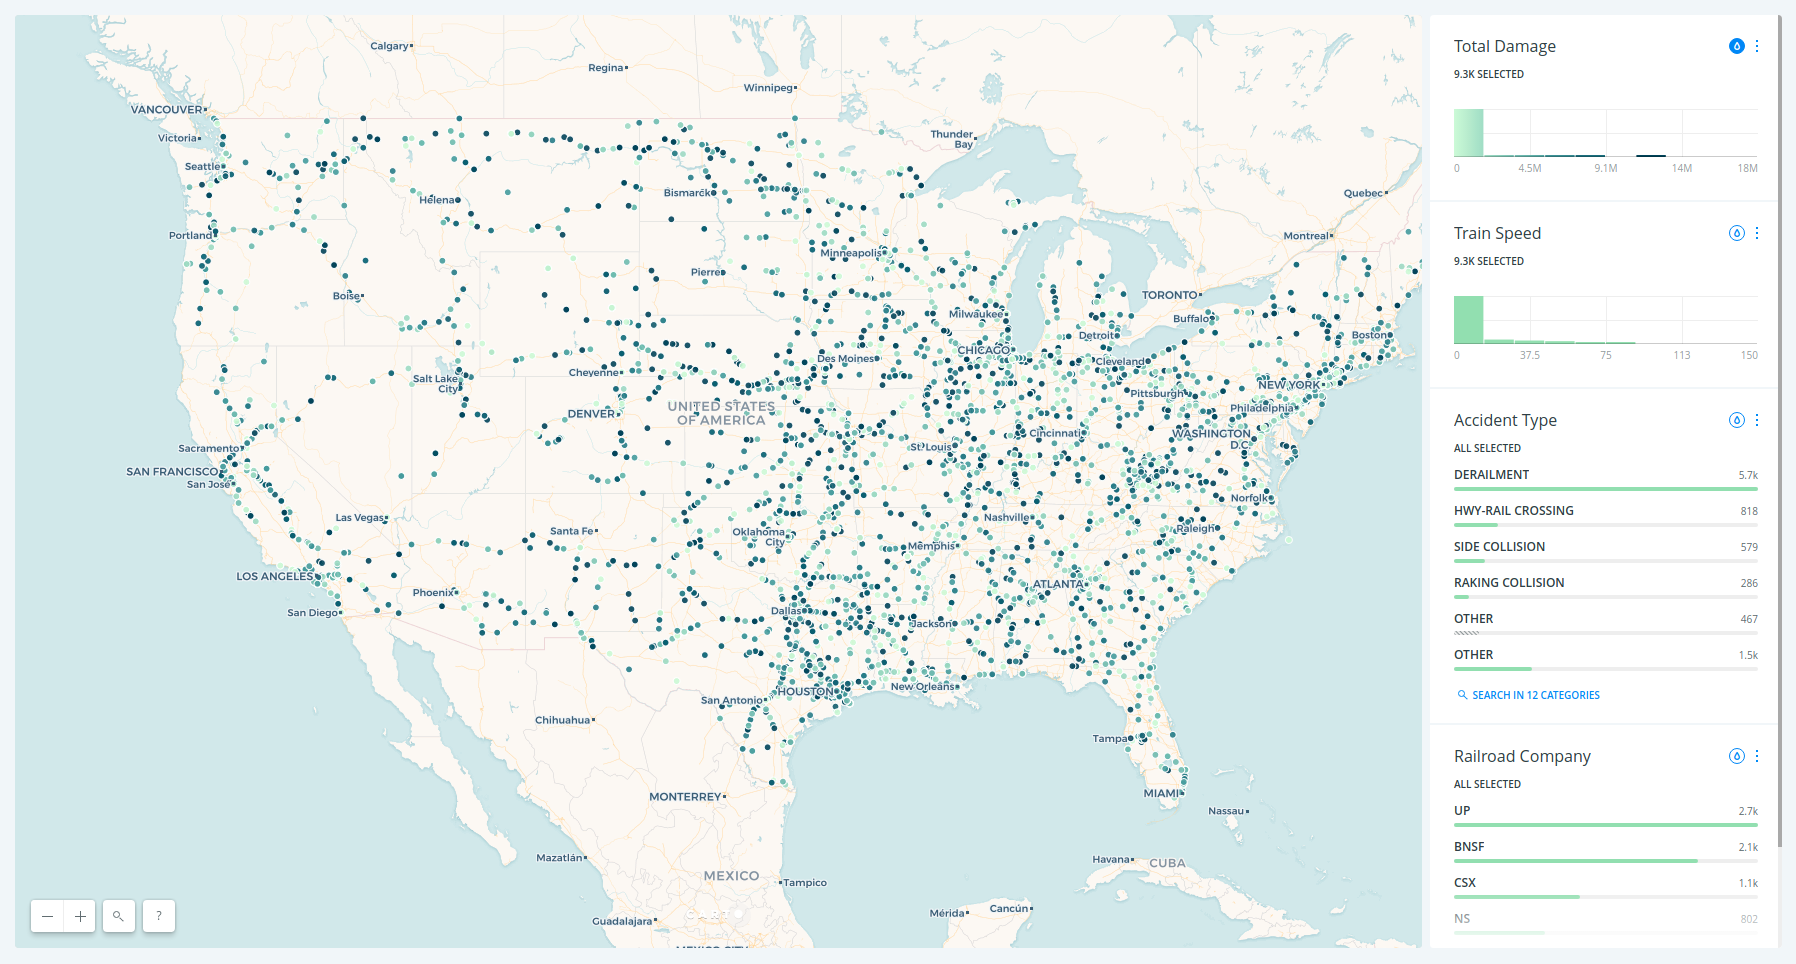
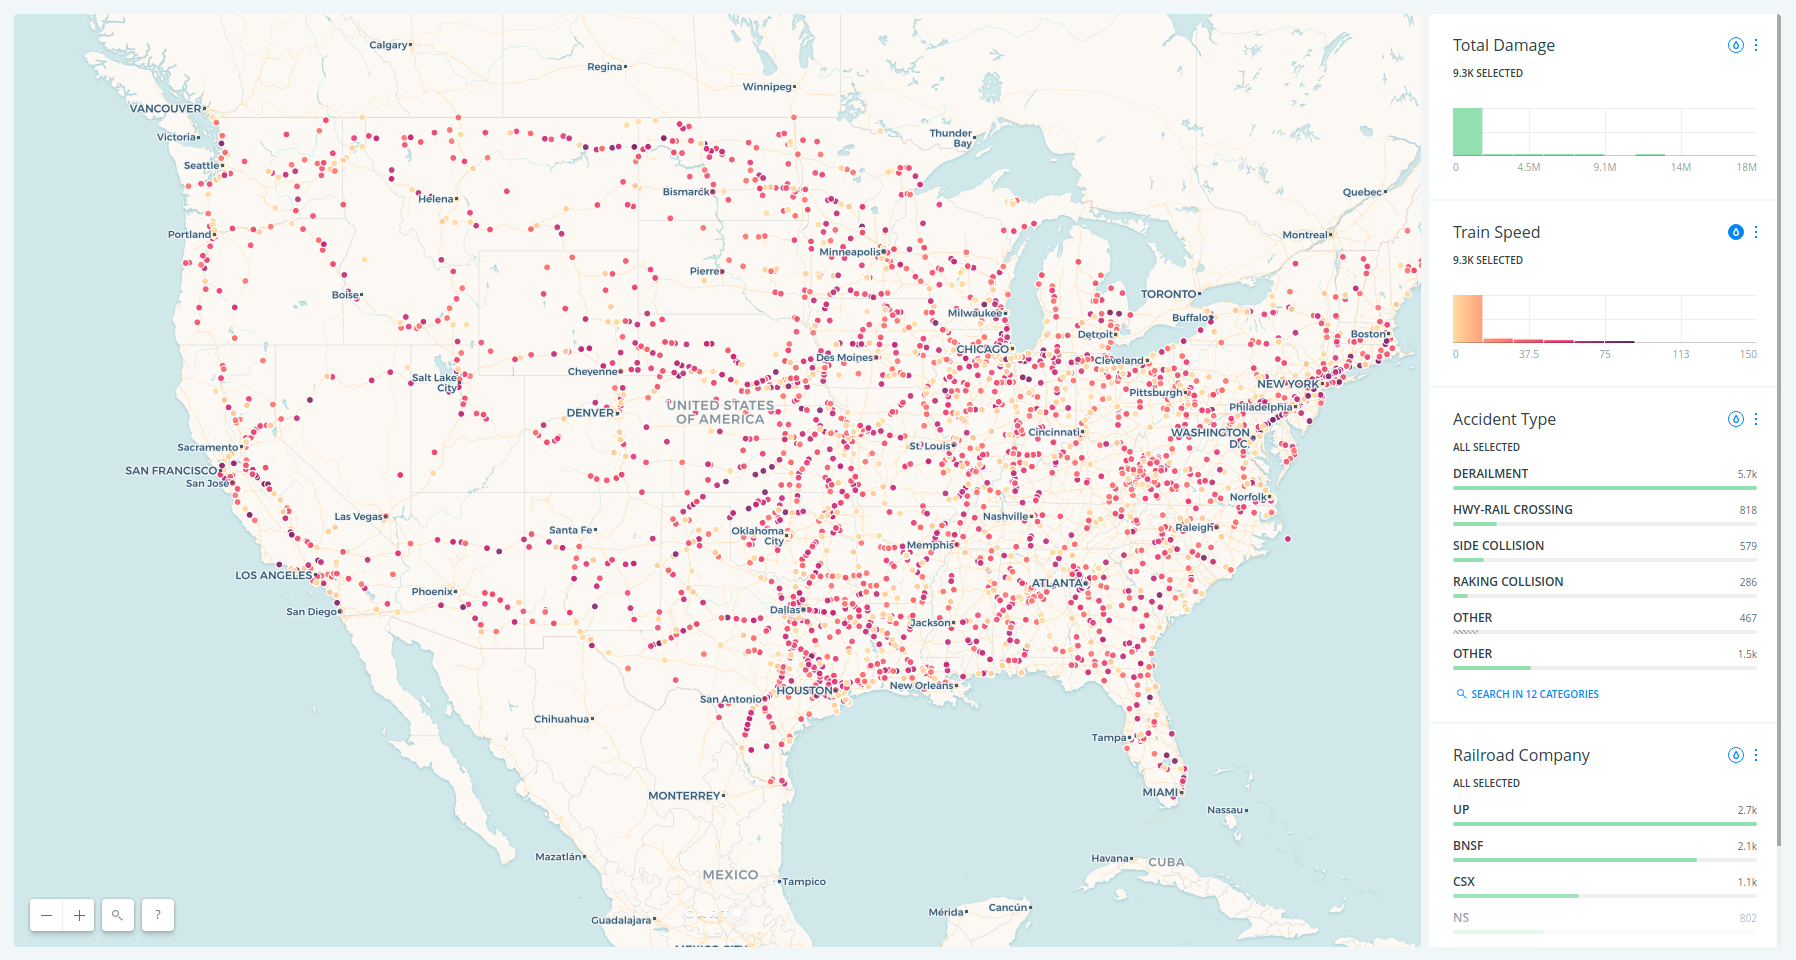
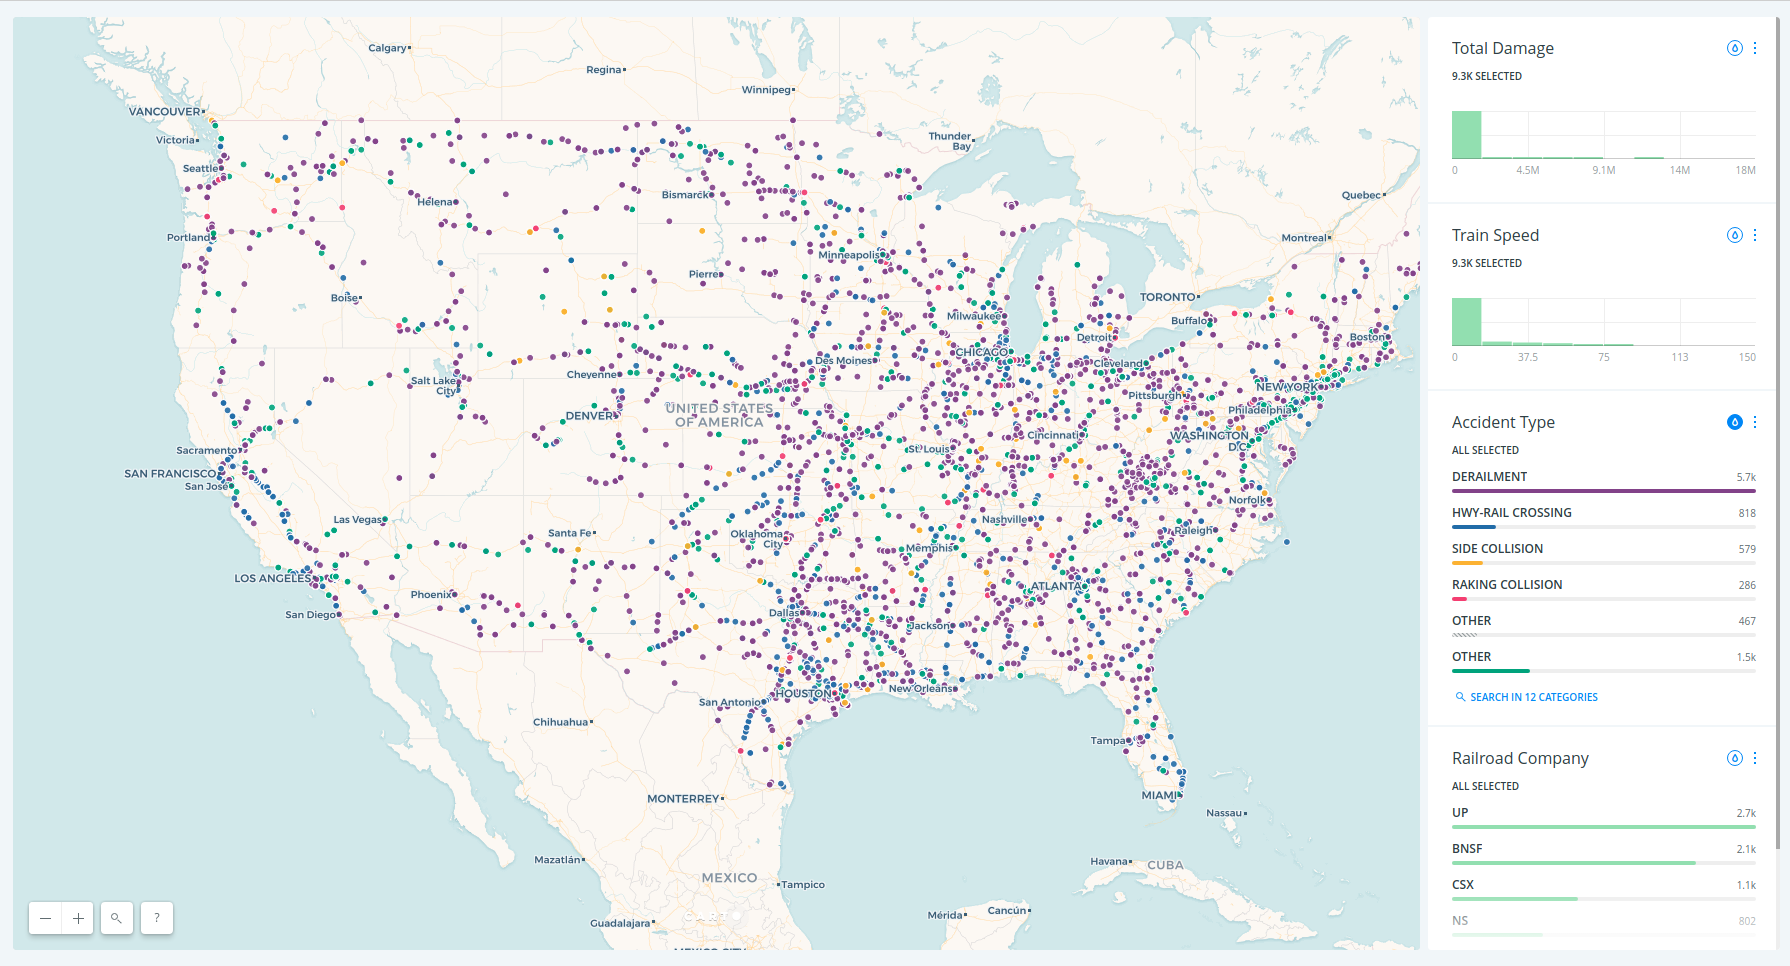
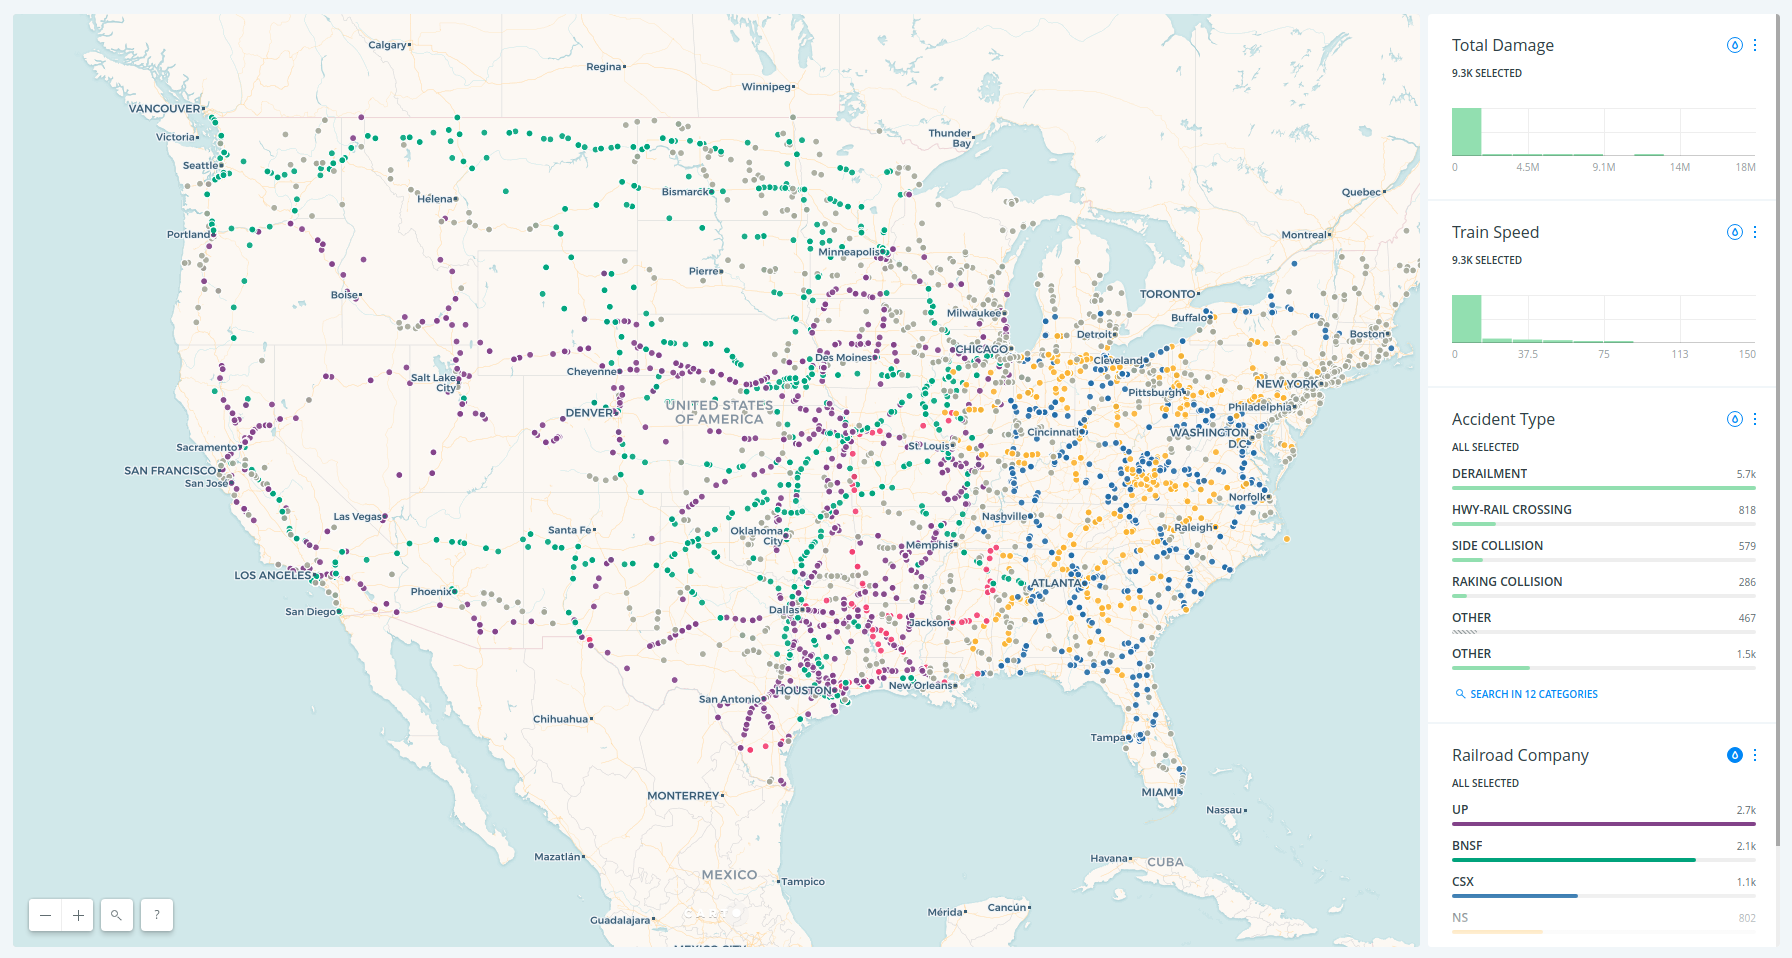
Interactivity
Widgets
Tip: Widgets can function as legends using auto style as explained in this guide
Legends
Tip: Start with style BY VALUE from the Builder UI, then switch to CartoCSS and modify the TurboCARTO ramps.
Popups
Tip: Display minimal information on hover, and reserve detailed information for click interactions.