How to visualize more than ten categories
Learn how to use CartoCSS and CARTO VL to visualize more than the default number of categories.
Category Maps, also called Qualitative Maps, are meant to visualize a data attribute’s unique values. For example, in a dataset of world borders that contains a column of country names, each unique name is considered a category.
No category should look more important than another, since they are representing values that do not have hierarchy. An ideal palette to use for category colors should contain swatches with equal visual weight. You can create your own or use one of our CARTOColor schemes.
The more categories you have the harder it gets to choose palette colors that are easily distinguishable from each other, while maintaining even visual hierarchy. When you use Style By Value to create a Category Map in Builder, up to 10 categories are given unique colors and the rest are bucketed into an “Other” category and colored gray.
What should you do if you want to visualize more than 10 categories, without using “Other”?
Custom CartoCSS with Repeating Colors
If it’s ok for some categories to have the same color, one solution is to use custom CartoCSS.
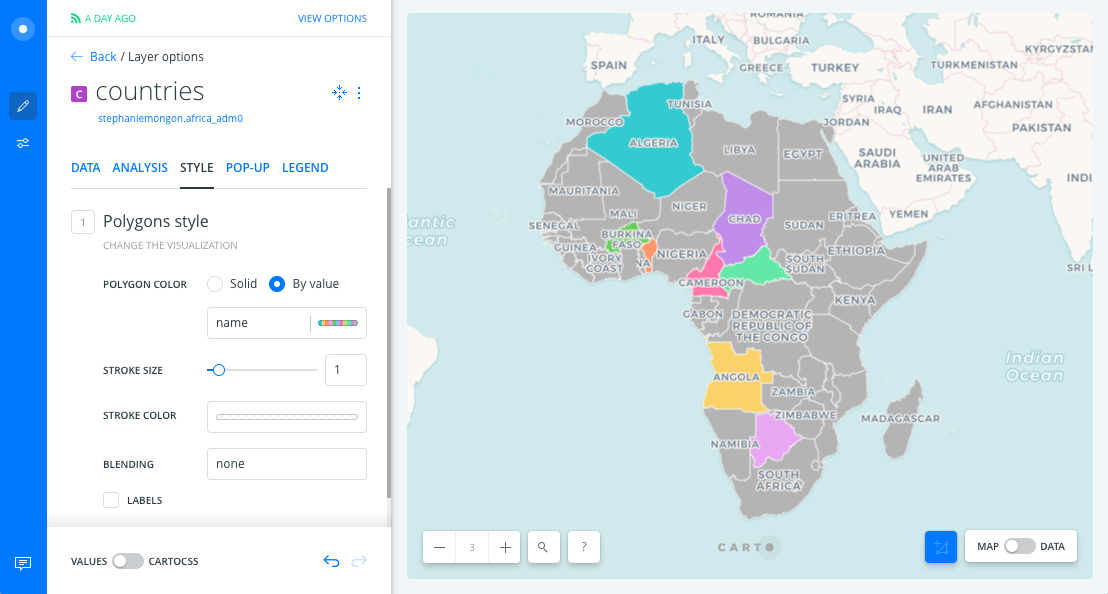
For example, in this map of African countries we can make our initial Style By Value selections in the countries layer STYLE panel. Then we set the toggle to CartoCSS. TurboCARTO is being used to define which countries get which colors, based on the name column.

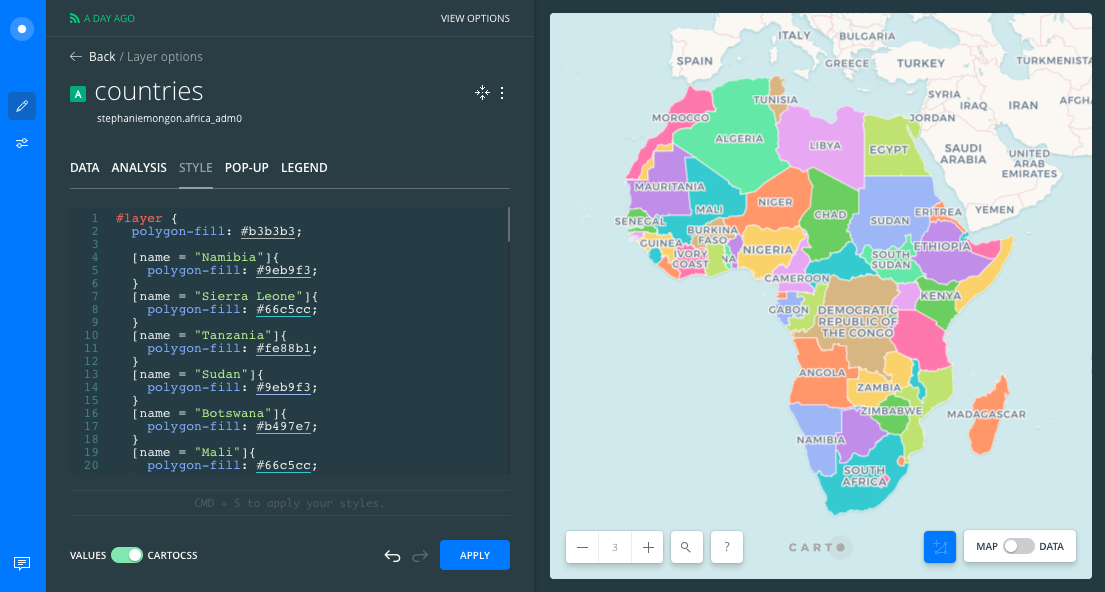
Instead we can write conditional CartoCSS that defines a color for each country. We can re-use the colors for different categories.
#layer {
  polygon-fill: #b3b3b3;

  [name = "Namibia"]{
    polygon-fill: #9eb9f3;
  }
  [name = "Sierra Leone"]{
    polygon-fill: #66c5cc;
  }
  [name = "Tanzania"]{
    polygon-fill: #fe88b1;
  }
  [name = "Sudan"]{
    polygon-fill: #9eb9f3;
  }
  [name = "Botswana"]{
    polygon-fill: #b497e7;
  }
  [name = "Mali"]{
    polygon-fill: #66c5cc;
  }
  [name = "Burundi"]{
    polygon-fill: #b497e7;
  }
  [name = "Mozambique"]{
    polygon-fill: #c9db74;
  }
  [name = "Rwanda"]{
    polygon-fill: #87c55f;
  }
  [name = "Senegal"]{
    polygon-fill: #87c55f;
  }
  [name = "Morocco"]{
    polygon-fill: #fe88b1;
  }
  [name = "Gabon"]{
    polygon-fill: #9eb9f3;
  }
  [name = "W. Sahara"]{
    polygon-fill: #f6cf71;
  }
  [name = "Central African Rep."]{
    polygon-fill: #66c5cc;
  }
  [name = "Ethiopia"]{
    polygon-fill: #b497e7;
  }
  [name = "Eq. Guinea"]{
    polygon-fill: #f89c74;
  }
  [name = "Ghana"]{
    polygon-fill: #c9db74;
  }
  [name = "Tunisia"]{
    polygon-fill: #d3b484;
  }
  [name = "Comoros"]{
    polygon-fill: #66c5cc;
  }
  [name = "Burkina Faso"]{
    polygon-fill: #d3b484;
  }
  [name = "Angola"]{
    polygon-fill: #f89c74;
  }
  [name = "Mauritania"]{
    polygon-fill: #b497e7;
  }
  [name = "Uganda"]{
    polygon-fill: #dcb0f2;
  }
  [name = "Benin"]{
    polygon-fill: #b497e7;
  }
  [name = "Dem. Rep. Congo"]{
    polygon-fill: #d3b484;
  }
  [name = "Somalia"]{
    polygon-fill: #f6cf71;
  }
  [name = "South Africa"]{
    polygon-fill: #66c5cc;
  }
  [name = "Kenya"]{
    polygon-fill: #87c55f;
  }
  [name = "Zambia"]{
    polygon-fill: #f6cf71;
  }
  [name = "São Tomé and Principe"]{
    polygon-fill: #66c5cc;
  }
  [name = "Egypt"]{
    polygon-fill: #c9db74;
  }
  [name = "Togo"]{
    polygon-fill: #8be0a4;
  }
  [name = "Guinea"]{
    polygon-fill: #f6cf71;
  }
  [name = "Congo"]{
    polygon-fill: #c9db74;
  }
  [name = "Nigeria"]{
    polygon-fill: #f6cf71;
  }
  [name = "Liberia"]{
    polygon-fill: #f89c74;
  }
  [name = "Swaziland"]{
    polygon-fill: #f89c74;
  }
  [name = "Gambia"]{
    polygon-fill: #9eb9f3;
  }
  [name = "Malawi"]{
    polygon-fill: #66c5cc;
  }
  [name = "S. Sudan"]{
    polygon-fill: #8be0a4;
  }
  [name = "Somaliland"]{
    polygon-fill: #fe88b1;
  }
  [name = "Guinea-Bissau"]{
    polygon-fill: #dcb0f2;
  }
  [name = "Cape Verde"]{
    polygon-fill: #66c5cc;
  }
  [name = "Djibouti"]{
    polygon-fill: #66c5cc;
  }
  [name = "Zimbabwe"]{
    polygon-fill: #87c55f;
  }
  [name = "Cameroon"]{
    polygon-fill: #dcb0f2;
  }
  [name = "Niger"]{
    polygon-fill: #f89c74;
  }
  [name = "Lesotho"]{
    polygon-fill: #fe88b1;
  }
  [name = "Algeria"]{
    polygon-fill: #8be0a4;
  }
  [name = "Côte d'Ivoire"]{
    polygon-fill: #fe88b1;
  }
  [name = "Chad"]{
    polygon-fill: #87c55f;
  }
  [name = "Madagascar"]{
    polygon-fill: #f89c74;
  }
  [name = "Libya"]{
    polygon-fill: #dcb0f2;
  }
  [name = "Eritrea"]{
    polygon-fill: #F89C74;
  }
}

PostgreSQL Shortcut
That’s a lot of CartoCSS to write! A faster way is to group the countries and assign colors to each group. We can do that by applying this PostgreSQL shortcut in our map layer’s DATA tab SQL panel:
SELECT cartodb_id, the_geom, the_geom_webmercator, name, cartodb_id % 11 as modulus
FROM africa_adm0
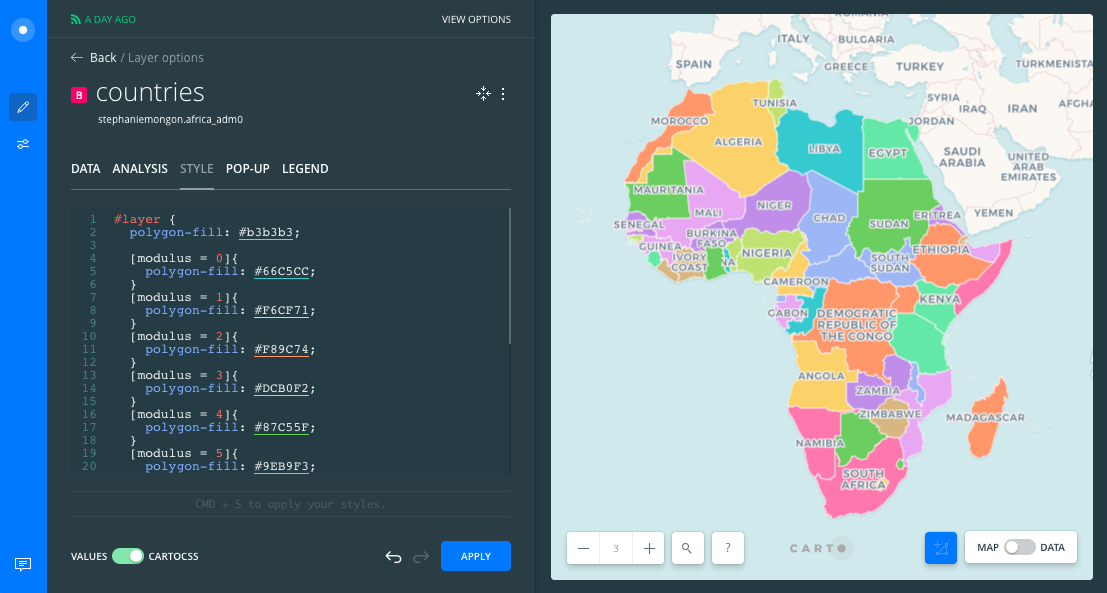
The name of our map layer’s dataset is africa_adm0. Since the Pastel palette we’re using has 11 colors, we are using modulus to assign numbers 0 through 10 for each set of 11 rows in our dataset. Then we can set a color for each of those 11 numbers:
#layer {
  polygon-fill: #b3b3b3;

  [modulus = 0]{
    polygon-fill: #66C5CC;
  }
  [modulus = 1]{
    polygon-fill: #F6CF71;
  }
  [modulus = 2]{
    polygon-fill: #F89C74;
  }
  [modulus = 3]{
    polygon-fill: #DCB0F2;
  }
  [modulus = 4]{
    polygon-fill: #87C55F;
  }
  [modulus = 5]{
    polygon-fill: #9EB9F3;
  }
  [modulus = 6]{
    polygon-fill: #FE88B1;
  }
  [modulus = 7]{
    polygon-fill: #C9DB74;
  }
  [modulus = 8]{
    polygon-fill: #8BE0A4;
  }
  [modulus = 9]{
    polygon-fill: #B497E7;
  }
  [modulus = 10]{
    polygon-fill: #D3B484;
  }
}

This way is more efficient. However, the previous example gives you more control over design elements like adjacent polygon color combinations.
CARTO VL Ramp
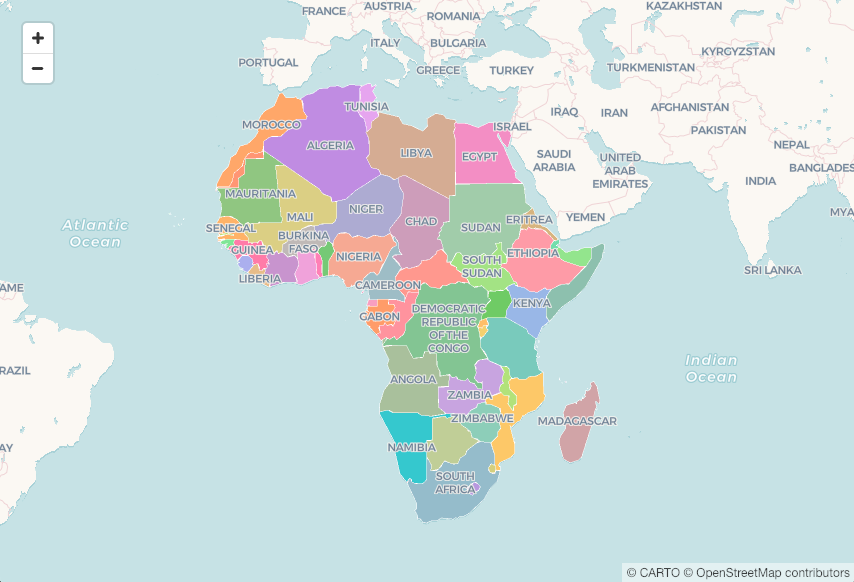
There’s an even easier way to auto-assign category colors to your features in CARTO VL. You can use the ramp function to automatically detect unique values in your category column and assign colors to them:
color: ramp($name, pastel)

Find out more about how CARTO VL’s WebGL-based styling language compares to CartoCSS in this guide.
What if you need a separate color for each category?
Aggregating Categories with Builder Analysis
If you have so many categories that it’s hard to choose enough easily-differentiated colors, another option is to aggregate the categories into fewer ones and style those.
This can be done in Builder using an Intersect and Aggregate analysis. Here’s an example.