Adding labels to your map
Apply text labels to a map layer to enhance the map typography.
Applying text labels to your data enables you to enhance the typography of your map. While adding labels is optional, they are useful for communicating details with the map viewer. Positive effects of label styling will display legible text and considerate placement of labels on the Map View, as long as the following best practices are considered:
- Label Placement. Define where to place the label in relation to the geometry.
- Label Overlap. Define when to show or hide overlapping labels, and avoid overlapping text labels (from your data) with basemap labels.
- Label Font. Select an appropriate font, size, and color for your label. For example, consider if the text appears uppercase, lowercase, mixed case, and how the label appears based on the size and style of the typeface.
Evaluate if applying labels makes sense for your map design; as it may not be necessary with the help of Legends, Pop-Ups, and Widgets. Too many labels can clutter your map and confuse the map viewer.
This guide describes how to activate labels in CARTO Builder and enhance label styling with CartoCSS. We will be using a custom designed Games of Thrones map to depict how labels can add value to your visualization.
Activate Labels for a Map layer
In CARTO Builder, the STYLE tab of a selected map layer provides basic label options. Text labels are triggered by a selected column from the connected dataset.
-
Import the template .carto file packaged from the “Download resources” of this guide and create the map. Builder opens containing eight map layers to represent the seven kingdoms from the Game of Thrones.
Click on "Download resources" from this guide to download the zip file to your local machine. Extract the zip file to view the .carto file(s) used for this guide.
If you are interested in how this data was created, view [_Our Game of Thrones Basemap is here to unite the Seven Kingdoms_](https://carto.com/blog/game-of-thrones-basemap/) blog post.
-
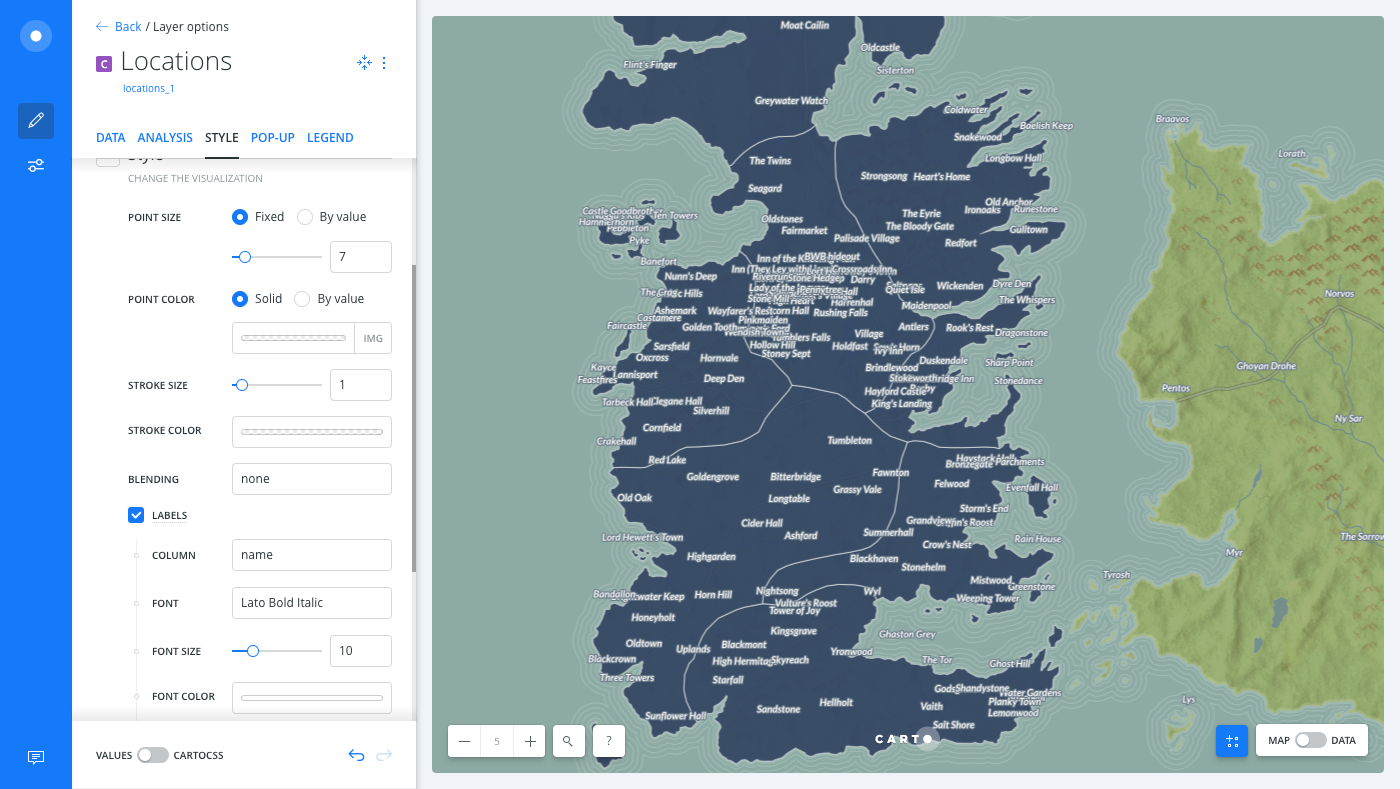
Click the Locations map layer.
-
From the STYLE tab, enable the LABELS checkbox and select the following options:
- For the COLUMN, select name. This activates labels for the map layer.
Labels are not available for animated map layers.
- For the FONT, select Lato Bold Italic.
There are too many overlapping labels. Try playing around with some of the other labels options to see how your map view changes.
CHEATSHEET: Label Styling Options
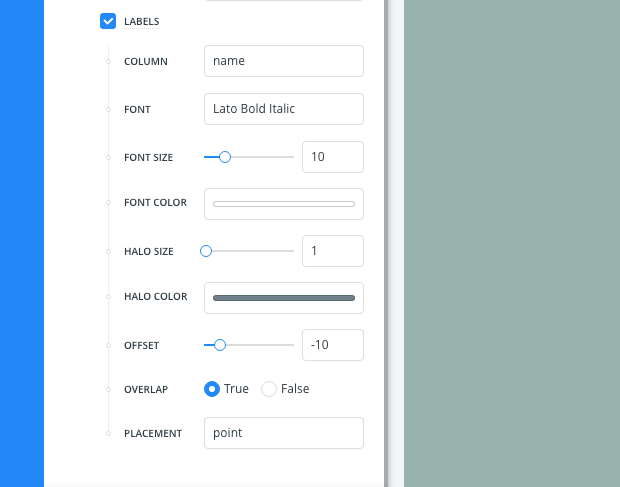
The following label options are available from the STYLE tab for a selected map layer:
- COLUMN: Select the column from your connected dataset to act as a map label.
- FONT: Select the font to be used as the typeface for the text label. See the
text-face-name: stringproperty for a description of fonts that can be applied with CartoCSS syntax. - SIZE/COLOR: Select a fixed text size and/or solid fill color for the label.
- HALO: Change the width and color of the outline around your text. This is helpful for increasing readability.
- OFFSET: Change how far the label text sits from the geometry. Positive values display the label below the marker, negative values display the label above the marker. If set to 0, the geometery appears directly under the corresponding label.
- OVERLAP: Shows or hides overlapping labels.
Trueshows all overlapping labels by default.False, does not allow labels to overlap and overlapping labels are hidden. - PLACEMENT:
point(places labels on top of markers),line(along multiple lines or border, repeatedly),vertex(on the vertexes of markers, repeatedly),interior(the interior inside a marker. The label remains in place, even if the center is outside of the geometry).
-
Remove marker styling for your points so that just the text label appears. This is achieved by making your geometry transparent with the opacity styling options, as describe in the following steps.
-
Click the selected color on the POINT COLOR option to open the color properties for the map layer.
-
Click and drag the opacity slider to remove the transparency of the selected POINT COLOR. Set the opacity to
0. -
Using the same method, adjust the opacity for the STROKE COLOR and set it to
0. This is the border around the sides of the geometry.
-
Notice the geometry fill color (POINT COLOR), and border around the markers (STROKE COLOR), is transparent. Only the text labels appear on the Map View.
CartoCSS Label Properties
When LABELS are enabled from the STYLE tab of a selected map layer, the associated CartoCSS for labels is processed behind the scenes.
    #layer::labels {
      text-name: [name];
      text-face-name: 'Lato Bold Italic';
      text-size: 10;
      text-fill: #FFFFFF;
      text-label-position-tolerance: 0;
      text-halo-radius: 1;
      text-halo-fill: #6F808D;
      text-dy: -10;
      text-allow-overlap: true;
      text-placement: point;
      text-placement-type: dummy;
    }
For descriptions about CartoCSS text label properties, reference the CartoCSS documentation.
Let’s enhance how label styling appears using CartoCSS!
Enhancing Label Design with CartoCSS
CartoCSS is the language that enables you to customize the style of your map data and text labels in CARTO. See the Basic CartoCSS for Map Styling Guide for details and resources related to CartoCSS.
If you have zoom-based stying applied with CartoCSS, it is especially important to be mindful about labels.
-
From the STYLE tab, click the slider button from VALUES to CARTOCSS.
Apply the following CartoCSS syntax to the Locations map layer.
    Map {
      buffer-size: 512;
    }

    #layer[type='City'][zoom>=4] {
      ::inner {
        marker-fill-opacity: 1;
        marker-fill: #2b2b2b;
        marker-line-width: 0;
        marker-line-opacity: 0.65;
        marker-placement: point;
        marker-type: ellipse;
        marker-width: 5;
        marker-line-color: #2b2b2b;
        marker-allow-overlap: true;
      }
      ::labels {
        text-name: [name];
        text-face-name: "Lato Bold Italic";
        text-size: 11;
        text-fill: #2b2b2b;
        text-halo-fill: fadeout(lighten(#7E9968,12),70);
        text-halo-radius: 1.5;
        text-placement-type: simple;
        text-placements: "E,W,NW,NE,SE,8";
        text-dx: -5;
        text-dy: -4;
        text-character-spacing: 0;
          [zoom>=5] {
            text-size: 12;
          }
          [zoom>=6] {
            text-size: 13;
          }
          [zoom>=7] {
            text-size: 15;
          }
      }
    }
Since this map layer has zoom-based styling applied, labels compliment the data because of the
text-face-name,text-size,text-halo-fill, andtext-placementparameters applied.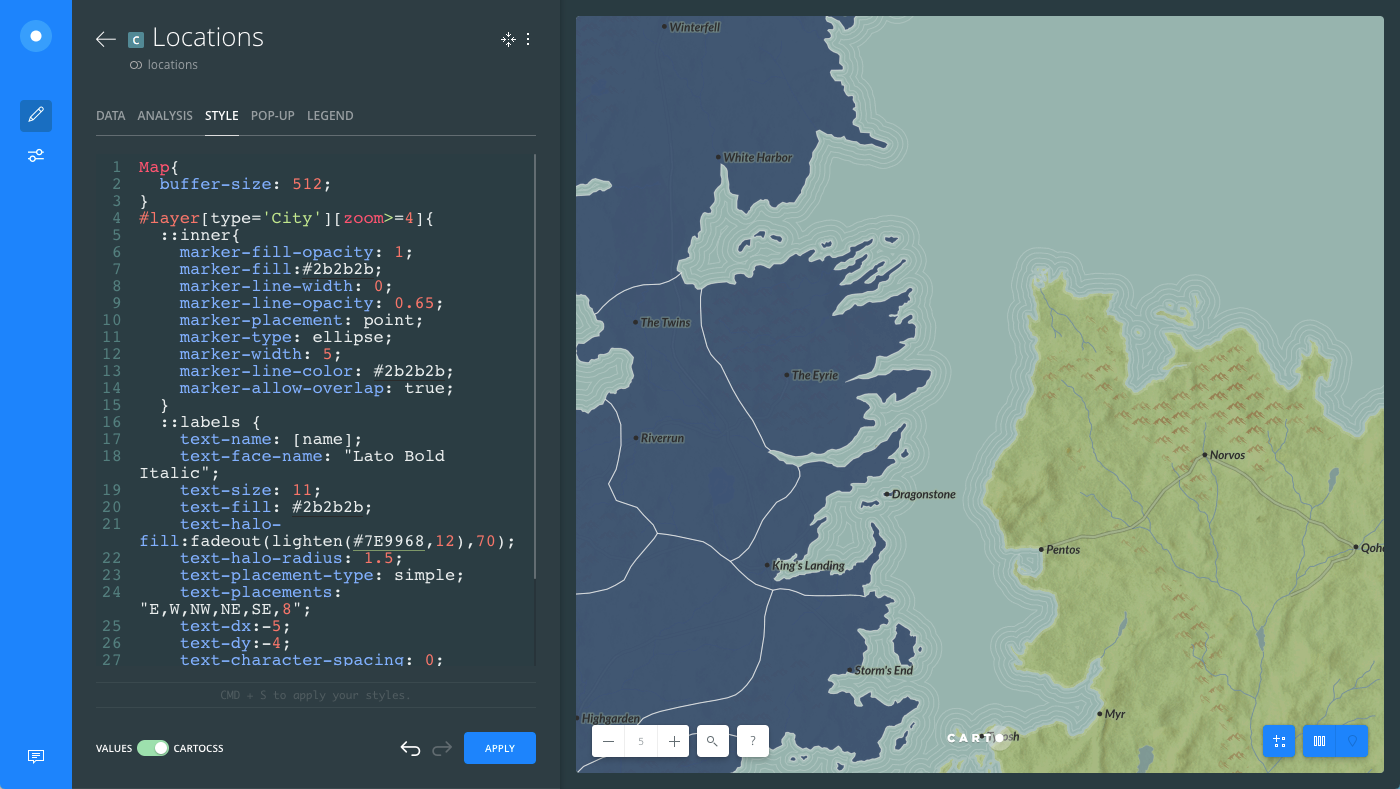
Once you apply custom CartoCSS styling for any map layer, you cannot switch back to the VALUES selections; unless you clear the CartoCSS styling applied. Your custom styling will be removed.
-
Click the back arrow, located next to the Locations map layer name, to navigate back to the LAYERS list.
-
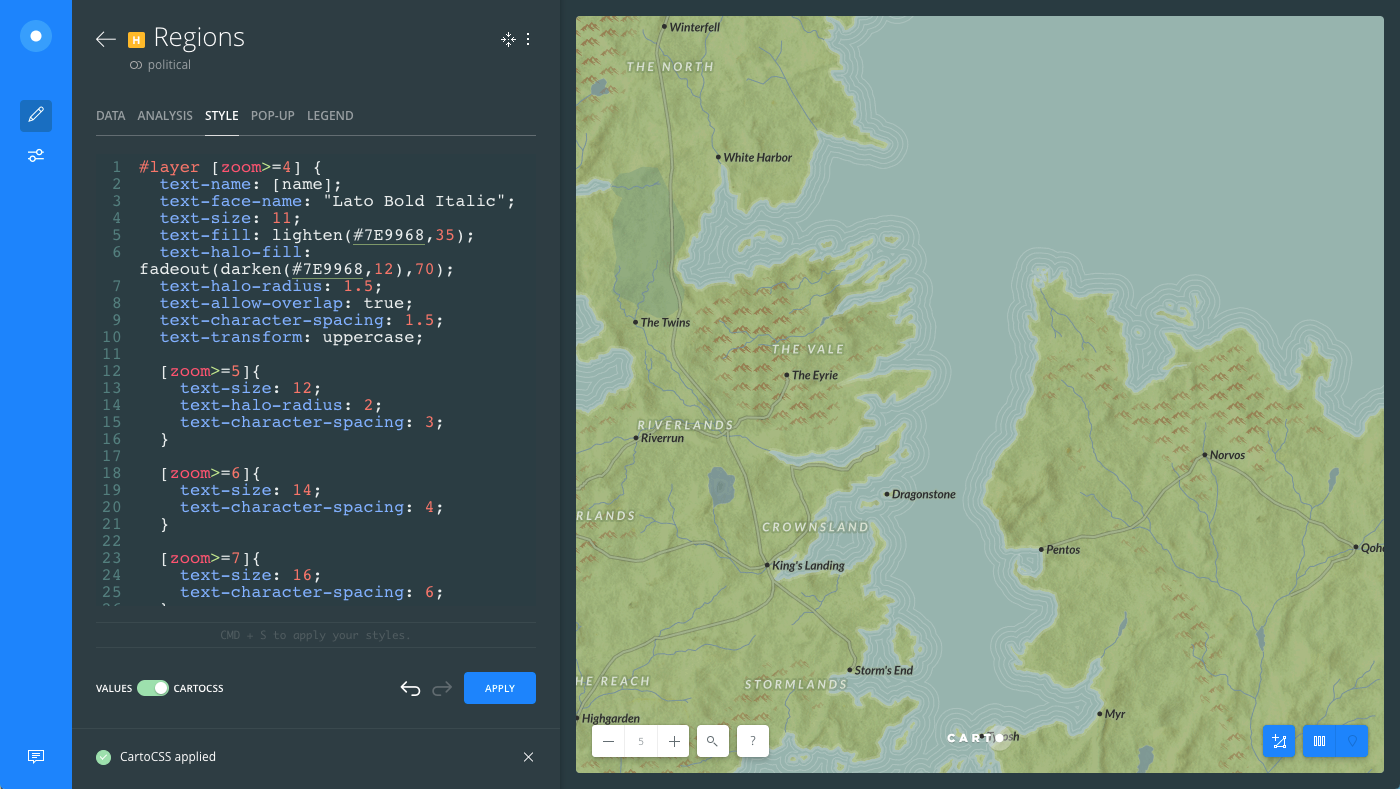
Select the Regions map layer and click the slider button from VALUES to CARTOCSS.
Apply the following CartoCSS styling to the Regions map layer.
    #layer[zoom>=4] {
      text-name: [name];
      text-face-name: "Lato Bold Italic";
      text-size: 11;
      text-fill: lighten(#7E9968,35);
      text-halo-fill: fadeout(darken(#7E9968,12),70);
      text-halo-radius: 1.5;
      text-allow-overlap: true;
      text-character-spacing: 1.5;
      text-transform: uppercase;

      [zoom>=5]{
        text-size: 12;
        text-halo-radius: 2;
        text-character-spacing: 3;
      }

      [zoom>=6]{
        text-size: 14;
        text-character-spacing: 4;
      }

      [zoom>=7]{
        text-size: 16;
        text-character-spacing: 6;
      }
    }
Similar to Locations layer, the Regions map layer also includes zoom-based stying. This CartoCSS styling applied some needed spacing between text characters, and transformed them into uppercase.
Download the final .carto file, packaged from the “Download resources” of this guide to view the CartoCSS syntax that was applied to this map.
Zoom-Based Styling for Text Labels
Zoom-based styling enforces rules for when and how labels appear on your map. This allows you to apply conditional styling based on the map zoom level, such as:
- Show or hide labels based on a specified zoom level.
- Define how text labels appear at a specified zoom level. For example, increase/decrease text size, change the typeface, and so on.
Whenever a [zoom] CartoCSS property appears, this indicates that labels styling should only appear when the map meets the specified zoom level. Otherwise, labels are hidden.
    #layer [zoom>=4]{
      text-name: [name];
   }
  }
The [zoom] and [text-name] values need to be defined in the syntax.
-
[zoom]indicates the zoom level for when to show map labels. Specify the logical operator for the zoom level. Otherwise, labels are hidden. -
[text-name]indicates the column from the map layer to show at the specified zoom level.
You can use the same method to apply different label styling at zoom levels. For example, you can change the font or the text size at different zoom levels.
Zoom-based styling can also be used for conditional styling of your data, and is helpful if you have a map with multiple layers. View the CartoCSS Best Practices for additional tips.