CartoCSS Essentials - Part 1
CartoCSS properties, syntax, variables, composite operations and more.
CartoCSS is the syntax language that enables you to customize the style of your map data. Similar to working with a Cascading Style Sheet (or CSS) for styling webpages, CartoCSS is specific to the design of map symbolizer properties (such as marker size, marker color, line pattern, line stroke, text display, and so on). You can apply CartoCSS code directly from the STYLE options of a selected map layer. Optionally, you can apply CartoCSS with CARTO.js and the Maps API.
CartoCSS Properties
Each CartoCSS map category has its own configurable properties. You can apply multiple symbolizers and properties to the same map layer. In CARTO Documentation you can navigate to a selected symbolizer to view a description of the CartoCSS property, sample CartoCSS code, the default value, and the available values.
CartoCSS Syntax
Note how the CartoCSS syntax is structured and the different CartoCSS properties used when styling the three types of geometries. All examples showed in this workshop can be replicated using the following datasets from the DATA LIBRARY:
- Points:
ne_10m_populated_places_simple - Lines:
ne_50m_rivers_lake_centerlines - Polygons:
ne_50m_land
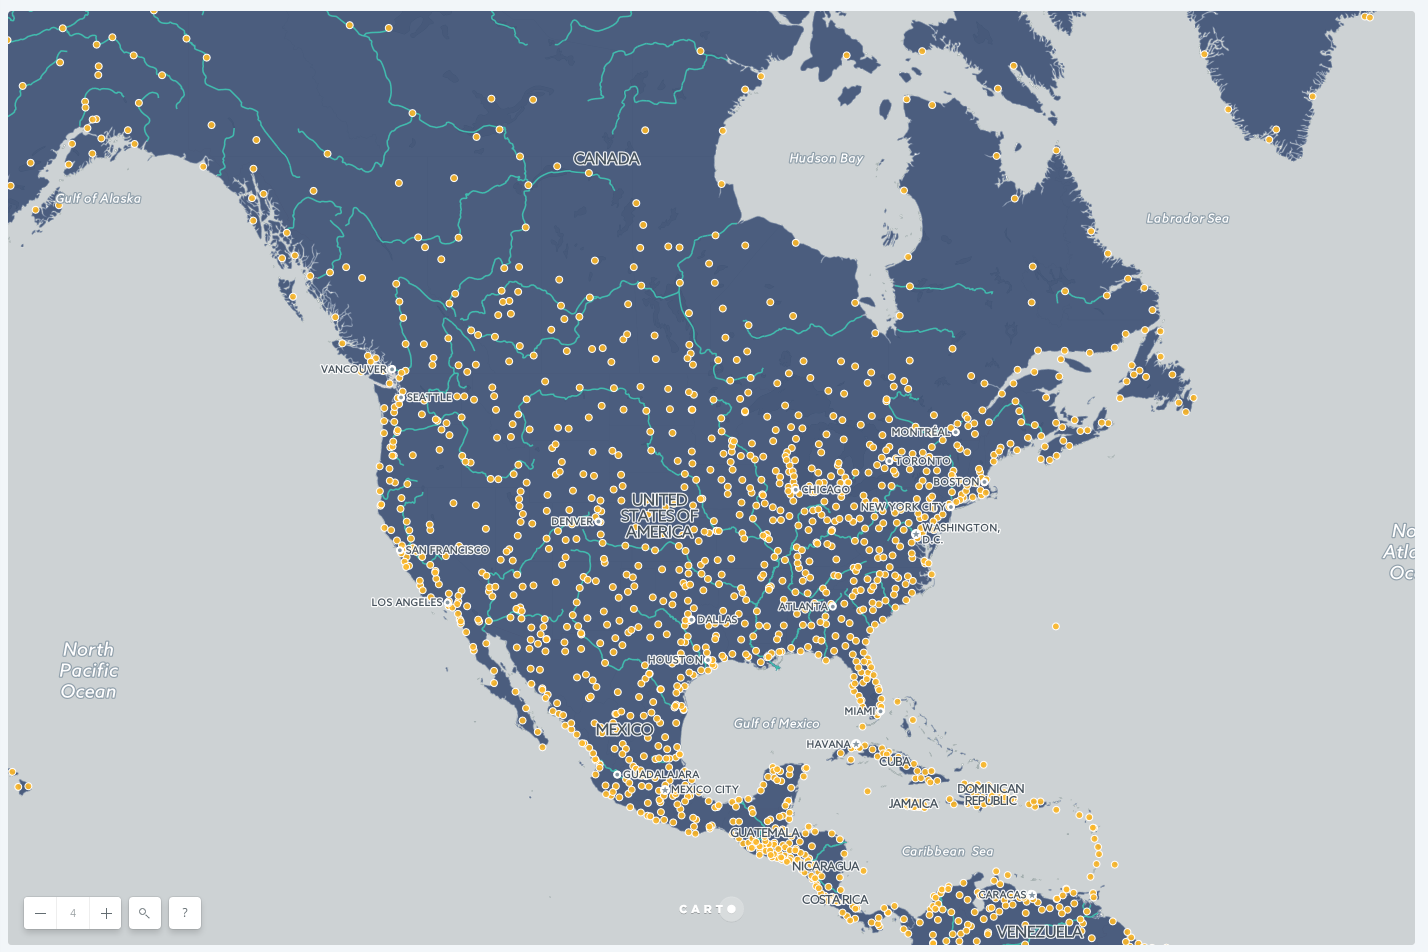
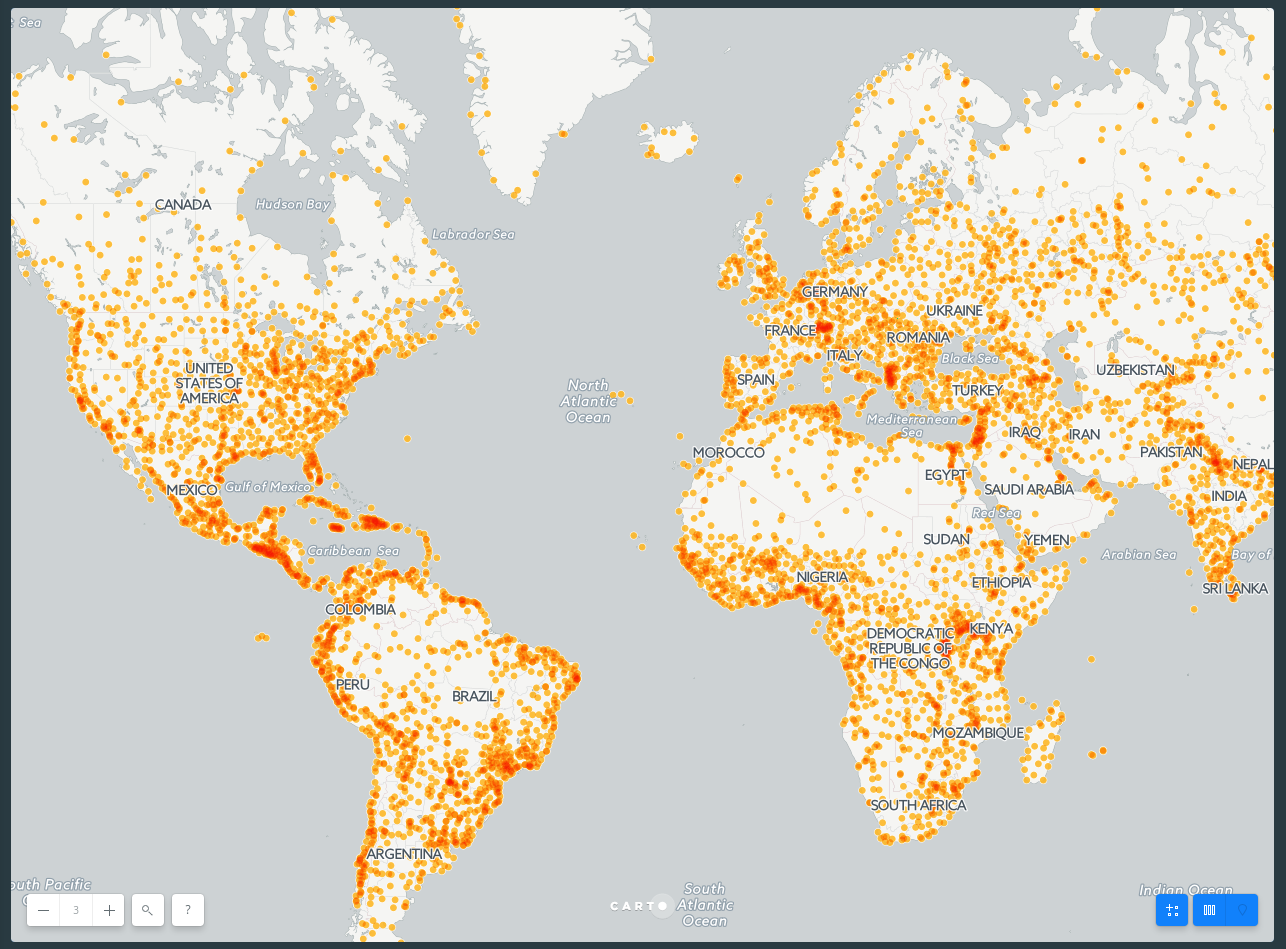
Points
#layer {
  marker-width: 7;
  marker-fill: #FFB927;
  marker-fill-opacity: 0.9;
  marker-line-color: #FFF;
  marker-line-width: 1;
  marker-line-opacity: 1;
  marker-placement: point;
  marker-type: ellipse;
  marker-allow-overlap: true;
}
Units for sizes are in pixels unless stated differenetly. Check the documentation for the valid values for properties like marker-placement or marker-type.
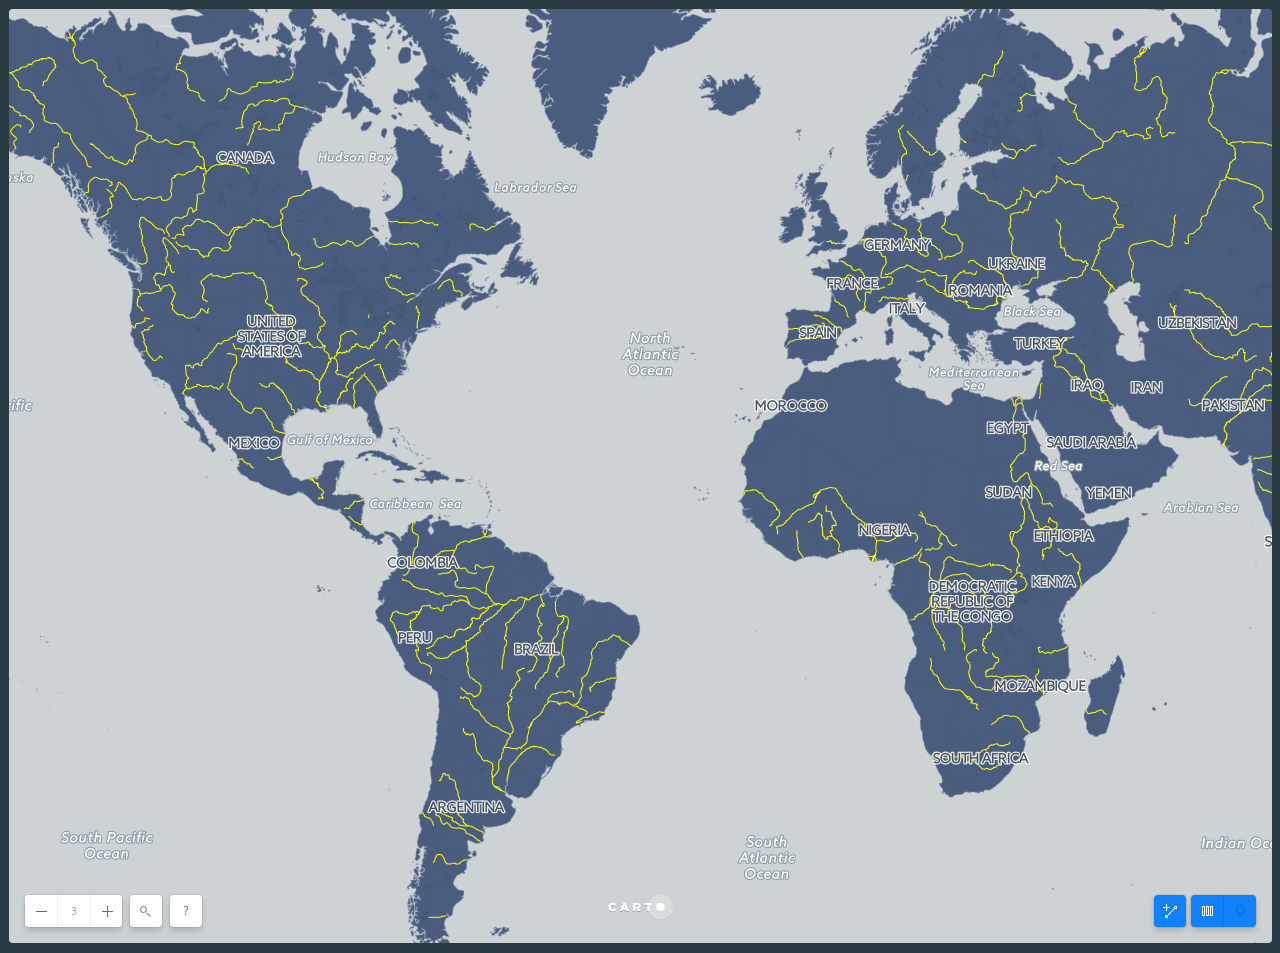
Lines
#layer {
  line-color: #3EBCAE;
  line-width: 1.5;
  line-opacity: 1;
}
Polygons
#layer {
  polygon-fill: #374C70;
  polygon-opacity: 0.9;
  polygon-gamma: 0.5;
  line-color: #FFF;
  line-width: 1;
  line-opacity: 0.5;
  line-comp-op: soft-light;
}
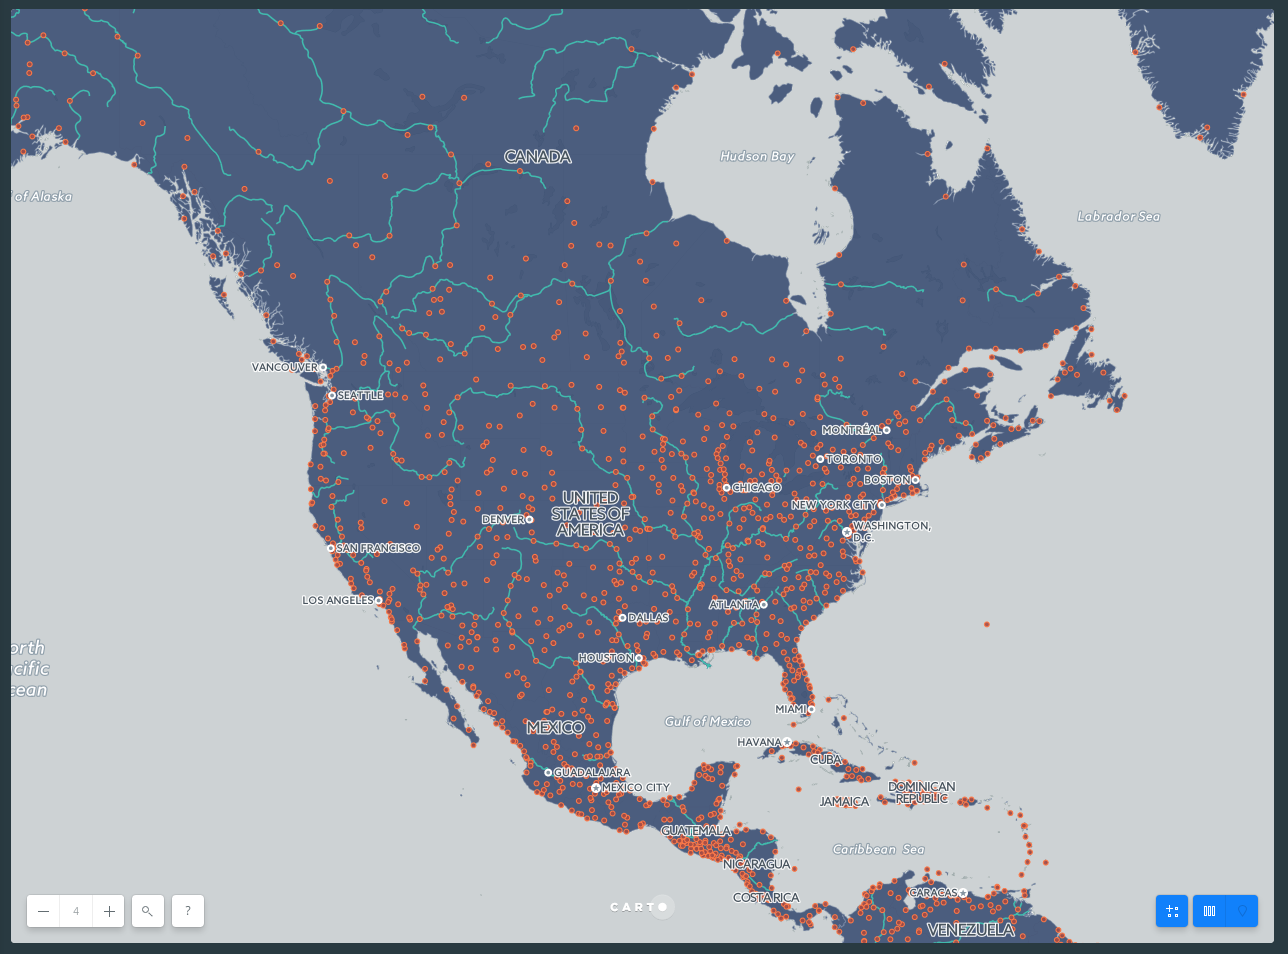
CartoCSS variables
Apply the @ symbol to lists of all the color values for your categories. The CartoCSS syntax is structured so that you can apply all your color changes in one section @name: color; and reference the point style within the category label marker-fill: @name;. This enables you to visualize exactly where your marker-fill values are located, in addition to the overall map styles*.
@fill: #A64942;
@line: #FF7844;

#layer {
  marker-width: 5;
  marker-fill: @fill;
  marker-fill-opacity: 0.9;
  marker-line-color: @line;
  marker-line-width: 1;
  marker-line-opacity: 1;
  marker-placement: point;
  marker-type: ellipse;
  marker-allow-overlap: true;
}
Note: using CartoCSS variables inside TurboCARTO ramp functions is not supported at the moment.
CartoCSS Comments
If you are just learning CartoCSS, it might be useful to add comments next to lines of your CartoCSS code. For example, you can add comments to describe a specific hex color, the default value for a property, the available values, and so on.
Enter comments by using the following format in your CartoCSS code. Note the required spacing:
cartocss-property; /* comment */
In the following example, there are user comments entered in the marker-line-color, marker-placement, marker-width, and marker-fill CartoCSS properties.
/** simple visualization */

#layer{
  marker-fill-opacity: 0.9;
  marker-line-color: #FFF; /* white */
  marker-line-width: 1;
  marker-line-opacity: 1;
  marker-placement: point; /* options are point, line, interior */
  marker-type: ellipse;
  marker-width: 15; /* default value was 10 */
  marker-fill: #2E5387; /* hex color is St Tropaz */
  marker-allow-overlap: true;
  marker-comp-op: overlay;
}
Multiple Symbolizers for a Map Layer
In some cases, you may need to apply multiple symbolizers to one map layer. For example, a point layer typically contains marker syntax. You can also attach other compatible symbolizer properties, to achieve a desired styling effect.
Enter a double-colon symbol :: to indicate a duplicate map layer without actually adding a new layer to your map. This dummy layer created through CartoCSS styling acts as an attachment, enabling you to apply multiple symbolizers to the selected layer.
Suppose you have a point symbol and want to put a glowing halo around it. You need CartoCSS values for the point style and CartoCSS values for the glowing halo.
/* bottom layer of symbol */
#layer::halo {
    marker-width: 20;
    marker-fill: teal;
    marker-fill-opacity: 1;
    marker-line-color: #FFF;
    marker-line-width: 0;
    marker-line-opacity: 1;
    marker-placement: point;
    marker-type: ellipse;
    marker-allow-overlap: true;
  }
/* top layer of symbol */
#layer{
   marker-width: 10;
   marker-fill: #FFB927 ;
   marker-fill-opacity: 0.9;
   marker-line-color: #FFF;
   marker-line-width: 0;
   marker-line-opacity: 1;
   marker-placement: point;
   marker-type: ellipse;
   marker-allow-overlap: true;
}
- The ::halo describes the style elements that you are applying to the halo
- The default, top layer describes the style elements that you are applying to the point
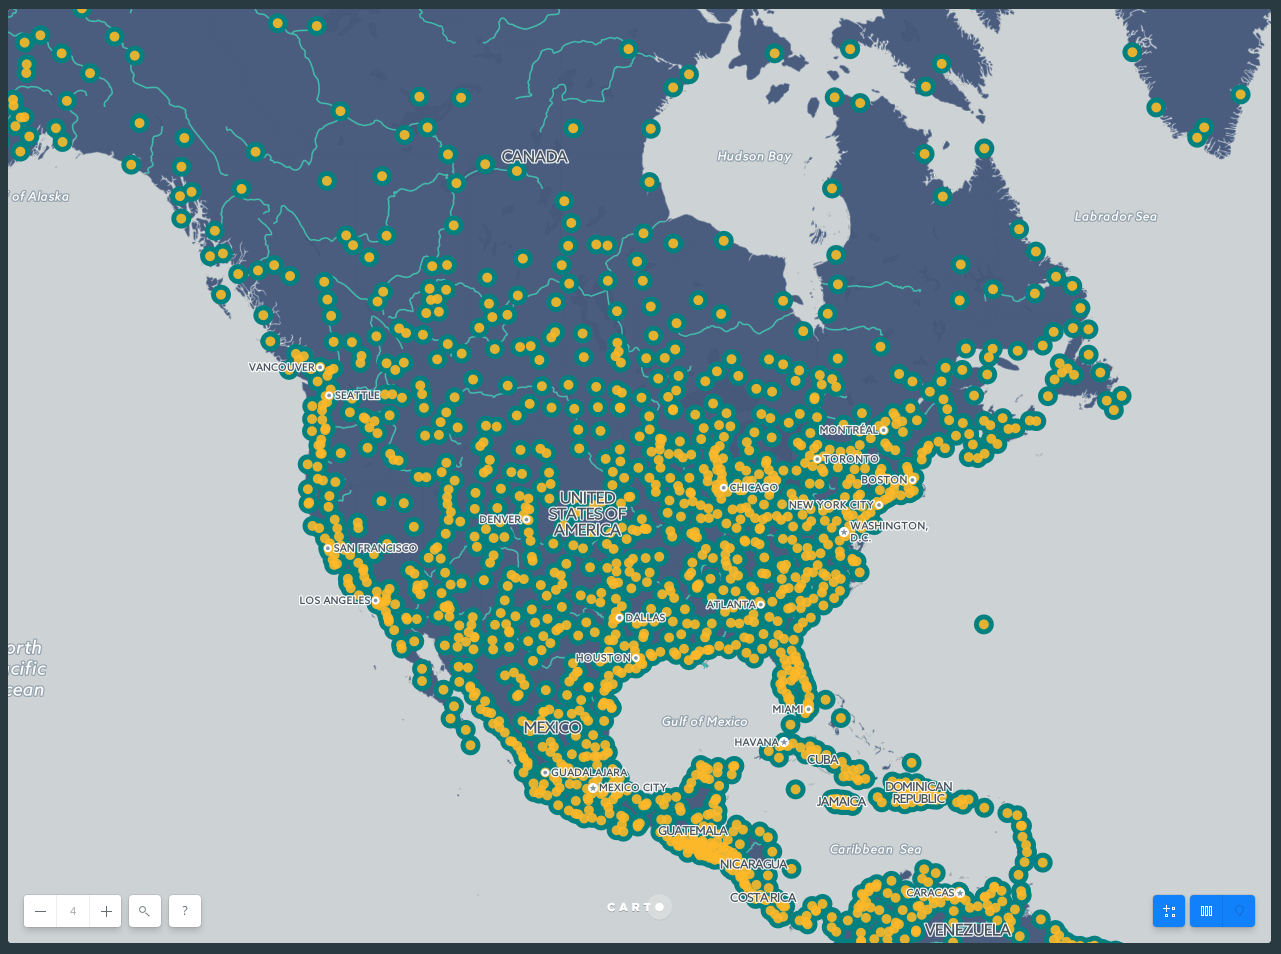
Note: Similar to how map layers are rendered, symbolizers are rendered from bottom to top. To see an example, view this live map which is using multiple symbolizers applied to point styles.
Color
CartoCSS accepts a variety of syntaxes for colors - HTML-style hex values, rgb, rgba, hsl, and hsla. It also supports the predefined HTML colors names, such as yellow and blue.
For instance, all the lines within this code are the same:
#line {
  line-color: #ff0;
  line-color: #ffff00;
  line-color: rgb(255, 255, 0);
  line-color: rgba(255, 255, 0, 1);
  line-color: hsl(100, 50%, 50%);
  line-color: hsla(100, 50%, 50%, 1);
  line-color: yellow;
}
Note: You can ramp transparency with color inside TurboCARTO by using RGBA instead of HEX colors.
Tip: Using HSL (hue, saturation, lightness) color values are often easier than rgb()values. CARTO also includes several color functions borrowed from Less, a CSS pre-processor:
/* lighten and darken colors */
lighten(#ace, 10%);
darken(#ace, 10%);

/* saturate and desaturate */
saturate(#550000, 10%);
desaturate(#00ff00, 10%);

/* increase or decrease the opacity of a color */
fadein(#fafafa, 10%);
fadeout(#fefefe, 14%);

/* spin rotates a color around the color wheel by degrees */
spin(#ff00ff, 10);

/* mix generates a color in between two other colors. */
mix(#fff, #000, 50%);
Each of above examples uses color variables, literal colors, or is the result of other functions operating on colors.
#layer {
  polygon-fill: lighten(#663300, 10%);
  polygon-opacity: 0.9;
  polygon-gamma: 0.5;
  line-color: #663300;
  line-width: 5;
  line-opacity: 0.7;
  line-comp-op: soft-light;
}
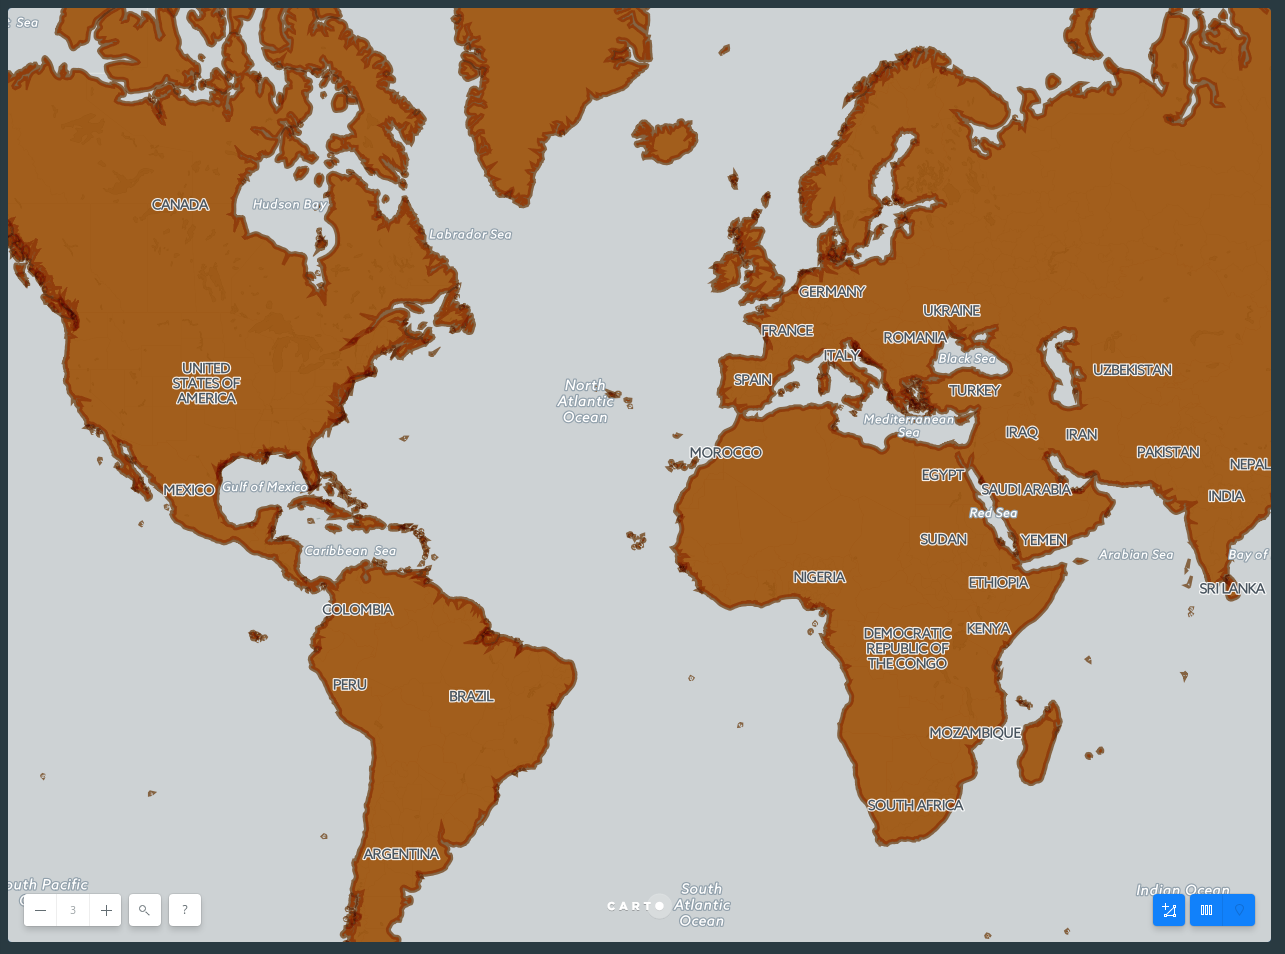
Note: Polygon-gamma is the amount of anti-aliasing applied to your polygon’s edges. Anti-aliasing reduces the jagged appearance of polygon edges, so that they appear more smooth. Values can range from 0 (no anti-aliasing, sharp edges) to 1 (fully anti-aliased).
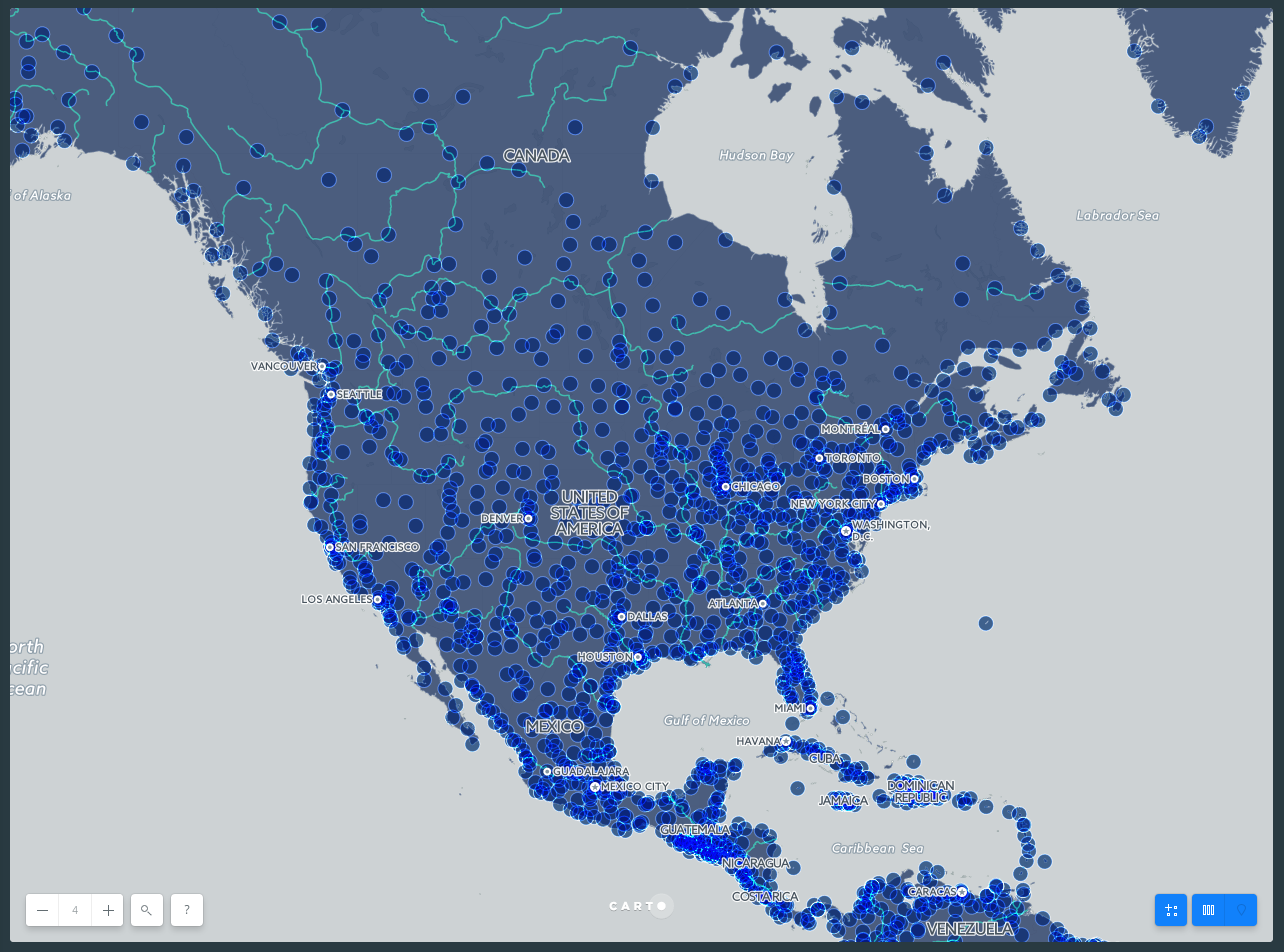
Composite operations
Composite operations style the way colors of overlapping geometries interact with each other. Similar to blend operations in Photoshop, these composite operations style the blend modes on your map’s data layers (not including the basemap). The main reason to use composite operations is to fine-tune how much some features in your map stand out compared to others. They are a great way to control your maps legibility.
Composite operations are blending modes for your map layers. They fall into two main categories: color and alpha, and can be applied to all non-basemap elements in your CARTO map by adding the comp-op value to your CartoCSS code.
Composite operations can be applied as an overall style effect, as shown in the following code:
comp-op: multiply;
Or, it can be applied to the specific symbolizer property, depending on the color blending operation you are trying to achieve. For example:
marker-comp-op: multiply;
polygon-comp-op: color-burn;
text-comp-op: screen;
- The layer (or text) that you choose the composite operation in is called the source
- Its composite operation is applied to each layer beneath, which are called destination layers. In CARTO, the source layer itself needs to have a color fill, but its composite operations apply to destination layers with color or texture fills (even raster layers)
Note: Any layers that appear above the source are unaffected by the comp-op value and are rendered normally.
#layer {
  marker-width: 7;
  marker-fill: #FFB927;
  marker-fill-opacity: 0.9;
  marker-allow-overlap: true;
  marker-line-width: 1;
  marker-line-color: #FFF;
  marker-line-opacity: 1;
  marker-comp-op: multiply;
}
CartoCSS Best Practices
While there are many ways to apply the same visual effects with CartoCSS properties, this section describes the most efficient and intuitive methods for structuring your CartoCSS syntax.
You can apply CartoCSS properties to the overall map style, or to specific map symbolizers (such as markers and points). Sometimes, applying properties to a symbolizer is not the most effective workflow for enhancing your overall map style. Other times, applying a style to the overall map is not rendered if there is no default value defined, and thus, not needed. For example, see how composite operations can be used for color blending, based on style or symbolizer.
When applying CartoCSS syntax, it helps to understand how values are applied to your map:
- The source is where the style is applied (either as a value or as a symbolizer property)
- The destination is the effect on the rest of the map, underneath the source
- Any layers that appear above the source are unaffected by the applied style and are rendered normally
-
Typically, you apply CartoCSS properties to different layers on a map. You can add multiple styles and values for each layer
- Alternatively, you can apply CartoCSS by nesting categories and values. Categories contain multiple values listed under the same, single category using brackets
{ }. This enables you visualize all of the styling elements applied to the overall map or to individual symbolizers, and avoid adding any redundant or unnecessary parameters. This is the suggested method if you are applying styles to a multi-scale map. - Check your styles at each zoom level and modify as needed to maintain proper information hierarchy.
#layer {
  marker-width: 7;
  marker-fill: #FFB927;
  marker-fill-opacity: 0.9;
  marker-allow-overlap: true;
  marker-line-width: 1;
  marker-line-color: #FFF;
  marker-line-opacity: 1;
  marker-comp-op: multiply;

  [zoom = 6]{ marker-width: 10; }
  [zoom >= 7]{ marker-width: 13; }
  [zoom >= 10]{ marker-width: 18; }
}
Note: Be mindful when applying styles to a map with multiple layers. Instead of applying an overall style to each map layer, apply the style to one layer on the map using this nested structure. For example, suppose you have a map with four layers, you can define zoom dependent styling as a nested value in one map layer. You do not have to go through each layer of the map to apply a zoom style. Using the nested structure allows you to apply all of the styling inside the brackets { }. This is a more efficient method of applying overall map styling.
When nested conditional styles apply to more than one case, the bottom-most styles take precedence. If the [zoom >= 10] code block above was listed above the [zoom >= 7] block, then markers at zoom 11 would be 13px.
Some handy tricks
2.5D/Pseudo 3D/extruded geometries
We could achieve a 3D-looking map using building CartoCSS properties:
#layer {
  /* global */
  polygon-opacity: 0.7;
  line-width: 1;
  line-color: black;
  line-opacity: 1;

  building-fill:#fcde9c;
  building-fill-opacity: 1;
  building-height: [pop2005]/ 2500 ;

  /* categories */
  [pop_norm > 190.0] {
    building-fill: #f58670;
  }
  [pop_norm > 650] {
    building-fill: #e34f6f;
  }
  [pop_norm > 1401] {
    building-fill: #d72d7c;
  }
  [pop_norm > 4500] {
    building-fill: #7c1d6f;
  }
}
See an example here.
When using this kind of properties, some features won’t fit into a single tile, and we’ll need to use this trick in order to render geometries that go beyond their tile. This is also useful for labels that don’t fit in a single tile:
Map{
  buffer-size: 512;
}
SQL query to calculate breaks in your data
Sometimes, we’d need to calculate the breaks in a classification in order to generate a choropleth visualization. TurboCARTO solves this easily, but you may encounter other situations where this query will help:
WITH data as (SELECT
  *,
  pop2005/area as pop_norm
FROM
  world_borders
WHERE
  area > 0
)
select unnest(CDB_QuantileBins(array_agg(pop_norm),4)) from data
More here.