Create Travel/Distance Buffers
Creates buffer polygons according to the parameters set by the user.
This guide describes how to apply the Create Travel or Distance Buffers analysis to create buffers of distance (in meters, kilometers, miles), or of travel time, via a medium (walking, driving). The analysis creates an “area of influence”, or “isoline”, of a specified distance or time from any geographic point, polygon or line.
For a dataset with polygon geometries, the centroid of the polygon is used to create an area of influence with the provided distance.
An isoline is any line on a map that shares a common value. It uses an approximation of isoline functions to create straight-line travel or distance buffers from the origin point, measured by distance (isodistance) or time (isochrone).
For isochrones analyisis, it is highly recommended to materialize analysis results to avoid undesired quota consumption, especially in combination with Sync Tables, since synchronizations could trigger un-intended analysis re-run operations.
This guide focuses specifically on the distance functionality (isodistance) with the Create Travel or Distance Buffers analysis.
Travel or distance buffers
For this guide, the Create Travel or Distance Buffers analysis is applied to view the impact of environmental equity assessment in a city. Specifically, we will use the Toxic Release Inventory (TRI) data from the EPA, and census tract data for Des Moines, Iowa.
The result of the analysis will help us understand whether a preliminary overlap, or “area of influence”, can be observed between more populated census tracts and affected regions around the TRI facilities.
-
Import the template .carto file packaged from “Download resources” of this guide and create the map. Builder opens with TRI point data as the first map layer, and Census Tract polygons as the second map layer.
Click on “Download resources” from this guide to download the zip file to your local machine. Extract the zip file to view the .carto file(s) used for this guide.
-
From the TRI map layer, click the ANALYSIS tab.
-
Click ADD ANALYSIS and apply the Create Travel or Distance Buffers option. This is the input layer used for creating the travel or distance buffers.
-
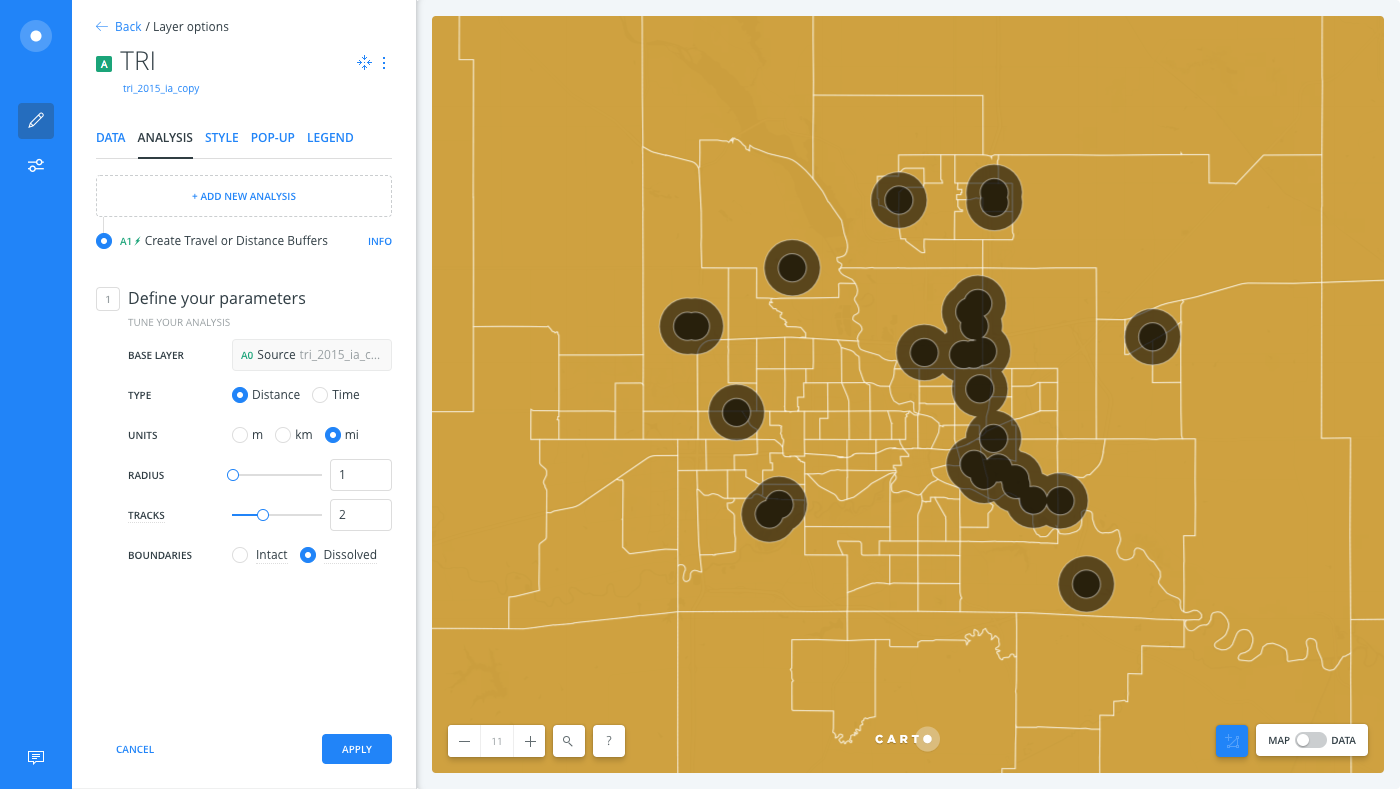
Select the following parameters for the analysis:
- Distance as the TYPE
- mi, for miles of UNITS
- 1 as the RADIUS
- 2 as the TRACTS. This parameter creates an isoline within the created buffer, dividing the radius equally by the number of tracts.
- Dissolved as the BOUNDARIES. This parameter enables you to define the polygon outlines as intact (keeps the original boundaries intact for overlapping buffers), or dissolved (dissolves the boundaries of overlapping buffers).
The following image displays these parameters selected for the TRI layer.
-
Click APPLY to create the travel or distance buffers.
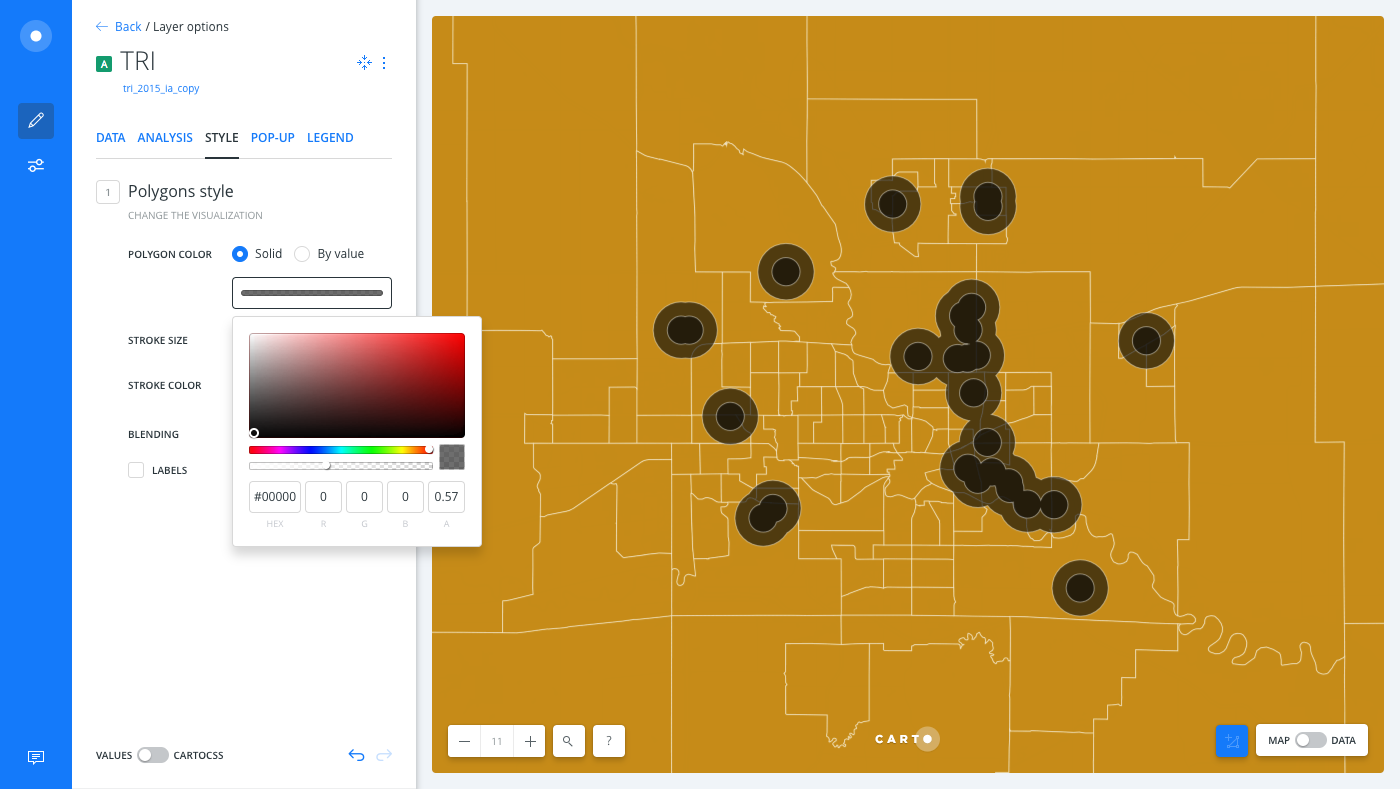
The map displays the created travel or distance buffers of 1 mile radius, demarcated with an isoline at 0.5 mile.
-
Style the travel or distance buffers with a dark color and a transparent opacity, to better visualize the results.
Defining Context
Since we are interested in determining the equity assessment for Des Moines, it is important to visualize the population density that is affected within the area of influence of the TRIs. The Census Tract layer can be styled to visually depict the areas with more density.
-
From the LAYERS list in Builder, click the Census Tract layer.
-
Click the STYLE tab.
-
Click the By Value option for POLYGON COLOR.
-
Select
pop2010sqm, a number column from your map layer, which enables you to style the map layer with a Sequential or Diverging color scheme.
CHEATSHEET: Color Schemes
Choosing the right colors for your data aids storytelling, engages the map reader, and visually guides the viewer to uncover interesting patterns that may otherwise be missed. When styling by value, different types of color schemes appear, based on the selected data column from your map layer. Builder provides you with CARTOColor and ColorBrewer schemes, and enables you to customize your own color schemes.
- Sequential Scheme: Color schemes that use variations in lightness make these ideal for displaying orderable, or numeric data. The variations progress from low to high, using colors that range from light to dark (or vice versa).
- Qualitative Scheme: Color schemes that demonstrate categorical differences in qualitative data, which use different hues, with consistent steps in lightness and saturation.
- Diverging Scheme: Color schemes that highlight values above and below an interesting mid-point in quantitative data. The middle color is assigned to the critical value, with two sequential type palettes at either end, assigned to values above or below.
The color scheme picker appears, from which you can select a color scheme for your data.
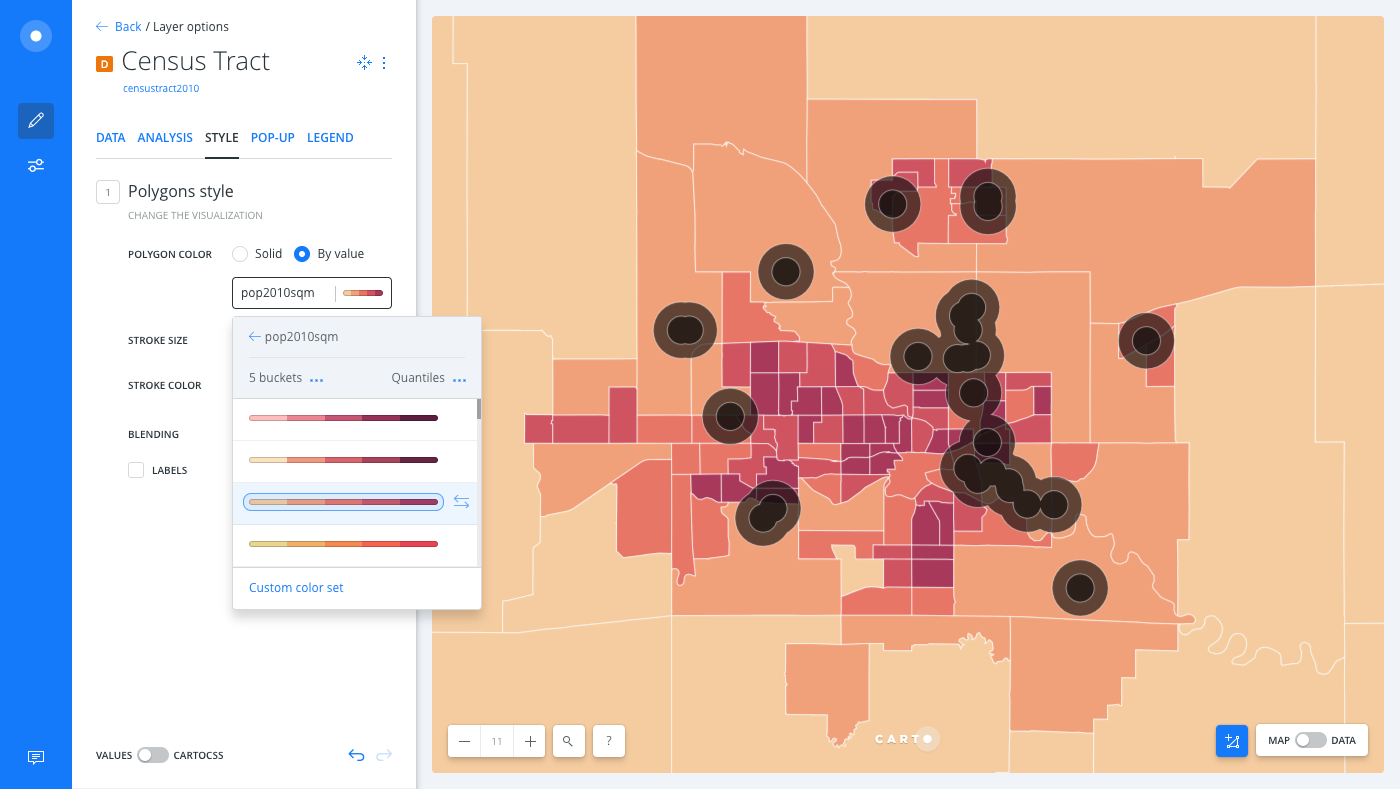
Notice that the overlap does seem to be visually strong around the travel or distance buffers, which can be further studied and verified by applying other analyses with Builder. For example, apply the Detect outliers and clusters analysis to explore significant patterns in your data.
Download the final .carto file from the “Download resources” of this guide, and explore the styling and basemap changes that were applied.
Limits
The Create Travel or Distance Buffers analysis has a timeout limit of 5 minutes and a row limit that depends on the BOUNDARIES option selected.
| Boundaries type | Row Limit | Time Limit |
|---|---|---|
| Intact | 1000000 | 5 min |
| Dissolved | 100000 | 5 min |
External Resources
If you are interested in using the underlying functions in the SQL view of Builder, view the ST_Buffer PostGIS documentation.