Geocoding with Builder using City and Admin Region Names
Apply the Geocode analysis to convert city and administrative region data into geometries with CARTO Builder.
Why do you need this?
-
 You have a dataset with city or admin region names that you need to visualize.
 -
 You are a Builder user.
Types of Geocoding
Check out this article to learn about all the different ways you can geocode your data using CARTO.
To learn more about our different geocoders that we use in CARTO, check out this article.
See the Preparing and Formatting Data Guide for tips about prepping data before it is imported.
Objective
For this guide, let’s apply the Geocode analysis in order to visualize the administrative boundaries and cities where stores are located in Mexico. We will use the Administrative Regions and Cities options to geocode our data.
Geocode by Administrative Region
Let’s create a map and visualize the administrative regions of Mexico. When geocoding by admin regions, your dataset must contain a single column with region data in order to generate location points.
- Import the template .carto file, packaged from “Download resources” of this guide and create the map.
Click on “Download resources” from this guide to download the zip file to your local machine. Extract the zip file to view the files used for this guide.
Builder opens with the States of Mexico as the first map layer and Store Locations as the second map layer. Both layers indicate that there is no geometry and provides a shortcut to apply the GEOCODE analysis.
-
From the States of Mexico map layer, click GEOCODE.
The ANALYSIS tab opens and Geocode is automatically selected.
-
Switch to the Data View, you will notice that
the_geomcolumn contains null values, even though the connected dataset has values.The Data View and Map View appear as buttons on your map visualization when a map layer is selected. Click to switch between viewing your connected dataset as a table, or show the map view of your data.
Note the columns
name_0(which indicates the country name as Mexico) andname_1(which contain the administrative regions that we are looking for).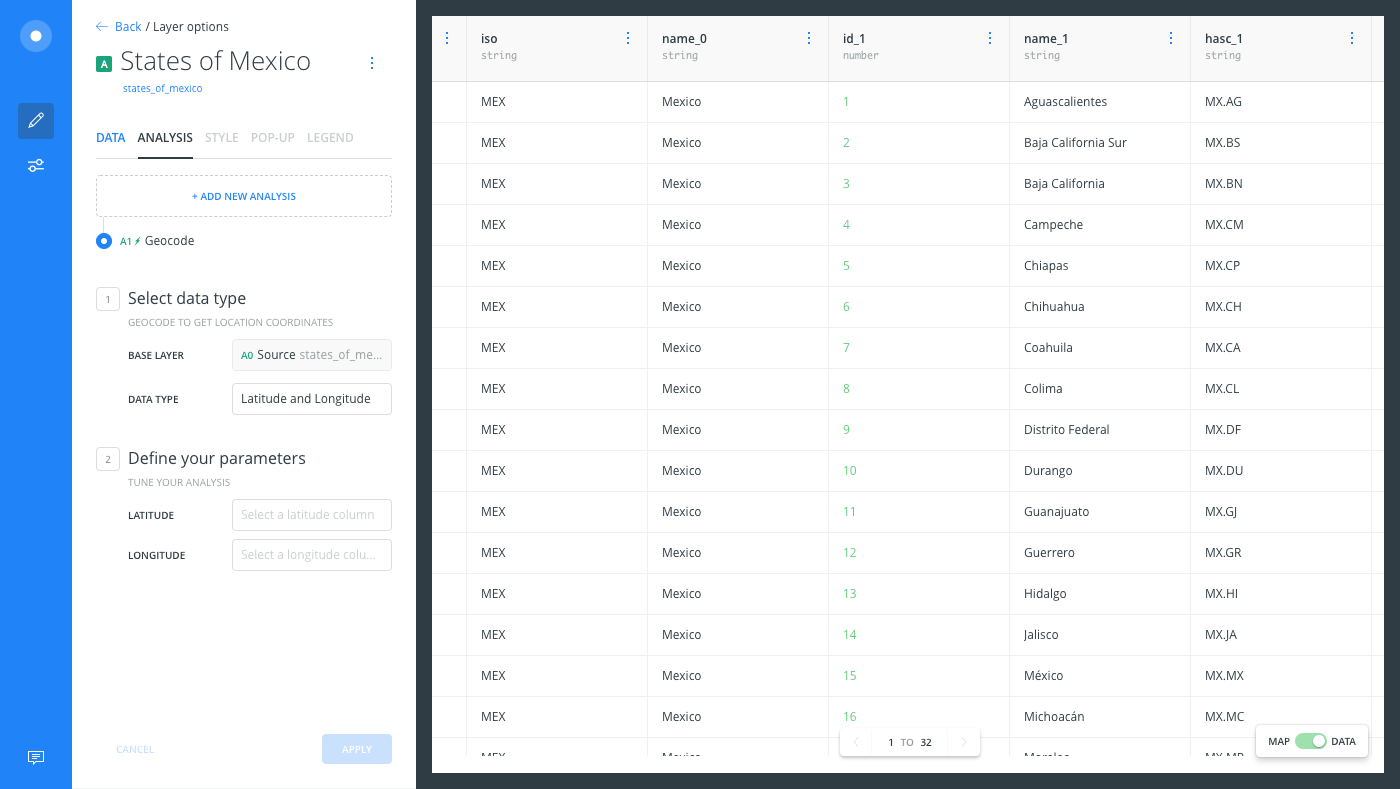
-
For best practices, let’s rename those columns directly from the Data View:
- Double-click on the
name_0column and rename it tocountry. - Double-click on the
name_1column and rename itregion.
You will need to manually refresh your browser, or go back to the LAYERS list and select the layer again, in order to visualize any renamed columns.
- Double-click on the
-
From the ANALYSIS tab, change the geocode TYPE to Administrative Regions and apply the following parameters:
- For the ADMINISTRATIVE REGIONS parameter, select the
regioncolumn from the connected dataset. - Click the checkbox next to COUNTRY and select the
countrycolumn from the connected dataset. Alternatively, if you did not have country data in your dataset, you can manually type a column to add it.
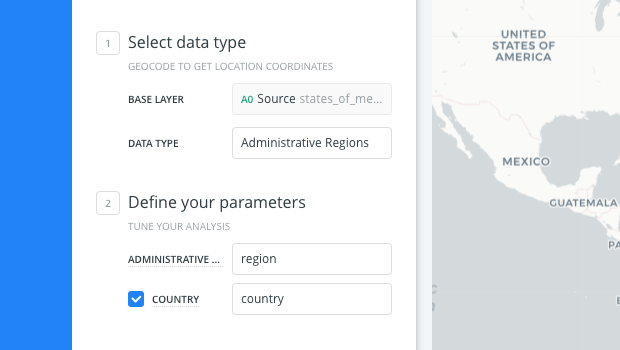
- Click APPLY to run the analysis.
- For the ADMINISTRATIVE REGIONS parameter, select the
-
To visualize the analysis results from your Map View,
- click Center map on layer icon.
The states of Mexico appear as administrative regions.
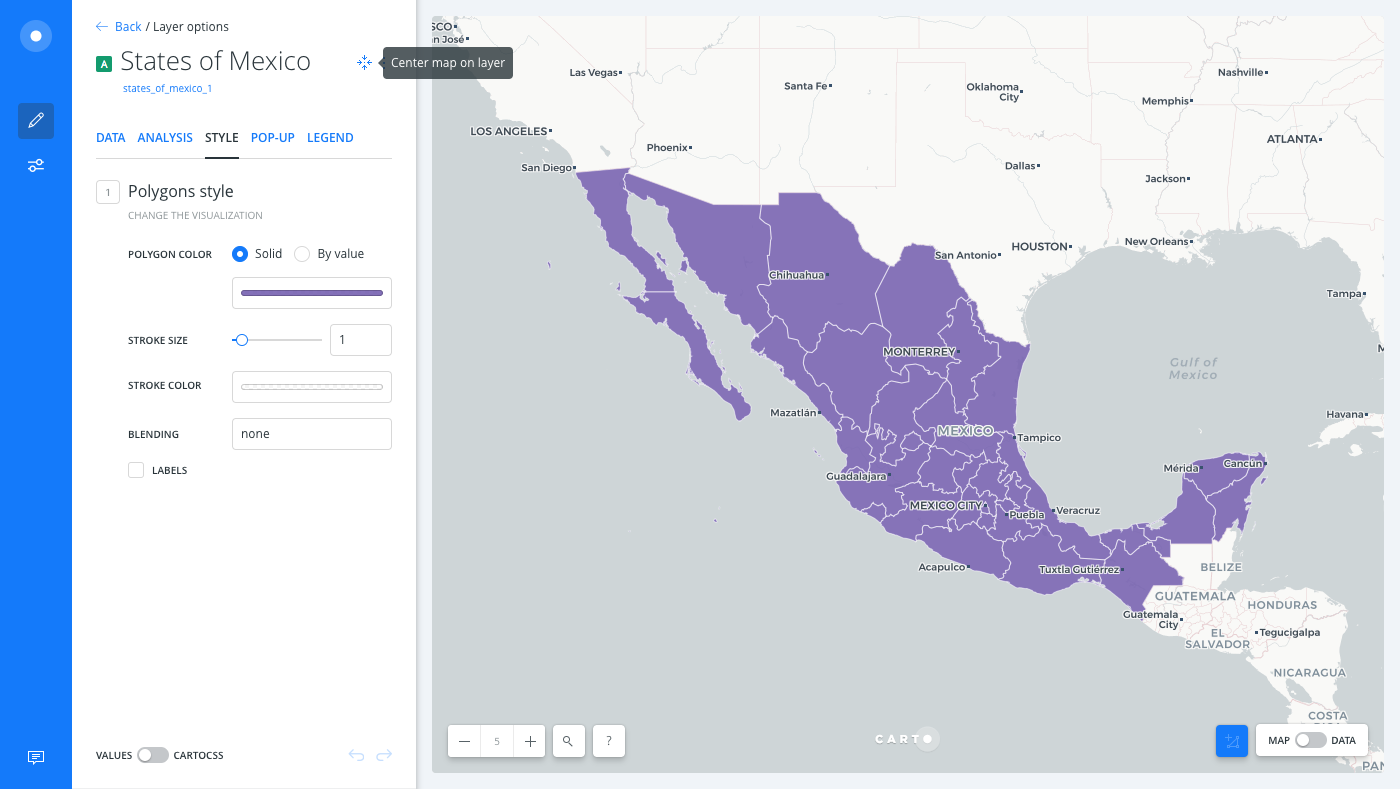
-
Click the Data View to see how the specified admin regions were converted to polygons in
the_geomcolumn.
Geocode by Cities
The map includes a second layer of store locations in Mexico, which Builder cannot find geometries for. Let’s geocode this layer by city names in order to visualize these locations. When geocoding by cities, your dataset must contain a single column with city name values. Additional options allow you to specify the admin region or the country for more accurate data.
-
Navigate back to the LAYERS list of CARTO Builder.
-
From the Store Locations map layer, click GEOCODE.
The ANALYSIS tab opens and Geocode is automatically selected.
-
Switch to the Data View, you will notice that
the_geomcolumn contains null values, even though the connected dataset has city names in thenamecolumn. -
For best practices, rename the
namecolumn tocitydirectly from the Data View. -
Fix the spelling for the “Mazatlan” values in the city column.
If you sort the column, you will notice that there are two spellings of the city
Mazatlan. Edit the cell value for one of them for consistent spelling. This ensures that accurate data is being plotted for that city value. For details about editing data, view the Add Rows and Columns Guide.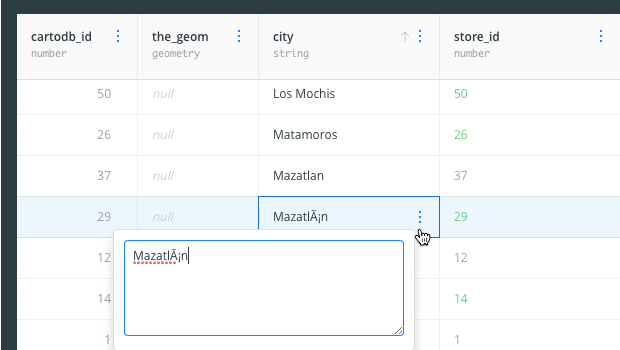
-
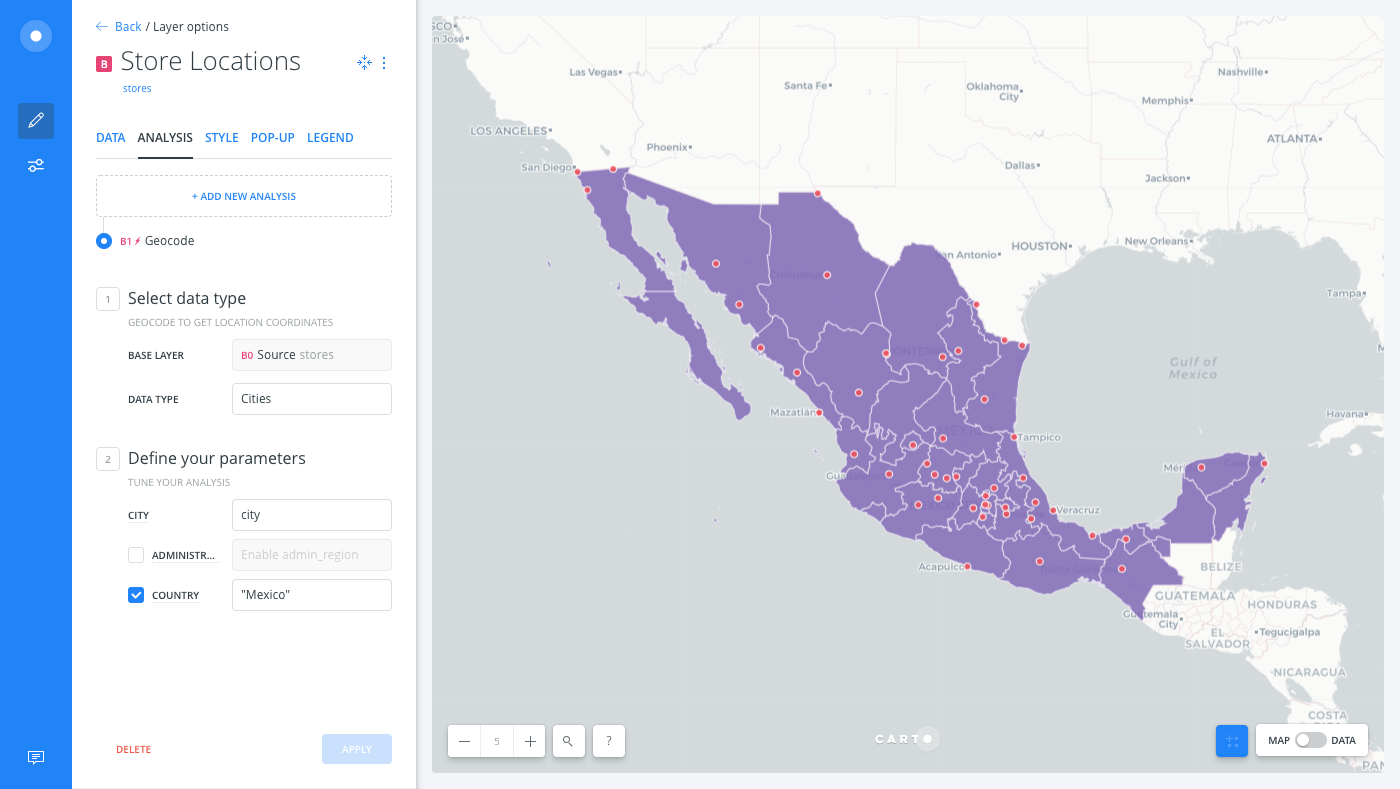
From the ANALYSIS tab, change the geocode TYPE to Cities and apply the following parameters:
- For the CITY parameter, select the
citycolumn from the connected dataset. -
Click the checkbox next to COUNTRY. Since the connected dataset does not have a country column, manually type and select
Mexicoto add it.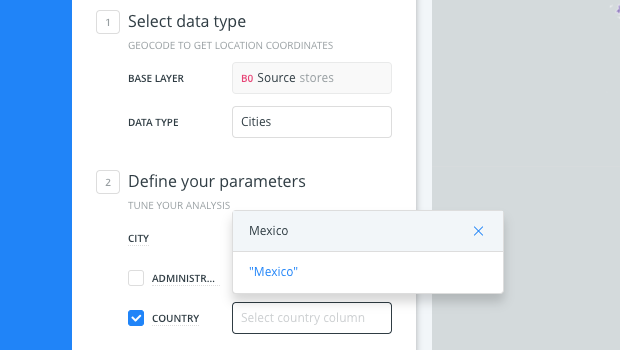
- Click APPLY to run the analysis.
The city names were plotted into store locations in Mexico. Try adding some widgets to explore your data.
- For the CITY parameter, select the
-
Click the Data View to see how the specified cities were converted into geometry coordinates in the
the_geomcolumn.
External Resources
If you are using the Data Services API with CARTO Engine to manage your data, view the City Geocoder and the Level-1 Administrative Regions Geocoder documentation.