Getting Started with CARTO Builder
Getting started with CARTO Builder.
CARTO Builder is a web-based drag and drop location intelligence tool for analysts and business users to discover and predict key insights from location data. This guide describes how to get started with Builder.
Join and watch any of our webinars to learn about CARTO, or view our Resource Center to read about how location data is changing the way companies do business.
Sign up for a CARTO Account
When you sign up and login to CARTO, the CARTO toolbar displays options enabling you to navigate around the dashboard.
Import Data
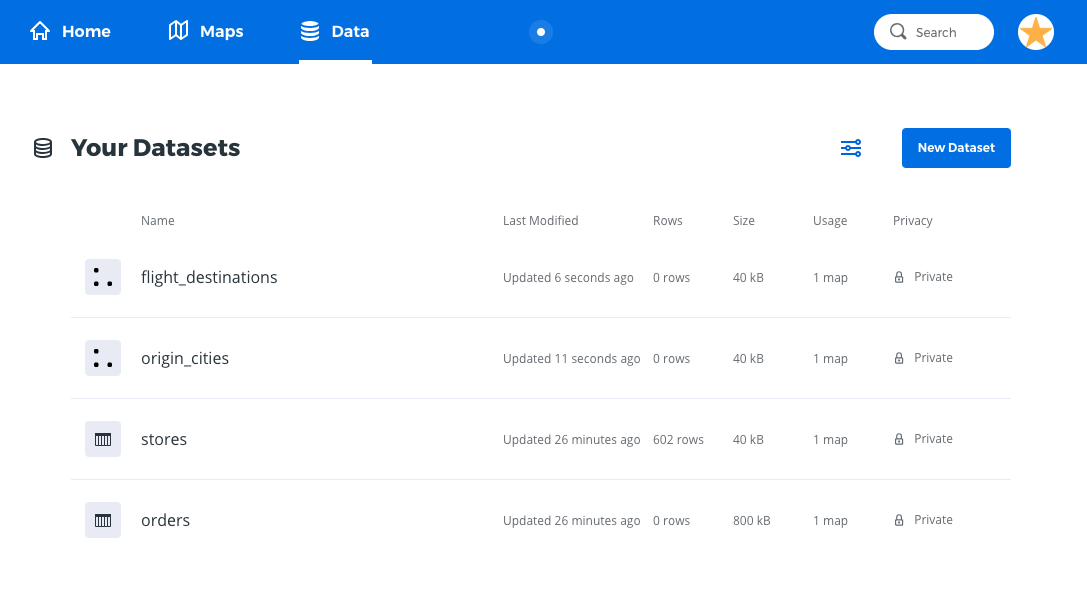
Your Data page enables you to add and manage connected data resources in CARTO. You can apply unique privacy and metadata options for data that is separate from the map that it is connected to. There is even a shortcut to create a map directly from a selected dataset.
The easiest way to import data to your account is to drag and drop a data file directly to Your datasets dashboard. For details, see Quick Data Import.
- From your Data page in CARTO, click New Dataset.
You can upload your dataset using any of the supported geospatial data formats, connect to a public dataset from the Data Library, or create an empty dataset.
Have you identified a data resource for your map?
- From the Connect Dataset options, connect to a public dataset from the Data Library. For example, search for populatioin and select the
ne_10m_populated_places_simpledataset, which is a publicly available cultural dataset that contains world population data. - If you are an Enterprise user, access advanced location-based datasets directly from the Data Observatory catalog.
- Locate external geospatial and mappable resources that can be imported to CARTO. If you are syncing your dataset to an external resource, you can easily sync real-time data during the import process.
Once data is imported, each dataset icon displays the geometry behind the data as either a point, line, or polygon, and indicates whether or not the dataset is synced to an external resource.
- You can manage your data from the dataset name menu option, add rows and columns, change the data type for columns, view table metadata in the SQL view, or export the dataset.
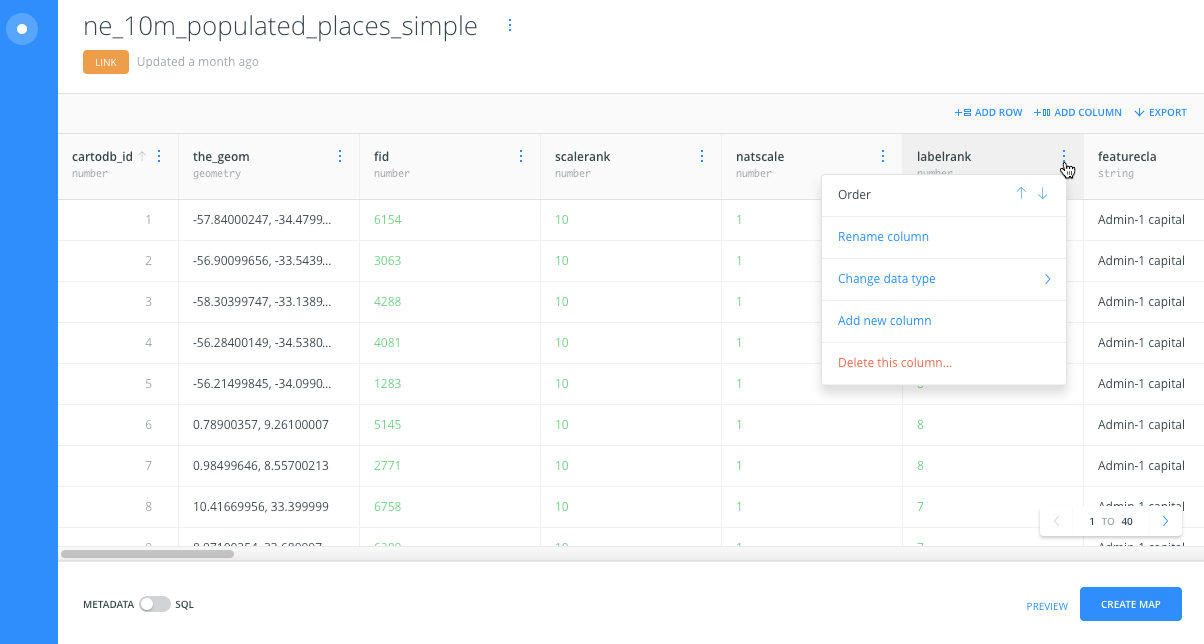
the_geom column. This column displays the latitude and longitude in a single projection, using the WGS84 cartographic method. See this section for information about storing geospatial data with other projections.
-
Click PREVIEW to display a visualization of your data.
-
Click CREATE MAP to create a map from the dataset.
The dataset appears as the first map layer in Builder. You can add additional layers, or click on the map layer to apply styling and analysis features.
Alternatively, you can create a map directly from your Maps page.
Create a Map
Your Maps page enables you to create and manage maps in CARTO. You can connect a dataset directly through the create map process.
If someone has shared a CARTO map with you, you can drag and drop the .carto file to your Maps page and import the map to your account. You will be able to see all of the map layers, data, and styling applied. For details, see Downloading and Importing CARTO Maps.
-
From your Maps page, click New Map.
The Add datasets options appear, where you can select a dataset, view the Connect Dataset options, view the Data Library, or create an empty dataset.
-
After selecting a dataset, click CREATE MAP.
The selected dataset appears as the first map layer in Builder. The LAYERS list appears by default, displaying the basemap and map layer that are the backbone for rendering your visualization. You can add additional layers, or click on the map layer to apply styling and analysis features.
Builder contains many features that guide you through the process of creating a map and selecting how your data appears. Use the following task list as guide for some of the main CARTO Builder features:
- Change the basemap.
- Add map layers.
- Apply custom styling with the STYLE tab.
- Apply an analysis workflow[analysis workflow]() to a selected map layer, in order to gain more insights about your data.
- Enable pop-up information windows to display when a viewer clicks, or hovers their mouse over, select data on your map.
- Enable map legends to display symbols and text that describe your map data.
- Add embedded widgets to your Map View and interact with your map on the fly, without modifying your actual data. For details, see Exploring Data with Widgets.
- Control the visible features that appear on your published map with the Map Options (located from the Builder toolbar).
Publish and Share your Map
Once you visualize and publish a map, you can get a link to share the map or embed it to a website or blog. For details, see Publishing and Sharing Maps.