Intro to TurboCARTO
Describes how TurboCARTO works as a CartoCSS preprocessor to apply styling to thematic maps.
Thematic maps highlight a specific topic, or theme of information, such as demographic data, traffic flows, or weather patterns. Creating a thematic map using traditional CartoCSS often requires complex rules related to styling properties. TurboCARTO removes this complexity by reducing thematic map styling into a single line of code.
This guide describes how TurboCARTO ramps are applied to your data, in order to style a variety of thematic maps based on your geometry.
TurboCARTO Ramps
TurboCARTO applies ramps to CartoCSS properties. Ramps define how features are drawn on a map, depending on your data’s geometry (point, line, or polygon), and the type of thematic map you are creating.
TurboCARTO ramps follow the standard syntax:
#layer {
  property: ramp([attribute], (values), (filters), mapping);
}
The following parameters are applied in the syntax.
| TurboCARTO Syntax | Description |
|---|---|
property |
The CartoCSS styling property being applied (line-width, line-color, polygon-fill, marker-fill, and so on). |
ramp |
Indicates that TurboCARTO syntax is applied to the layer. |
attribute |
Indicates the selected column from your dataset. |
values |
Indicates how the attributes are styled (by color, by size, and so on). This is based on the data type (numeric or qualitative) of the column that is selected. |
filters |
Defines different values, or a range of values, to filter data. |
mapping |
Defines the category or classification method (and number of buckets) for how map styling is applied. Also includes symbols to define advanced mapping parameters (=,>=,<=,>,<). |
TurboCARTO in Builder
When you create a thematic map in Builder (by styling your map layer with string, numeric, or boolean data columns), the default CartoCSS styling is processed behind the scenes; using TurboCARTO. Whether you use the graphical user interface options from the STYLE tab, or if any values in your data are changed, map styling is automatically updated.
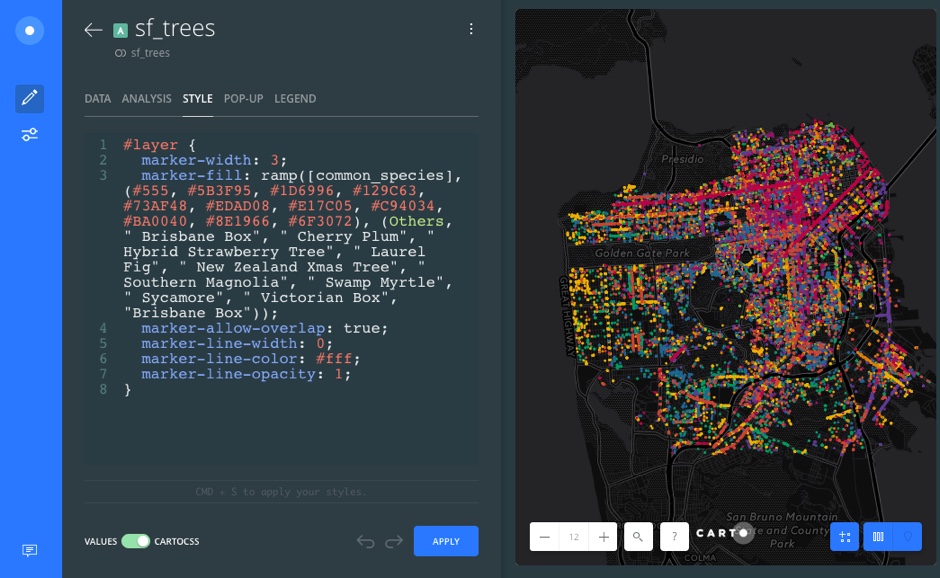
To understand how TurboCARTO is applied to your data, view the CartoCSS syntax for your map layer. For example, the following map displays common tree species in San Francisco, California. Each point on the map represents an individual tree location. Each tree is assigned a unique color, based on its species (string column) with TurboCARTO. Since we are modifying the color of each point based on the common_species attribute, TurboCARTO is applied to the CartoCSS styling property marker-fill.
Size by Value
For numeric column attributes in line geometry map layers, TurboCARTO syntax is applied to define the classification method, and the number of buckets.
For example, the line-width CartoCSS styling is applied, where the selected numeric column attribute is traffic_flow. Each feature of line-width varies (using the range of 1 for low values, and 10px for high values), based on the classification method (quantiles), and the (5) class breaks.
#layer {
  line-width: ramp([traffic_flow], range(1, 10), quantiles(5));
}
Color by Value
For numeric column attributes in polygon geometry map layers, TurboCARTO syntax is applied to define the sequential color scheme, based the classification method and the number of buckets.
For example, the polygon-fill CartoCSS styling is applied, where the values in the numeric column attribute percent_high_school, are applied to each polygon using a sequential color scheme, based on the jenks classification method, and 7 class breaks.
#layer {
  polygon-fill: ramp([percent_high_school], (#ffc6c4, #f4a3a8, #e38191, #cc607d, #ad466c, #8b3058, #672044), jenks(7));
}
Additionally, you can apply string column attributes in point geometry map layers. For example, the marker-fill CartoCSS styling is applied, where the selected column attribute complaint, uses a qualitative color scheme, over 5 category values.
#layer {
  marker-fill: ramp([complaint], (#5B3F95, #1D6996, #129C63, #73AF48, #EDAD08), category(5));
}
Color Schemes in TurboCARTO
In TurboCARTO, you can define a custom color scheme, or use a predefined CARTOColor or ColorBrewer scheme, by modifying the values parameter.
Custom Color Scheme
To apply a custom color scheme, replace the default hex values with a custom value. The following example assigns a unique marker-fill to each point, based on the room_type, using the named color shortcuts for red, green and blue.
#layer {
  marker-fill: ramp([room_type], (red, green, blue), category(3));
}
CartoColors and ColorBrewer
To use a CARTOColor or ColorBrewer scheme with TurboCARTO, define where the origin of the scheme with the cartocolor or colorbrewer property, and the defined color scheme.
View the list of CARTOColor schemes and ColorBrewer schemes.
The type of CARTOColor or ColorBrewer scheme applied depends on your data. If you are mapping numeric data, use a sequential or diverging color scheme. If you are mapping categorical data, use a qualitative scheme.
CHEATSHEET: Color Schemes
Choosing the right colors for your data aids storytelling, engages the map reader, and visually guides the viewer to uncover interesting patterns that may otherwise be missed. When styling by value, different types of color schemes appear, based on the selected data column from your map layer. Builder provides you with CARTOColor and ColorBrewer schemes, and enables you to customize your own color schemes.
- Sequential Scheme: Color schemes that use variations in lightness make these ideal for displaying orderable, or numeric data. The variations progress from low to high, using colors that range from light to dark (or vice versa).
- Qualitative Scheme: Color schemes that demonstrate categorical differences in qualitative data, which use different hues, with consistent steps in lightness and saturation.
- Diverging Scheme: Color schemes that highlight values above and below an interesting mid-point in quantitative data. The middle color is assigned to the critical value, with two sequential type palettes at either end, assigned to values above or below.
The following example assigns each feature a unique line-color, based on its value in the route_id field, using a qualitative CARTOColor scheme (Bold). You can substitute Bold with any other qualitative scheme from either CARTOColors or ColorBrewer.
#layer {
  line-color: ramp([route_id], cartocolor(Bold), category(10));
}
In the following example, each polygon is assigned a fill color based on the percent of vacant housing units; using quantiles classification with 7 buckets. Since we want to show vacant housing along a spectrum of high to low, we are using a ColorBrewer sequential scheme (BuPu).
#layer {
  polygon-fill: ramp([percent_vacant_housing], colorbrewer(BuPu), quantiles(7));
}
Alternatively, you can use a CARTOColor sequential scheme to represent the same data. Note how the value and the defined color scheme changed from colorbrewer(BuPu) to cartocolor(BluGrn).
#layer {
  polygon-fill: ramp([percent_vacant_housing], cartocolor(BluGrn), quantiles(7));
}
View examples of how traditional CartoCSS appears with TurboCARTO syntax applied.