How to connect to your CARTO database from Power BI
Connecting to your CARTO database from Power BI.
This tutorial demonstrates how to connect with your CARTO database using an ODBC connection in Power BI. We strongly recommend reading the Direct SQL Connection article to learn more about that feature before reading this one.
Introduction
With the Direct SQL Connection feature you can use the datasets in your CARTO account for your Power BI reports and dashboards.
Tested environments
- Windows 10 64 bits
- Power BI Desktop Version: 2.79.5768.1082 64-bit (March 2020)
Configuration
-
The steps for adding an ODBC System DSN to CARTO’s database can be followed in this article. Important: the database name in the DSN configuration must be empty. If a database name is included, cross-reference errors will incur while trying to access data.
-
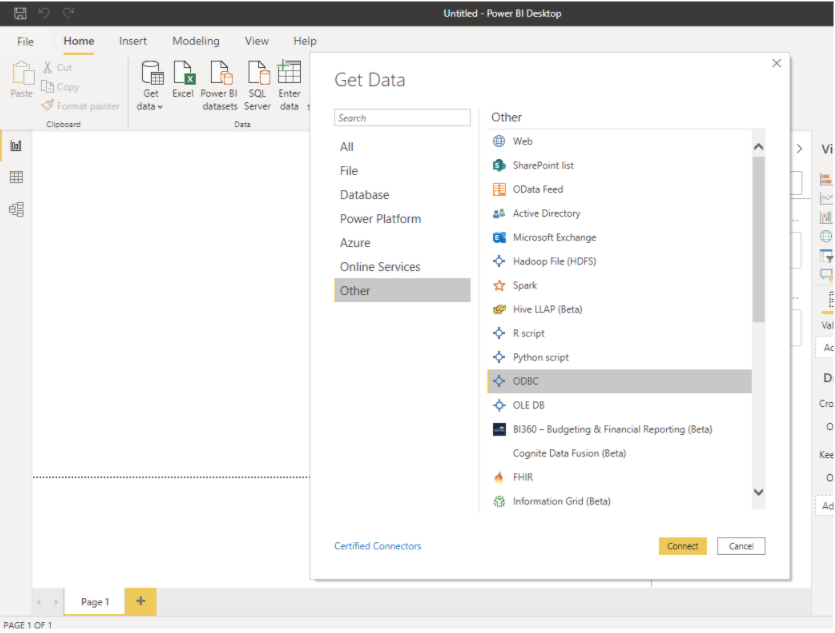
Open Power BI Desktop and select Get Data..Other/ODBC. Click on the “Connect” button (you can also use the native PostgreSQL connector if you are not using TLS certificates for client authentication, but Power BI does not handle geometry columns correctly).
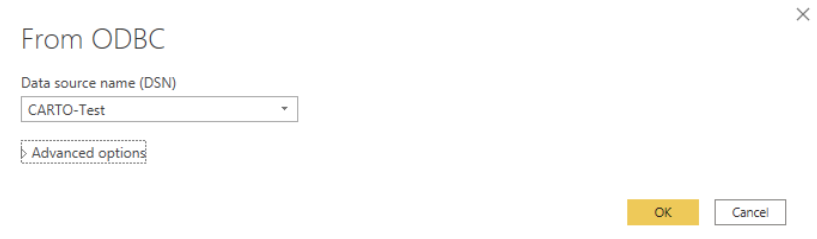
- Select the DSN created in the previous step and click the “OK” button
-
Click “Connect” and specify the CARTO username and password (= the CARTO API Key). Power BI only asks for username and password the first time a DSN is used and does not use the credentials stored in the DSN. If, for any reason, we want to change the password (API Key), we will need to add a new DSN or rename the existing one, so Power BI asks again for credentials.
-
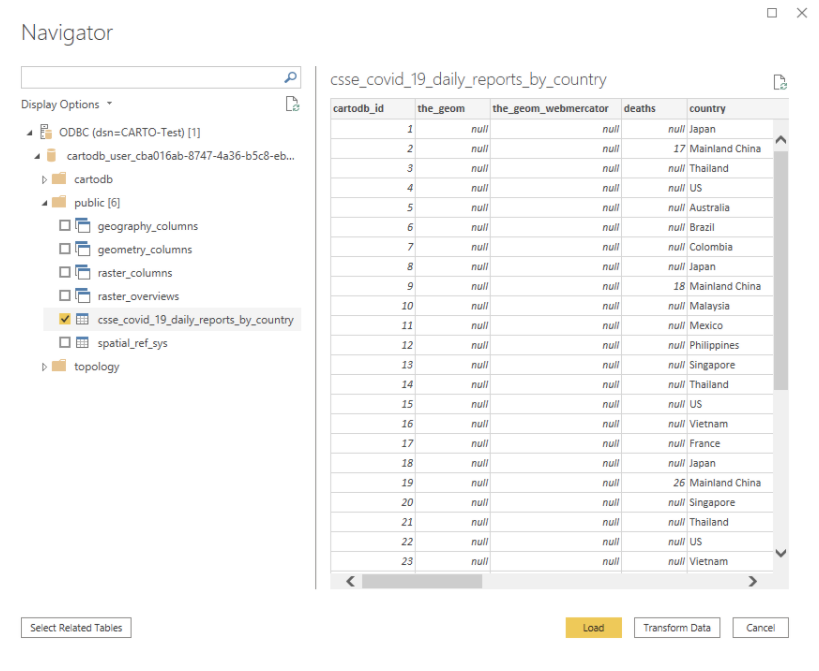
In the Navigator window, select the database schema corresponding to your CARTO username and check the table(s) that you want to use in your dashboard. When you select a table, you will see a preview on the right. Then click on the “Load” button.
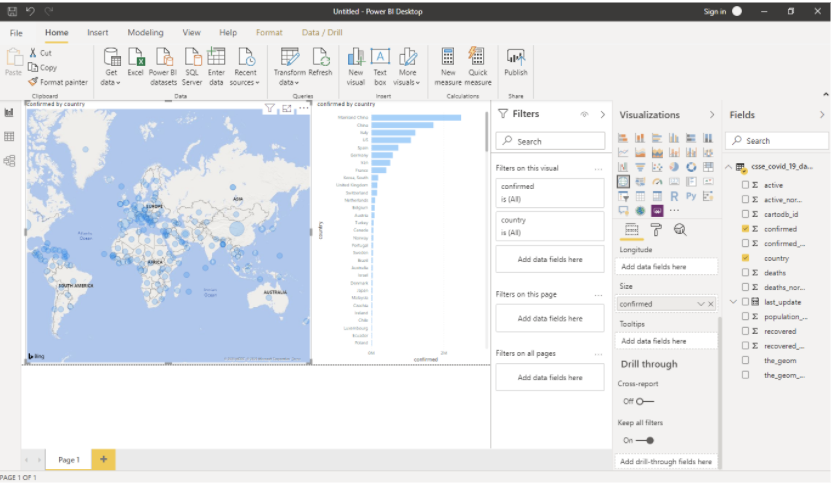
- In the “Fields” panel, select the field(s) that you want to use in your dashboard and drag them to the dashboard page. If you select a field that can be geocoded (i.e. a country field), a map visualization will be created by default.