Coastal Vignettes and Water Lines
How to create coastal vignettes and water lines with styling and analysis methods in CARTO Builder.
 Map Links: Vignettes // Water Lines
About
Coastal vignettes (left) and water lines (right) are two artistic effects used by cartographers to promote better figure-ground between land and water features.
Using a polygon layer, the Create Travel/Distance Buffers analysis, and some styling tricks, you can create both effects using CARTO Builder with just a few steps!
Steps
Each step to create this map is illustrated with a gif and accompanying tips and design decisions.
- Add Data
- Create Areas of Influence
- Reorder and Name Layers
- Style Land Polygons
- Style 1: Coastal Vignettes
- Style 2: Water Lines
- BONUS: Dynamic analysis
Add Data
These maps use a 1:5M polygon of the state of Hawaii from the US Census Bureau.
Tip: When choosing your source geometry, be sure to consider the amount of generelization that is appropriate for your viewing scale, map extent, and how that relates to the amount of detail that is in the output Areas of Influence.

Create Areas of Influence
Click on layer A: hawaii to access the analysis tab. Choose to run the “Area of influence” analysis on the layer.
We used the following parameters:
- Type: Distance
- Units: km
- Radius: 12
- Tracts: 4
Tip: adjust these settings for your map based on your viewing scale and map extent.

Reorder and Name Layers
To design the final maps, we want the AOI polygons underneath the original polygon for Hawaii.
To separate the two, simply drag A1 out from A and place under. Now our AOIs are Layer B. To keep track of the steps, rename B to something more meaningful.
tip: Once an analysis is complete, the result becomes an Analysis Node of the original layer. In the layer panel, you will see our original layer A: hawaii with analysis node A1: AOI.

Style Land Polygons
By clicking on layer A, we can access the layer’s styling properties. Here, we set our polygon fill and stroke color to #97ba7a.

Coastal Vignettes
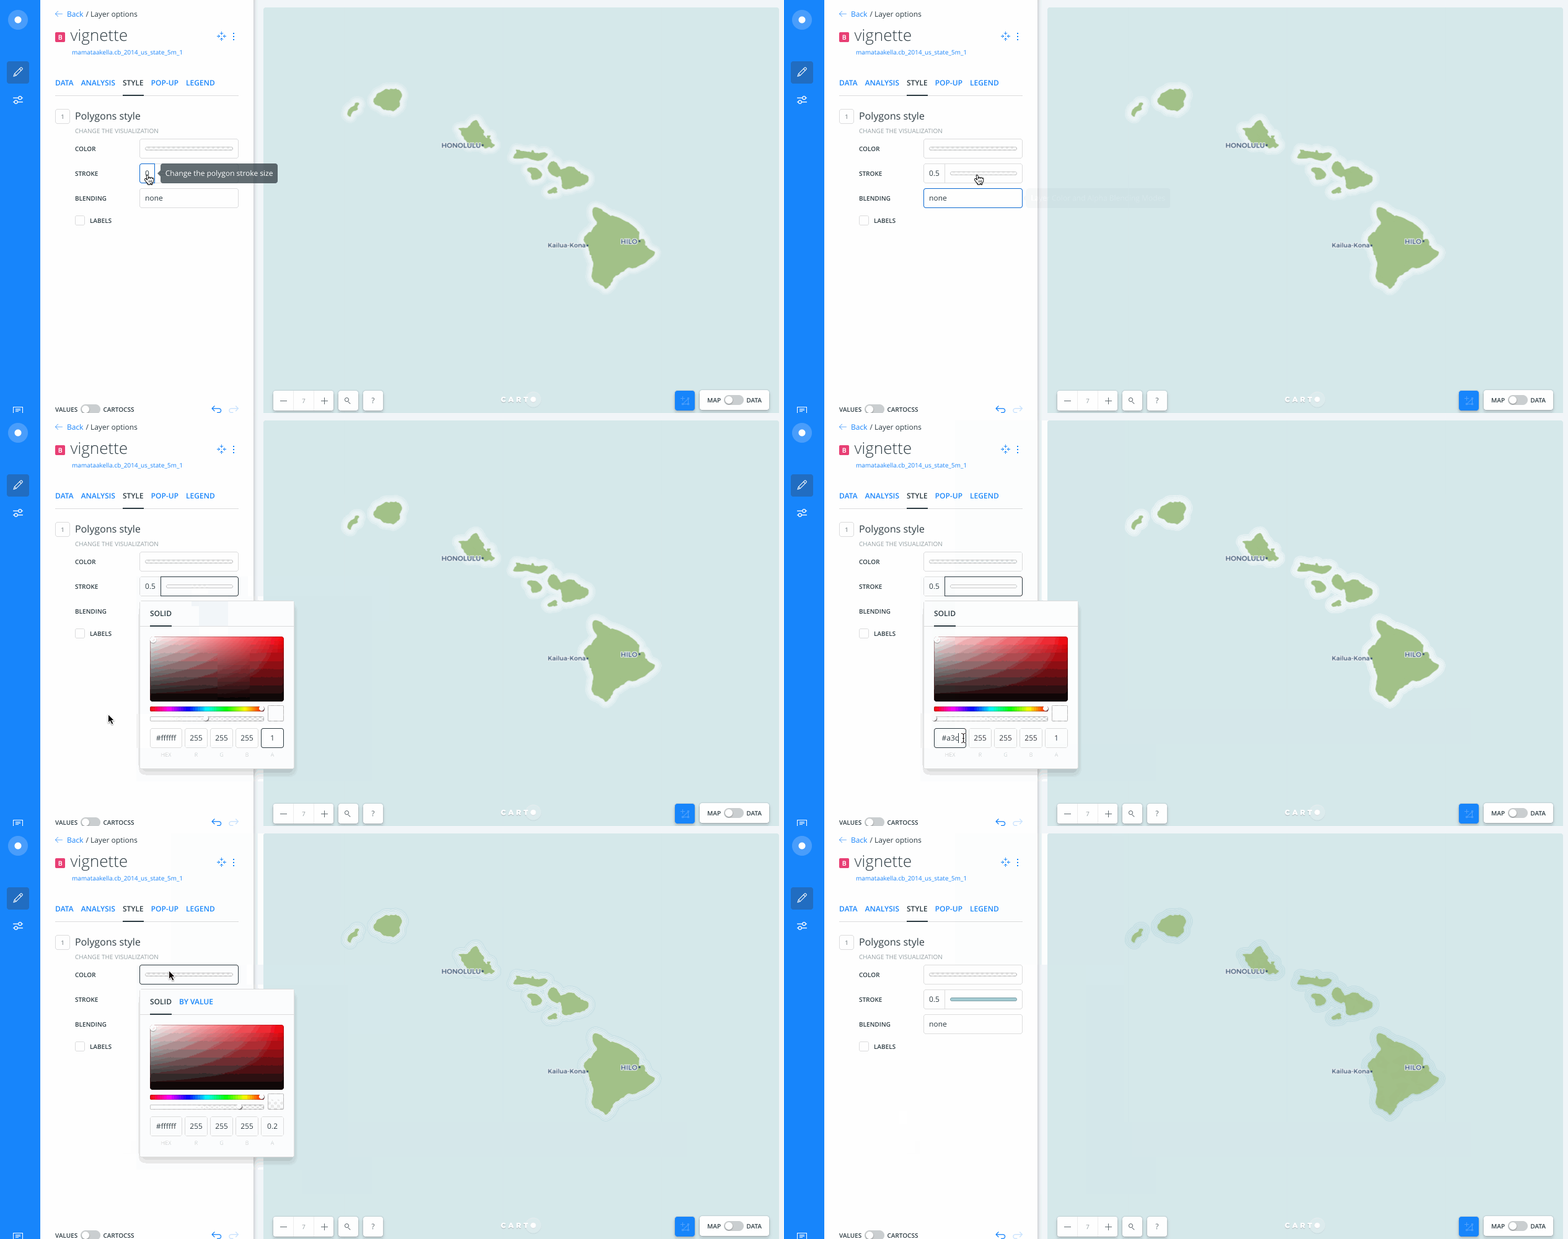
The coastal vignette styling is done in layer B: vignette. In the style properties of the layer, set the polygon fill to white and set opacity to 0.2. Next, set the polygon stroke width to 0.
With these style adjustments, we get the blurring and fading effects typical of vignettes.

Water Lines
Using the same map, let’s see how we can transform the vignettes into water lines using polygon stroke properties.
To visually push the water lines to the background, we chose a shade of blue (#a3cbd2) that is slightly darker than Voyager’s ocean color. Next, we set the stroke width to 0.5 and opacity to 1. Since this effect only uses lines, the final step is to set the polygon fill opacity to 0.

BONUS: Dynamic Analysis
One of the many awesome pieces of Builder is the ability to rerun an analysis and watch the map dynamically update. Not only can we test multiple parameters, each time we do, everything (including our styling) updates with the analysis.
To demonstrate, from layer B adjust the Radius of our AOIs from 12 km to 16 miles. Click “Apply” to see the map update with the new distances while our styling remains in tact (so cool, right??).

*Note: some naming in Builder UI could have changed since this article has been writen.