


Real Estate
Whether it’s commercial or residential, RE firms, funds & consultants are taking their Real Estate Market Analysis to new levels through Spatial Data Science, considering the why behind the where.


Get inspired by our customers


.jpeg)
.png)


With CARTO’s AI Agents, predictive growth insights move beyond data analysts and into the hands of every decision-maker. Now, anyone can ask our data questions like ‘Which neighborhoods will grow fastest?’ and get instant answers - speeding up site planning and providing a real competitive edge.

.png)


CARTO's cloud-native approach aligns perfectly with our goals, enabling us to leverage geospatial analytics seamlessly in our day-to-day operations. I absolutely recommend CARTO to any organization looking to apply geospatial analytics on a daily basis. It's been a great partnership, and I look forward to future collaborations.

At EQT, we constantly seek ways to enhance the strategic value of our investments and improve the decision-making process. CARTO has been a game-changer for EQT, their cloud-native platform, seamless data integration, Builder for visualization and Analytics Toolbox make it much easier for us to assess investment opportunities and provide strategic advice to our portfolio companies.

CARTO allows us to use hundreds of spatial variables in our analysis, including demographics, competitor data & credit card transaction data to very quickly gain a competitive information edge in our bidding processes, allowing us to push our assumptions further & faster.


CARTO is helping our clients to start working with Location Intelligence solutions, leaving behind inefficient, traditional processes. This is a technical and cultural change that makes it possible for a client with a portfolio of several hundred thousand assets to see them on a fully interactive map.

Investment Analysis
Every property has a coordinate, and visualizing assets and investment opportunities is pretty simple.
However, identifying property investment opportunities isn’t about where things are, it is about why they are less or more attractive.
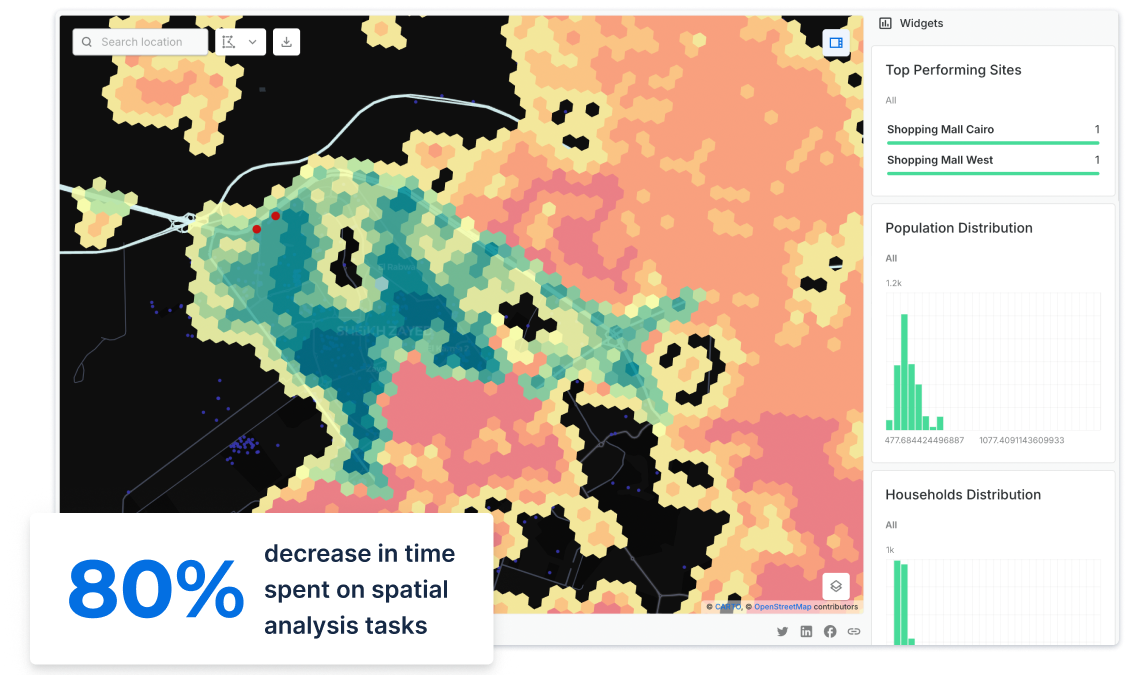
Whether it’s shared workspaces, data centres or shopping mall location - using spatial variables in your analysis is becoming the bread and butter of Investment Analysis in Real Estate.

Site Planning
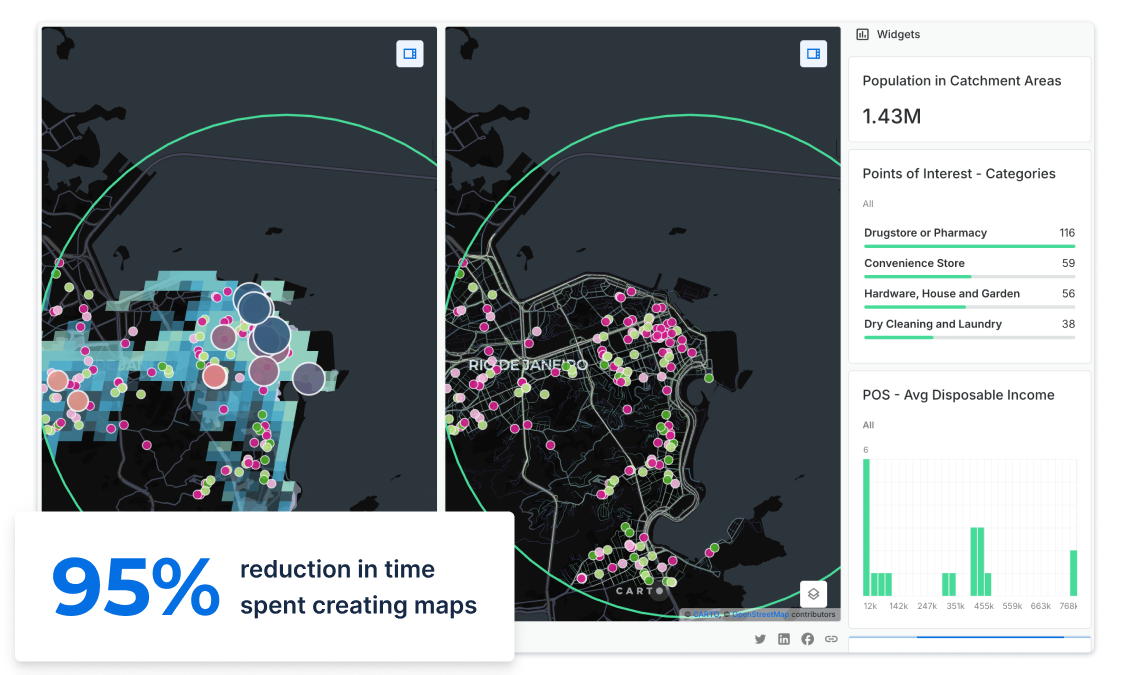
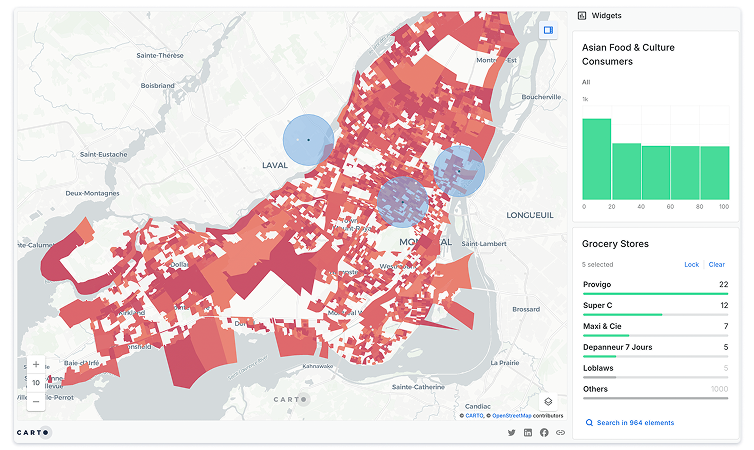
Using multiple location data streams in the site selection process as a Commercial Real Estate developer is crucial in order to understand catchment and trade areas for your final clients.
Whether it’s for retail sites, corporate offices or industrial units - justifying pricing, for both sales and rentals, is more important than ever.
Bringing in new datasets relating to consumer insights or human mobility can be the difference between closing that big deal, or losing it to your competitor.
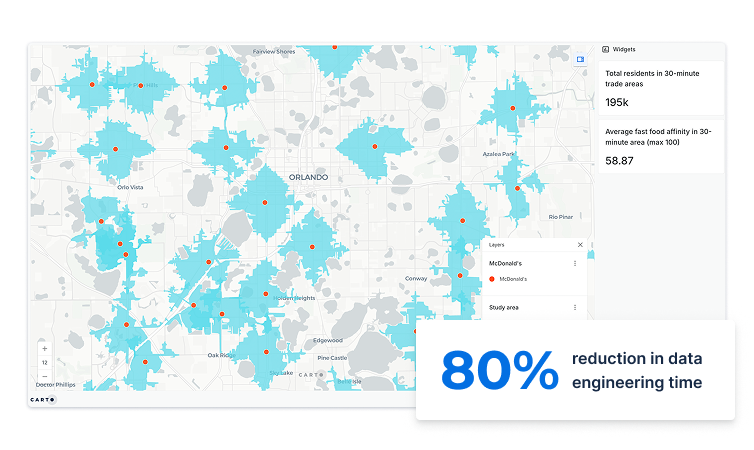
Trade Area Analysis
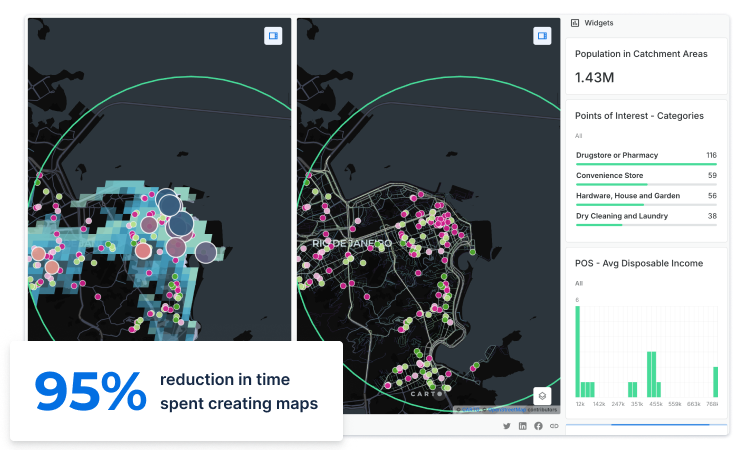
In M&A, trade areas are fundamental to understand where potential acquisition chains’ customers live in relation to existing or potential business sites.
By comparing the number of customers by distance from a business site to the number of households in the study area - your analysts can rapidly gauge the opportunity that a potential investment may have, or that an existing portfolio company may be missing.
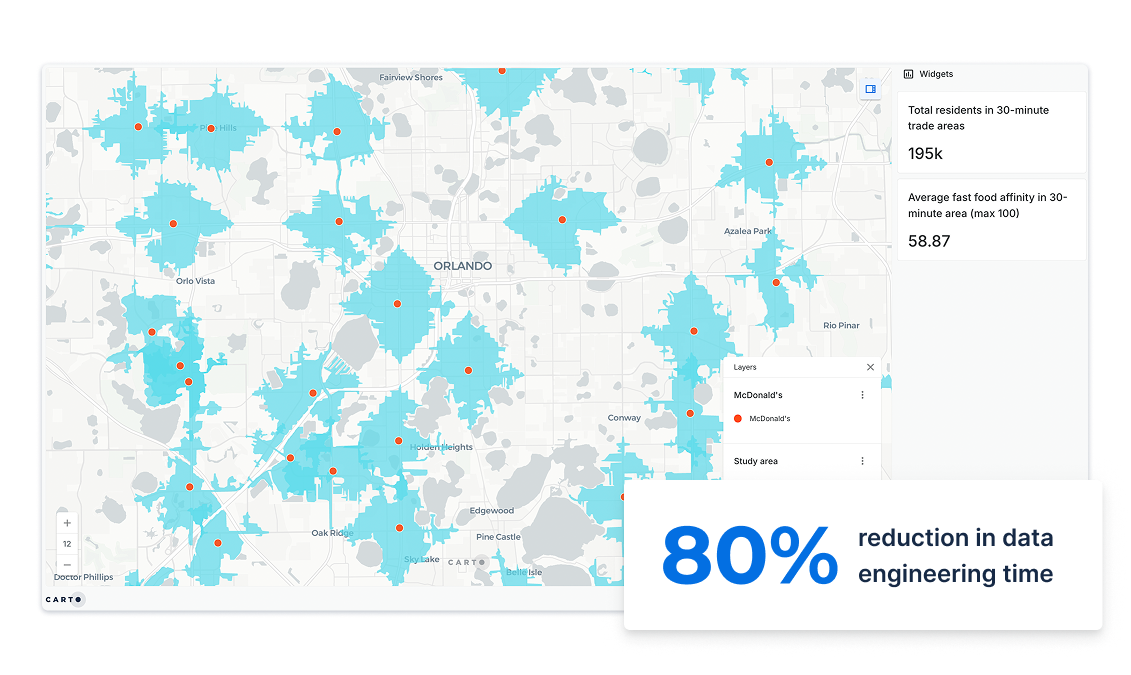
Pricing Optimization
When it comes to negotiating sale or rental prices with clients, having data streams and spatial analysis solutions to hand to justify your pricing strategy can be a key differentiator for your commercial teams.
By using reliable data on foot traffic and credit card transactions, you can show growth and potential by location to move deals faster.


Related content
.jpg)

TALK TO US
Request a Demo
Schedule a 20 minute meeting with our experts to understand how you can use spatial analysis in your organization.