


Nagarro & CARTO: Advancing Enterprise AI Transformation
CARTO and Nagarro partner to help enterprises move AI from pilots to production, embedding Location Intelligence into existing workflows and systems.


Accessing Demographic Clusters with CartoDB's Segmentation Layers
Explore U.S. neighborhoods with CartoDB's new demographic segmentation layers. Easily analyze and augment your data for richer insights.
Change Basemap Styling with the SDK
Learn how to leverage vector-based maps with mobile SDKs! Customize map styles effortlessly for offline packages. Explore dynamic parameters & CartoCSS styling.
Javier de la Torre interviews with Forbes Magazine: Changing the Name of the Data Game to Location
Explore the transformative power of location data with CartoDB. Forbes highlights our role in the data revolution, making location data a household name.
CartoDB will be sponsoring Inspire 2016 Conference
CartoDB at Alteryx Inspire 2016, San Diego, June 6-9. Visit booth #P2 for demos and explore how CartoDB enhances data workflows with location intelligence.
Rapidly Render Data Maps with CartoDB's Data Overviews
Efficiently visualize massive datasets on maps with CartoDB's Data Overviews. Rapidly render tile features without compromising data integrity. Explore now!
CartoDB the Data Analysis Technology for New Media
Elevate data journalism with CartoDB! Join us at Jornada de Periodismo de Datos conference. Explore workshops, webinars, and stay informed with our Geo-Jour Newsletter.
This year is no exception! CartoDB will be at FOSS4G-NA
Join CartoDB at FOSS4G-NA 2016 in Raleigh, NC, where our team will share insights on mapping, machine learning, and data analysis.
The L.A. Times scores a slam dunk with a data visualization of every shot Kobe’s made...ever!
Explore the LA Times' data-driven visualization, mapping every shot of Kobe Bryant's career using CARTO, highlighting his legacy through impactful data.
Tacking the Challenges of Humanitarian Mapping
Discover the power of mapping in humanitarian crisis response. See how CartoDB and the Humanitarian OpenStreetMap Team collaborate for effective relief efforts.
CartoDB Mobile with Xamarin
Join CartoDB at Xamarin Evolve 2016 in Orlando, FL, as we showcase our Nutiteq maps component for Xamarin developers. Write code once and run it everywhere!

Academy
Nagarro & CARTO: Advancing Enterprise AI Transformation
CARTO and Nagarro partner to help enterprises move AI from pilots to production, embedding Location Intelligence into existing workflows and systems.


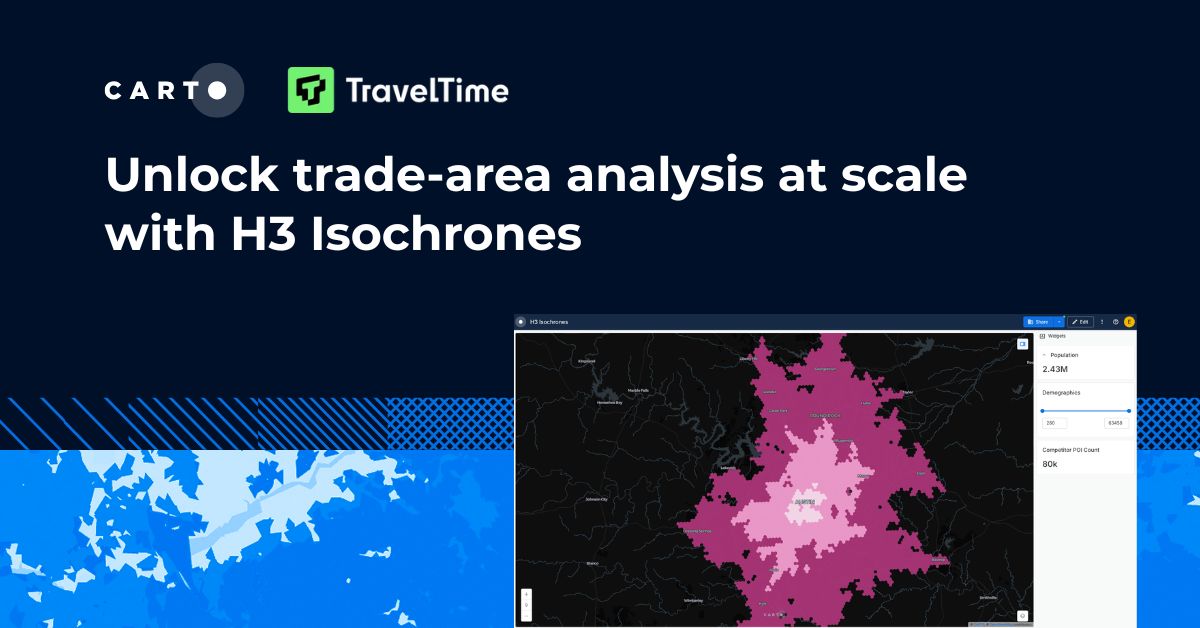
Unlock trade-area analysis at scale with H3 Isochrones
Scale travel-time analysis with H3-based isochrones in CARTO. Faster joins, overlap insights, and 96–99% time savings powered by TravelTime.

Geospatial Foundation Models: Workshop Takeaways
Explore the state of geospatial foundation models, from representation learning to population dynamics, with insights from the CARTO & BSC workshop.
.jpg)