Unlock trade-area analysis at scale with H3 Isochrones


Isochrones are a cornerstone of spatial analysis, and for good reason. They’re essential for territory planning, target marketing, and understanding market penetration and accessibility. At their heart, isochrones help determine whether your products and services are truly reaching customers and, just as importantly; where gaps may exist.
But as your business grows, so does your data.
What once felt like a quick, city-level analysis can slow to a crawl when scaled nationally. Meanwhile, business questions evolve. Analytics teams move from asking, “Is this customer within a 30-minute drive of our branch?” to more nuanced questions like, “How far is this customer from each branch?” or “How much do our branch catchment areas overlap, and where might this lead to cannibalization?”
These shifts place new demands on spatial analytics teams and expose limitations of traditional approaches.
That’s why we’re excited to introduce a more scalable way to unlock these business needs and questions: H3-based isochrones powered by TravelTime. By moving beyond traditional polygons and leveraging H3, an open-source hexagonal grid system, this approach makes it easier than ever to analyze travel-time data at scale.
If you’re new to H3 and spatial indexes, get up to speed in our CARTO Academy! Or dive in with our Spatial Indexes 101 Report.
Let’s get started!
Why H3-based Isochrones?
This new approach unlocks a faster, more scalable way to enrich data, helping analytics teams accelerate everyday operations. More than a traditional catchment or trade area, TravelTime H3 delivers a level of detail that regular isochrones often miss. Travel times are calculated for every H3 cell using any mode of transport: walking, driving, biking, or public transit.
And the impact goes far beyond flexibility and detail. Customers report a 96–99% reduction in processing time across data preparation, spatial joins, and enrichment—without sacrificing accuracy.
Three core benefits stand out:
- Consistent: H3 grids provide a standardized unit for analysis, removing the ambiguity of irregular shapes.
- Fast, seamless joins: With travel-time data already indexed to H3, joining it with other H3-indexed datasets, like demographics, human mobility, or financial data, is fast and simple for larger geographies.
- Overlap made simple: Each H3 cell is unique, making it easy to represent complex trade areas. Using simple SQL functions like GROUP BY H3, you can quickly identify overlapping areas, making your data intuitive and insight-ready.
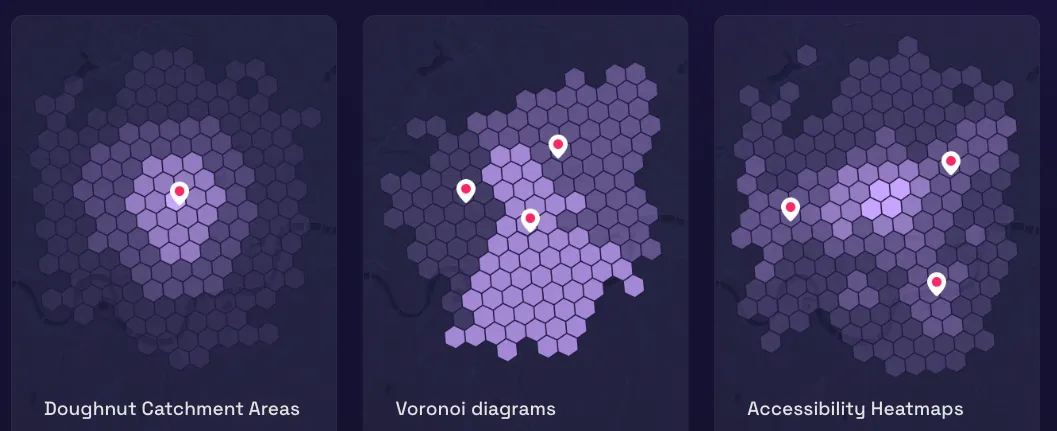
When H3 isochrones shine
H3 isochrones really excel in complex scenarios where traditional methods start to break down. They make overlap easy to see and measure, keep rich distance detail intact, and let you enrich multiple datasets quickly and at scale.
Likewise, because each H3 cell is just a string, enrichment often comes down to a simple join; much faster and more efficient than working through polygon intersections.
To learn more about the nuances and trade-offs of H3, check out our Spatial Indexes 101 Report.

How it works
TravelTime H3 takes a unique approach to traditional polygon-based areas. Instead of drawing a boundary around a location, TravelTime calculates real-world journey times across the road and transit network, then converts the results into an H3 grid, for fast, scalable analysis.
Here’s what happens under the hood:
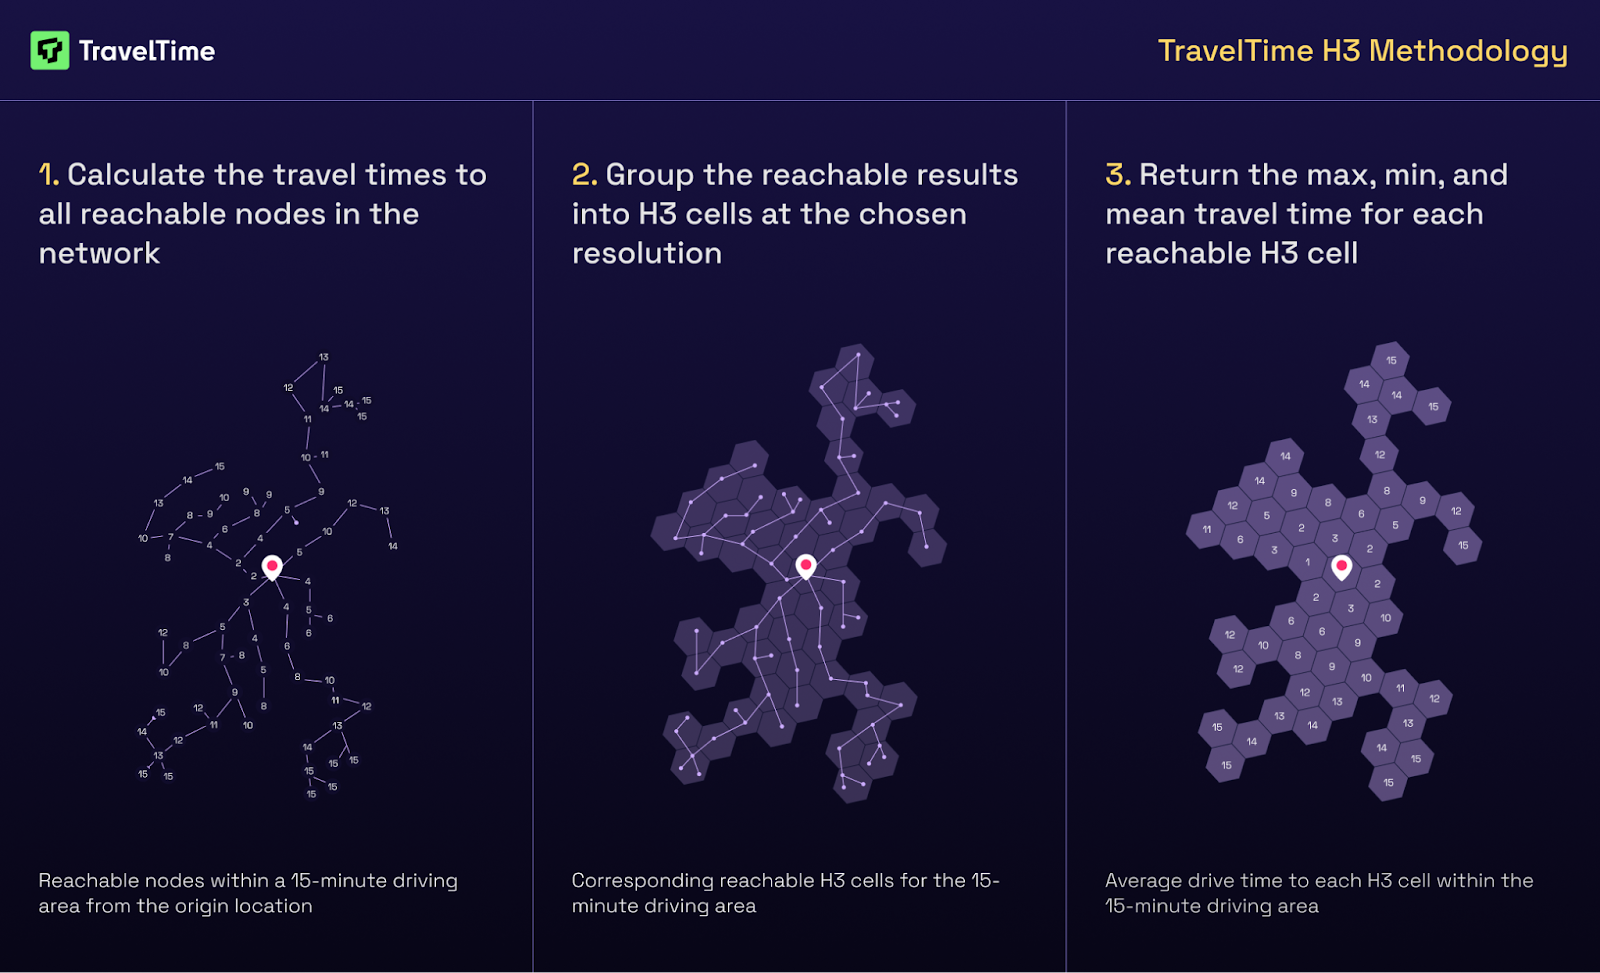
1) TravelTime calculates reachable network nodes
For each origin, TravelTime runs a routing computation using the parameters you specify, including:
- Maximum travel time
- Transport mode (driving, walking, cycling, public transport)
- Departure time for time-dependent travel
This produces a set of network nodes or locations that can be reached within the travel time threshold, along with the travel time to each node.
2) Results are grouped into H3 cells
TravelTime maps those reachable nodes onto the H3 grid at your chosen resolution. An H3 cell is included if it contains at least one reachable node.
This step turns raw routing output into a clean, consistent set of hexagonal units that are ready for analysis.
3) Travel time is summarized per H3 cell
Finally, TravelTime calculates travel times for each included H3 cell, based on the travel times of the nodes inside it.
For every H3 cell, TravelTime returns:
- Minimum travel time
- Maximum travel time
- Mean travel time
This returns rich travel time detail (not just a single-line boundary), while keeping the output compact, consistent, and easy to use.
To learn more, see TravelTime’s documentation and examples here!
Getting Started: H3 Isochrones in CARTO
Good news! This new capability is available across the CARTO platform, meeting where you work day-to-day, including:
- Low-code in CARTO workflows: A new Create H3 isochrones Workflow component is now available in our drag-and-drop environment, allowing you to generate H3 isochrones without writing a single line of code.
- Data warehouse console: New corresponding functions in the CARTO Analytics Toolbox that generate H3 isochrones directly in the data warehouse console.
- LDS API for developers: A new endpoint in the Location Data Services (LDS) API leverages TravelTime H3 support or seamless integration into your custom geospatial applications. You can also expose low-code CARTO Workflows via API to run analyses with user-defined parameters and connect them to app frontends.
All of these options support the same powerful configurations available in the TravelTime H3 API, including departure time and transport mode (driving, public transport, walking, and cycling). To see a comprehensive list of supported global countries, check it out here!
Let’s see this in action!
Territory and logistics optimization for e-commerce
So what does this new capability actually unlock for an e-commerce network? Imagine managing thousands of Automated Parcel Machines (APMs), or smart lockers, spread across the country. Every day, you’re trying to answer a few critical questions: Which lockers are easiest for customers to reach? Where are we over- or under-serving demand? And how can we move parcels through the network more efficiently?
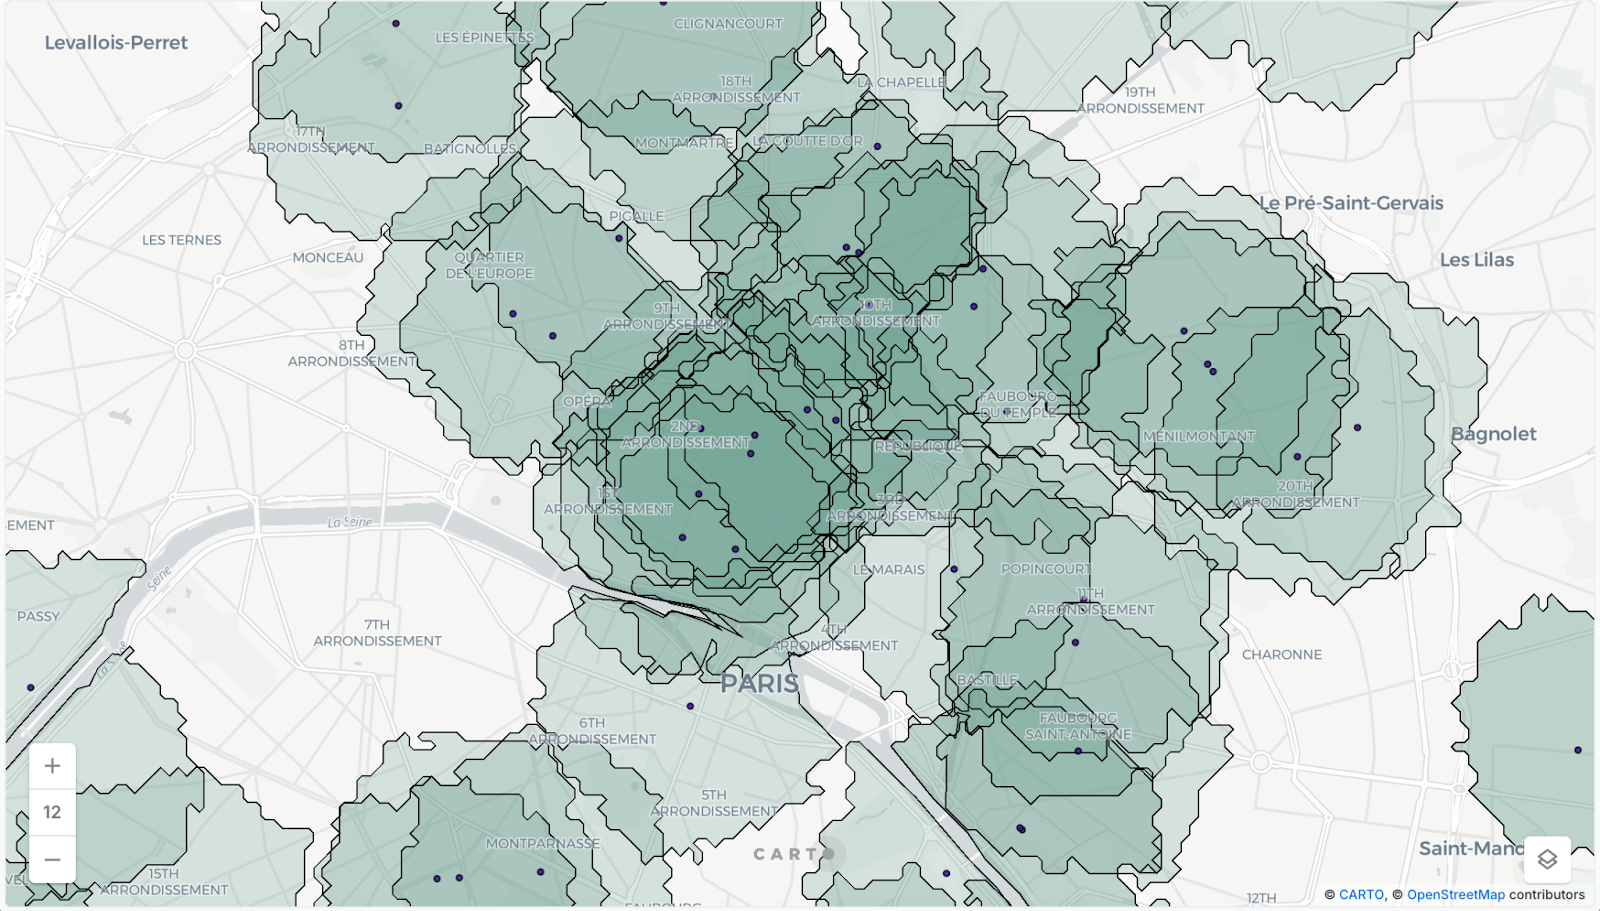
With traditional approaches, getting clear answers is tough. Creating walk-time polygons around every locker quickly turns into a dense web of overlapping shapes that’s hard to interpret, difficult augmenting with other data sources, and expensive to compute.
That might look something like this:
Instead, let’s explore how H3 isochrones help answer real business questions with clarity and scale.
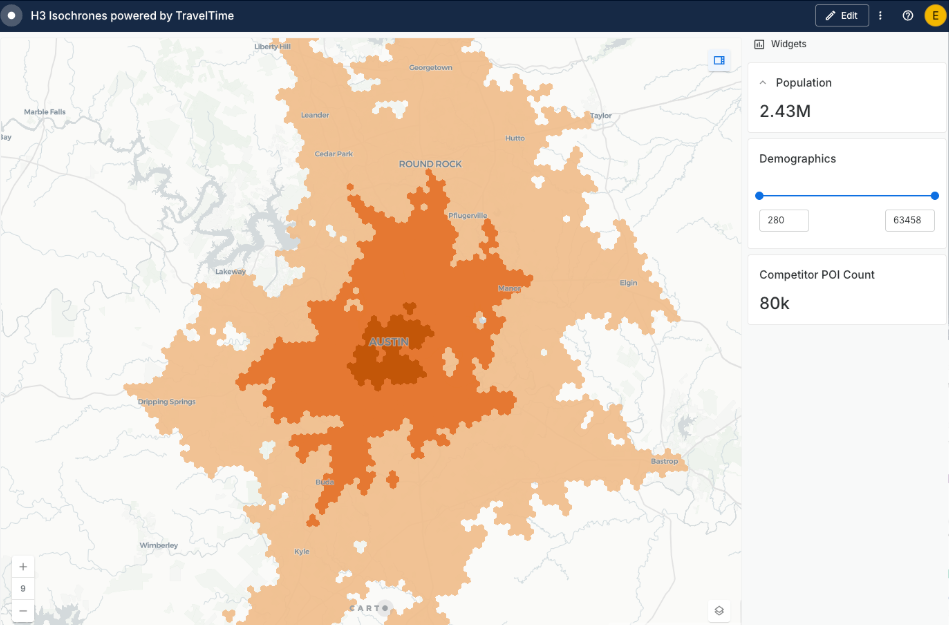
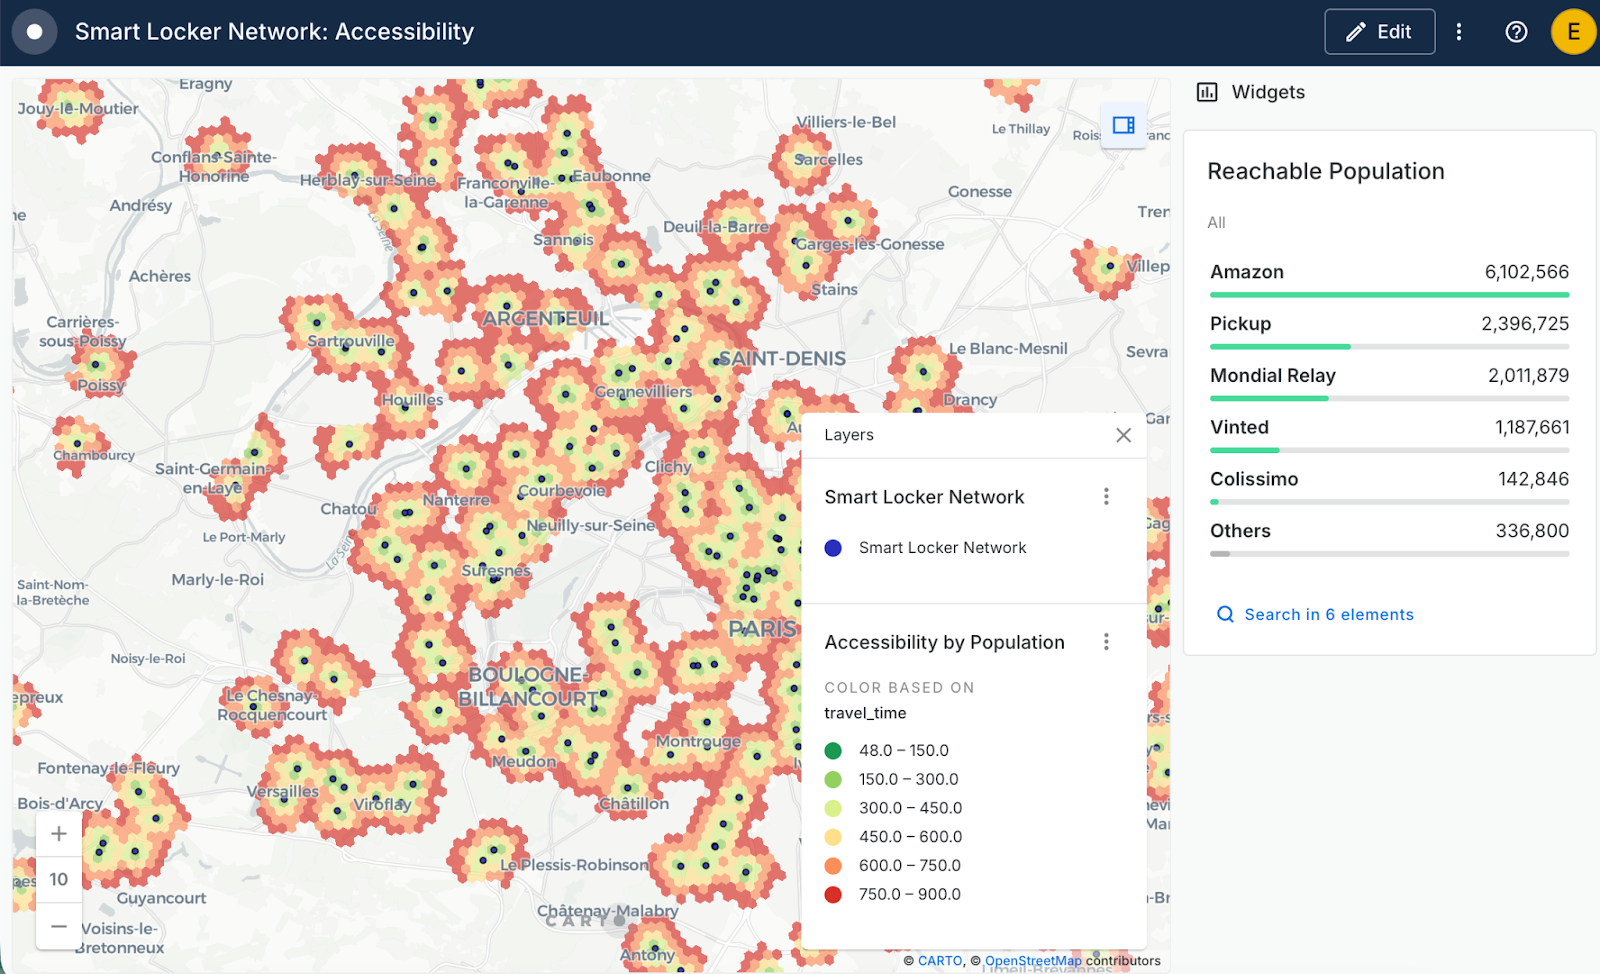
Network accessibility
To understand how far your smart locker network really reaches, you can enrich population data within a 15-minute travel time, filtered by delivery partners. This gives you a straightforward view of how many people can realistically access each locker network.
What makes this powerful is the instant clarity. You can see which populations are within easy walking distance of a locker and, just as importantly, where customers are being left out. Those gaps highlight clear opportunities to improve coverage and customer experience.
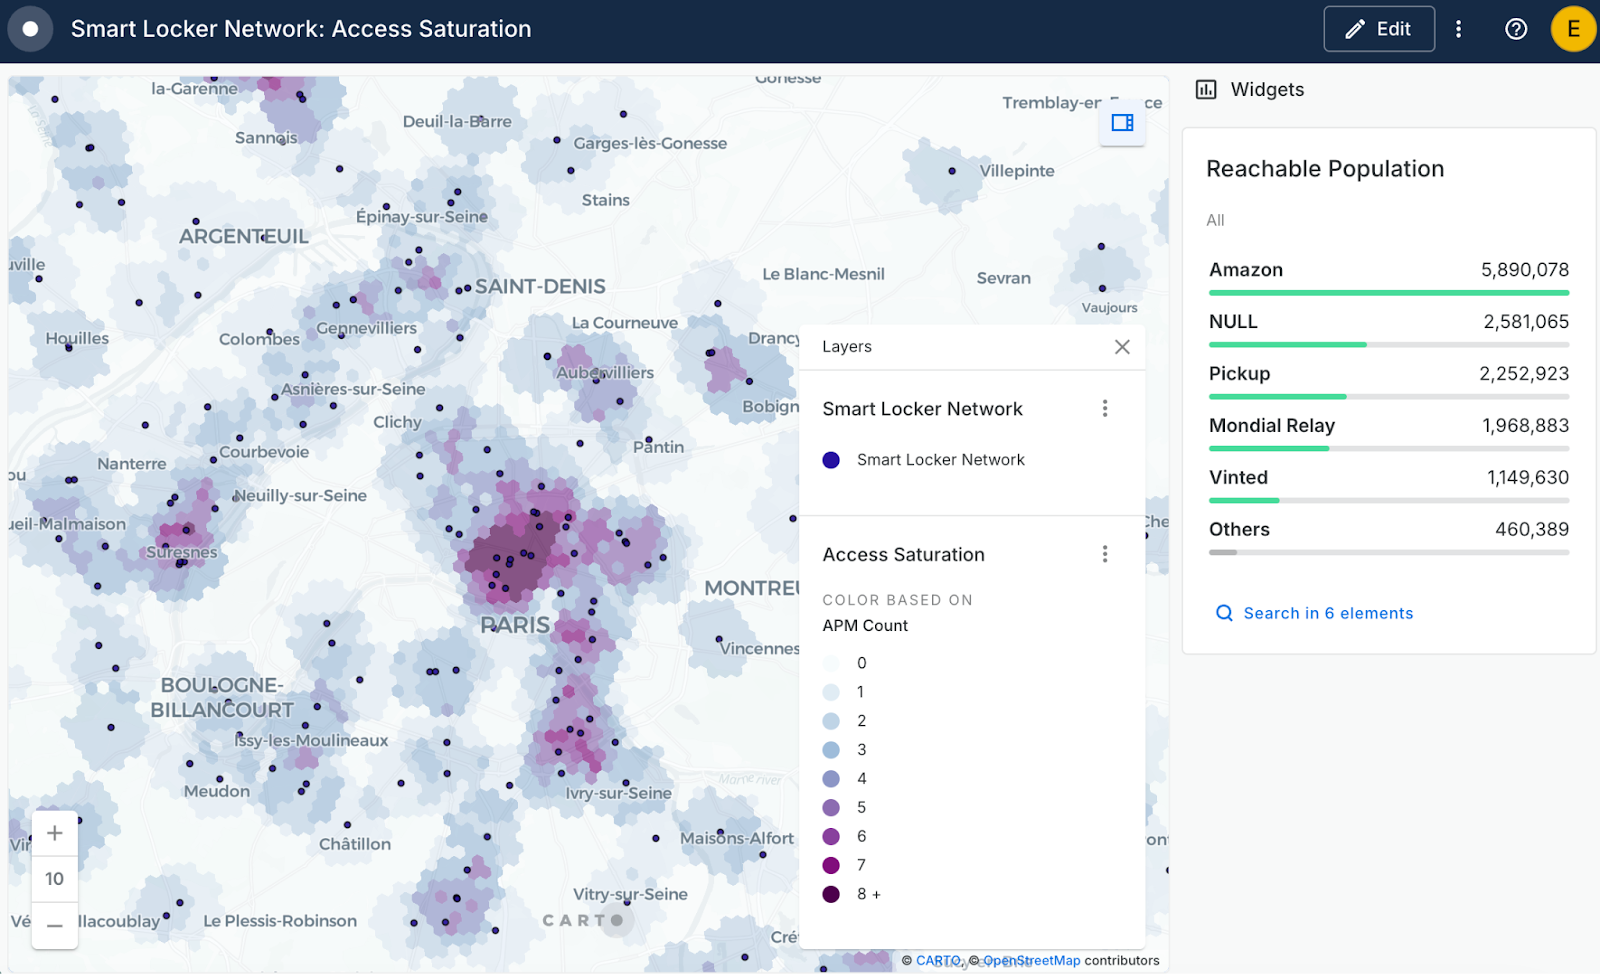
Access saturation and expansion
Beyond reach, it’s also important to understand density. Using H3 isochrones, you can count how many lockers are reachable from each area, helping you see where the network is saturated and where it has room to grow.
This broader view makes it easier to plan for overflow. If one locker fills up, you can quickly identify nearby alternatives that serve a similar customer base within comparable travel times. It also helps spotlight lockers with fewer delivery partnerships, pointing to smart, data-backed opportunities for expansion.
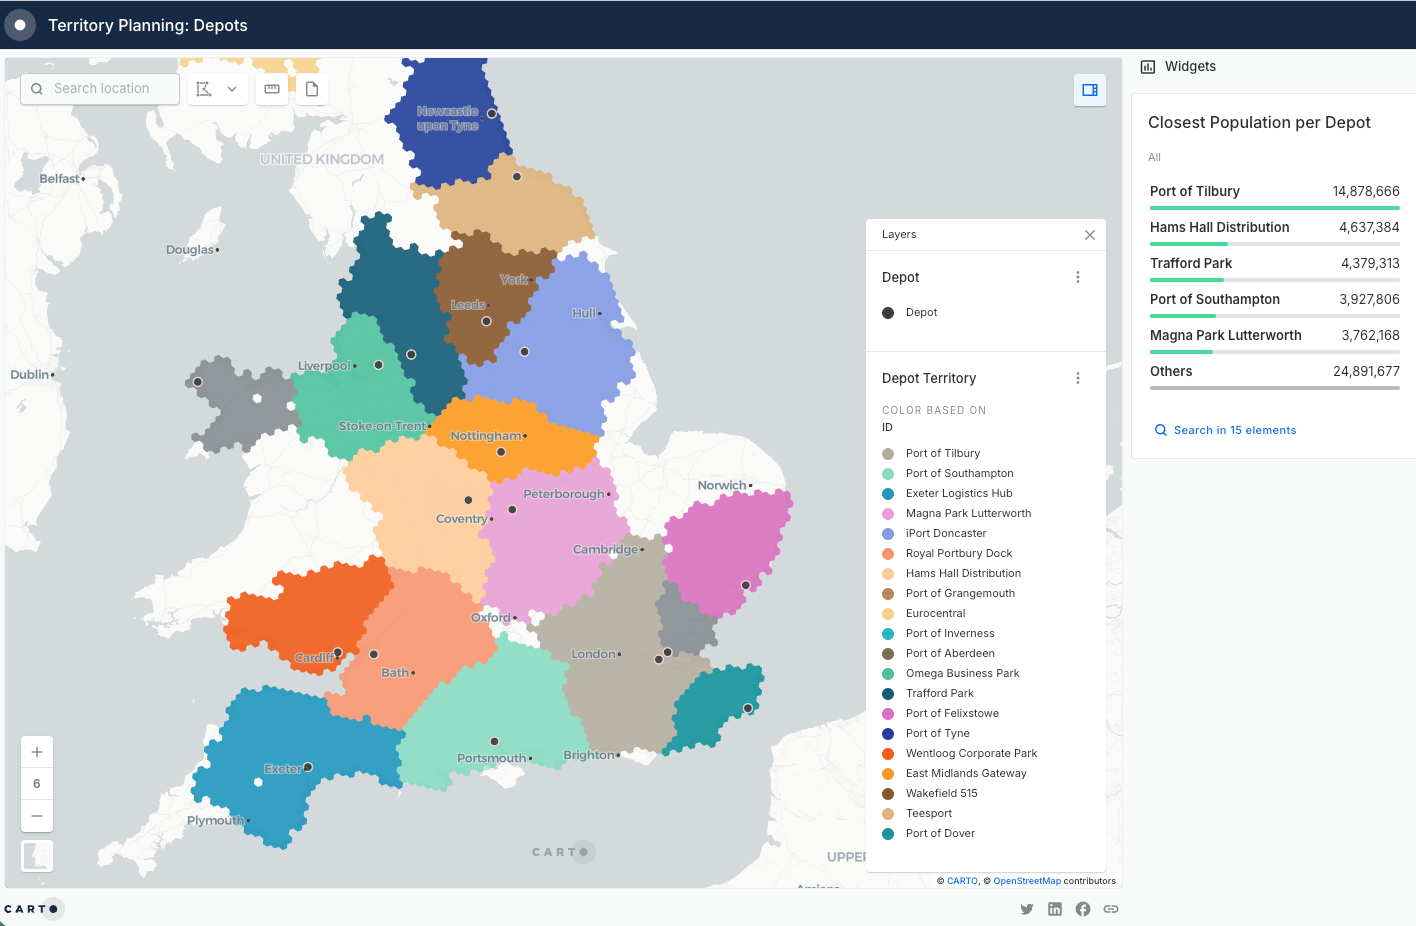
Territory planning
Finally, territory planning becomes far more intuitive. By understanding which areas are closest to each delivery depot and how much population each depot serves, teams can make smarter distribution decisions long before parcels ever reach a locker.
The result is better routing, more balanced territories, and a delivery network that scales efficiently as demand grows.
From self-serve maps to strategic decisions
Once you move beyond basic territory and network planning, H3 isochrones open the door to a whole new set of scalable, high-impact use cases.
- Spot site cannibalization: By enriching with demographic and population data, you see not only where you are competing for the same customers, but how many. Instead of relying on complex, overlapping polygons, you get a clear, measurable view of where cannibalization is happening so you can adjust coverage with confidence.
- Uncover competitive whitespace: By enriching your locations with competitor data, you can quickly understand the true competitive landscape. This makes it easy to identify high-value areas that are underserved by everyone, turning site selection from a reactive exercise into a proactive growth strategy.
Looking for more inspiration? Check out examples from TravelTime and discover how to unlock the full potential of spatial indexes with 10 powerful uses of H3.
"We are excited to bring TravelTime H3 to the CARTO platform. As spatial analytics teams face increasingly complex demands across millions of data points, the need for scalable, high-performance tools is critical. TravelTime was engineered to provide uncompromising accuracy at any scale, and we are proud to partner with CARTO, a team that shares our commitment to pushing the boundaries of what is possible in Location Intelligence." -Charlie Davies, TravelTime CEO & Co-founder
Conclusion
H3-based isochrones are more than just a feature: they’re a way to unlock spatial analysis at scale. By removing technical bottlenecks, they help teams scale to actionable insights faster and more efficiently. This means more time focused on what really matters: understanding your market, identifying opportunities, and making smarter business decisions.
Already using CARTO? Reach out to the CARTO team to discuss and enable TravelTime isochrones for your account.
Not a CARTO user yet? Start a 14-day free trial and experience these new features yourself!