

CARTO AI Agents now integrated with Oracle Generative AI
CARTO AI Agents are now integrated with Oracle Generative AI, enabling secure, governed Agentic GIS and scalable geospatial AI in Oracle Cloud.
Take Flight with EBP and CartoDB for Europe's Green Week 2015
Explore bird distribution patterns with the EuroBirdPortal project, powered by CartoDB. Visualize migratory patterns, phenology, and more.
Data Synchronization with OGR
Sync private data effortlessly with CartoDB using OGR. Keep your tables updated, styled, and private. Explore now!
Our favorite Earth Day maps
Explore environment maps & celebrate Earth Day with CARTO! Discover NYC Tree maps, global forest change, bird tracking, air pollution insights & more.
Location intelligence resources straight to your inbox
Subscribe to our latest news, product features and events.

Academy


CARTO AI Agents now integrated with Oracle Generative AI
CARTO AI Agents are now integrated with Oracle Generative AI, enabling secure, governed Agentic GIS and scalable geospatial AI in Oracle Cloud.


Spatial Analytics in 2026: What's Changing?
Explore how AI, cloud-native tools, and evolving skills are reshaping spatial analytics in 2026, based on insights from 200+ geospatial experts.


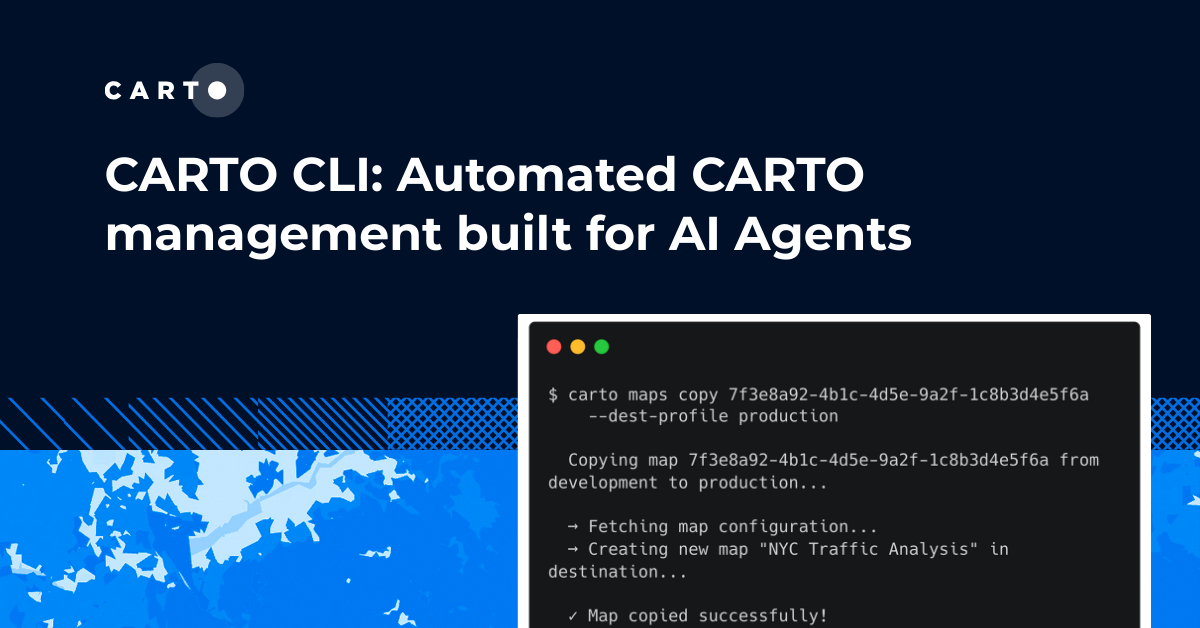
CARTO CLI: Automated CARTO management built for AI Agents
Meet the CARTO CLI: a command-line interface that unifies human expertise, automated pipelines & AI agents into one geospatial operating model.


