


Transcription
This customer story has been adapted from a presentation given at CARTOLocations New York.
Why Commercial Real Estate?
Hi everybody, my name is Tim and I am the head of research and lead data scientist at Hodges Ward Elliott. We are a commercial real estate investment company so admittedly I am a rare breed of data scientist in commercial real estate. I’m going to talk about three topics.
First about real estate in general, specifically commercial real estate and why it’s a really awesome place to work right now and why that is becoming more interesting over time and will continue to become more interesting in the future. Then I’m going to present what I’ve been doing over the last few years which is bringing data science together with real estate and I’m going to go on the record and say that I think data science and real estate actually go really well together. Then at the end, I’m going to talk a little bit about what I see as a productive spatial data science workflow and specifically I’ll be talking about the open source programming language R.
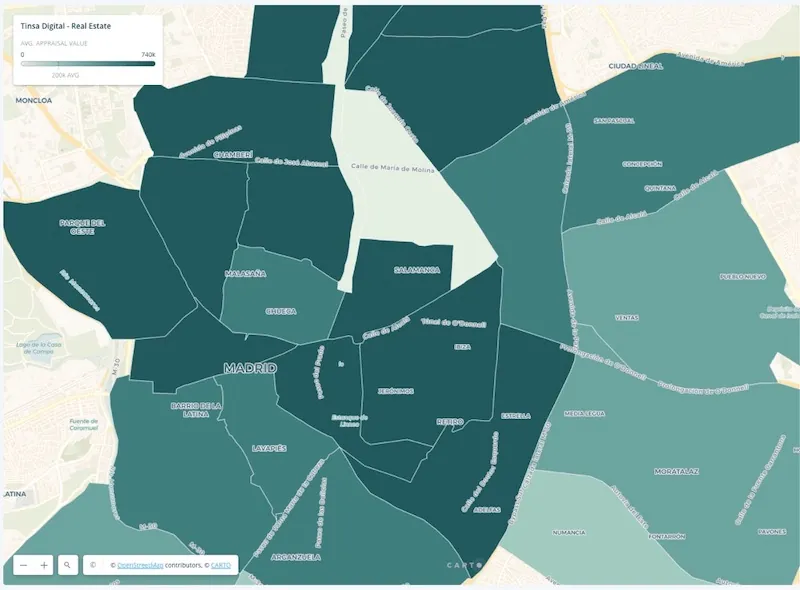
As my boss likes to say all the time: “everything’s got to happen somewhere”. Real estate is intrinsic and essential to everything that we do, every single day, most days of our lives. But from a commercial real estate perspective it’s really interesting as an asset class because it’s one of the few alternative asset classes that both returns a cash flow to you, as the owner of the price of real estate, and also appreciates some value. For that reason we’re seeing, especially in recent years, an increased traction by the global investor community towards real estate. There was a study done by The Wall Street Journal in 2015 about hypothetically what it would cost or what it would take in terms of diversification of the portfolio to earn 7.5% returns per year. As you can imagine there are a lot of winners over the last 20 years but real estate went from 0 to 5%, then more than doubled in terms of the allocation that you would need in this particular study in 2015. Why are bonds disappearing in real estate and other asset classes becoming more attractive?
Anyone who’s familiar with the investment community has probably seen a chart of the slow and seemingly inevitable depression and decline of the bond yield over the last four decades. As investors can’t get the same yield from bonds, they have turned to other asset classes with real estate filling that gap because it’s both an attractive investment from a yield perspective (it’s very creative), but also from a risk perspective since it’s a fairly low risk asset (with some notable exceptions like 2008). In fact on that yield point from the period of 2000 to 2016, real estate as an asset class, outperformed equity by 2 to 1. The results of this were an increased demand, very much domestically but internationally as well, especially in Europe. Right now we’re seeing a lot of anticipated demand for diversification into real estate in the coming years and not just domestically in those foreign markets but what we call cross-border transactions (buying real estate in other countries).
You’re probably not surprised to find out that the number one destination for cross-border capital is the United States and the number one market in the United States for cross-border capital is New York, specifically Manhattan. For those of you that live in New York you may or may not be surprised to find out that you live in the commercial real estate capital of the world. To summarize, I think real estate is really interesting as an asset class and it’s becoming more interesting and will continue over time.
Data Science loves Real Estate
I want to talk about data science and real estate together and like I said at the beginning of this presentation we don’t see a whole lot of this happening right now. A part of the reason for that is that data on real estate has been really hard to come by because the industry is behind the times a little bit. However there are a few trends that are happening right now and for the last few years that are very exciting in the world of real estate and data.
The first one and I think the most important one is: open data. What is open data? It is a movement by governments around the world, pioneered in New York in a lot of ways, to take all of their government agency data and make it available online to people. There is a good governance and transparency ethos there, notably in New York who are at the forefront of this type of initiative. In 2012 in New York, Bloomberg signed a law into existence called the Open Data Law which stated that all public data should be made available online in a single web portal by the end of 2018. I think what’s really interesting, especially in the last few years, we’ve seen and lived through a sort of renaissance in terms of the types of data that are becoming online. Thousands of high-quality datasets that describe governments and the people that comprise those governments being made available online for free, for your benefit, with no real strings attached.
There is a list of all the open data portals all around the world and taking the example of the eastern part of the United States there are 861 data portals. Each one of these portals has anywhere from a thousand to ten thousand datasets about all kinds of things: crime, trees, parking tickets, anything that a government does and they’re putting all that data online now. That’s great from a democracy standpoint and also great for real estate because there’s a trove of data that’s coming online that we never had before to analyze, especially within urban markets.
Real Estate is about people
Fundamentally if you think about it, real estate is about people. It’s about where do people want to live, where do they want to shop, where do they want to work… If you can understand the preferences of groups of people and how those are going to change over time you can understand real estate. If you want to know how to profit in real estate that’s the way to do it, you have to understand what people want. I’ll give you a quick example of this: there’s this prevailing narrative right now that Millennials have been screwing up the economic recovery because they’re refusing to buy homes for the first time. To a certain extent there are some demographic differences between them and other generations but what a lot of people at my firm argue is that a lot of that is just driven by regular demographics.
On the screen you can see a chart with a blue line which represents US birth rate plus projections out to 2060 and the orange line represents those births shifted over for 33 years. 33 years was chosen because the number one life event that causes people traditionally to purchase their first home is the birth of their second child. The median age for the birth of the second child for college-educated women in the United States is 33 years old. Obviously it can vary from place to place but the point is that if you look at the green dot, where we are now, there’s a lot of people that are going to be entering their early 30s in the next several years and a lot of them are going to have kids and they will be looking to buy their first house.
If you understand people and their preferences, you can anticipate things like increased demand in first time home buyers. Real estate traditionally has been a supply-side conversation. When people are talking about real estate you hear things such as, how much construction was there? What’s the vacancy rate? How many units came online? However, demand is a much more important driver of real estate prices than it has been given deference to and primarily the reason that people haven’t been talking about this for a long time is because it’s been very hard to measure. Things like: how many jobs are in an area? How desirable is an area? How accessible is it? To give you an idea of the difference between these two things we took several very high-level supply and demand metrics and just looked at the correlation between those in New York City versus rents. I think the correlations speak for themselves: change in population, change in employment, change in income. Those things correlate almost twice as much as some of the supply metrics like the changing unit count. When you take those same metrics and run them through a standard linear regression model you’ll see that change in employment is really the only thing statistically significantly driving rents. Demand drives rents not supply. What’s really cool is that once you understand that concept that opens you up to this whole world of analysis in commercial real estate. There are digital footprints today that never existed before which give us a window into what people’s preferences are or how they operate. Everything from social media, transit data like taxi rides, government data like open data, or economic activity like Mastercard data. More and more of this data is becoming available every single day and if you can figure out how people’s preferences are changing over time based on these digital footprints then you stand to profit in the commercial real estate market.
I’m going to go through some examples. Taxi traffic is a favorite of ours, it’s great for analyzing migratory patterns of people around the city. Density clusters are a great tool for drawing the signal out of the noise that is a taxi dataset. Another method to do that is by rolling it up into neighborhoods, and analyzing percent change in taxi traffic pickups. City bikes are another great data source, they make all their data online for free and it’s very high quality. If you want to study subpopulations of people sometimes you have to find interesting proxies for that. For example: where are all the people who are buying five million dollar and up condos in New York City? What type of people are they? What are their preferences? They tend to cluster around Central Park and you could maybe make an argument that there’s three clusters or two on here. But it has implications and especially over time in terms of where this particular population is and what are their preferences.
This is what I like to call the “poor man’s isochrone”. The idea is how quickly can you get to any grid of Manhattan given a certain address and then the really interesting thing that we did was we intersected that with square footage of office space. What you get is how many million square feet of office space are available within 10 or 20 minutes of commute of a particular residence. It ends up being a very powerful predictive feature when trying to analyze residential real estate. Talking about subpopulations, we can also perform an extraction of the residential buildings within 100 feet of a subway in Manhattan and how they function in relation to their neighbors.
Regarding bank deposit data, the Federal Deposit Insurance Company makes all of their data online for free, it’s also very high quality. What I circled on the map is Red Hook, which a lot of people associate with IKEA, but what’s really interesting is that since 2000 there’s been a lot of commercial development there which is reflected in a lot of the big deposit data. Industrial in NYC is also a really interesting story because it’s been disappearing for 25 years, nobody’s wanted industrial for a really long time except for some reason in Staten Island. We were really curious about the increase in industrial zoned buildings in Staten Island and discovered that data centers are driving a lot of that which is really interesting.
Regarding new build permits, a really interesting story is when we look at new construction permits in Hell’s Kitchen and Long Island City. You might ask yourself what’s the commonality between those two things? Is it just stochastic or are they both gentrifying at a rapid rate for no reason? Presumably the answer to that is the Hudson Yards development that’s going up there, which people from New York have probably heard about given the construction has been so loud and going on for so long. Hudson Yards is going to be 20 million square feet of office space going up in the next five years and it’s going to bring 55,000 jobs with it and those people are going to want short commutes and cheap housing so hence all the development.
We looked at a study of contiguous retail in Manhattan and it turns out that areas of retail tend to do much better than one off retail. It has this effect of creating a kind of shopping center as opposed to just a place to go shop. Especially for the folks who are out of town, this is a great map to understand where all the best places are to shop. The circle that you can see on the map is really interesting and that’s emerging right now, is Meatpacking Retail. Retail has been in a dark cloud for the last few years because of Amazon and other things and Meatpacking Retail has a fresh concept and they’re one of the silver linings in this story of declining retail everywhere which will be interesting to watch in the coming years.
Spatial Data Science workflows in R
I wanted to talk about R as a GIS and more specifically about using mapping as part of the iterative data exploration process. For those who might be asking what a data scientist does, I’m going to describe to you what we do with probably 90% of our time. What we typically want to do with a data science project is import and clean data, go through an iterative process of transforming, visualizing and modeling to figure out the patterns in it with the eventual objective of communicating it to some stakeholders.
The point that I wanted to call out here is that mapping and making maps by using the CARTO platform specifically is an essential part of the data science process when dealing with geospatial data. Mapping is very important in communication but also in the exploration portion of it. Transforming, visualizing, modeling, and mapping, all can work together to help you come to conclusions, generate theses and understand your data much quicker.
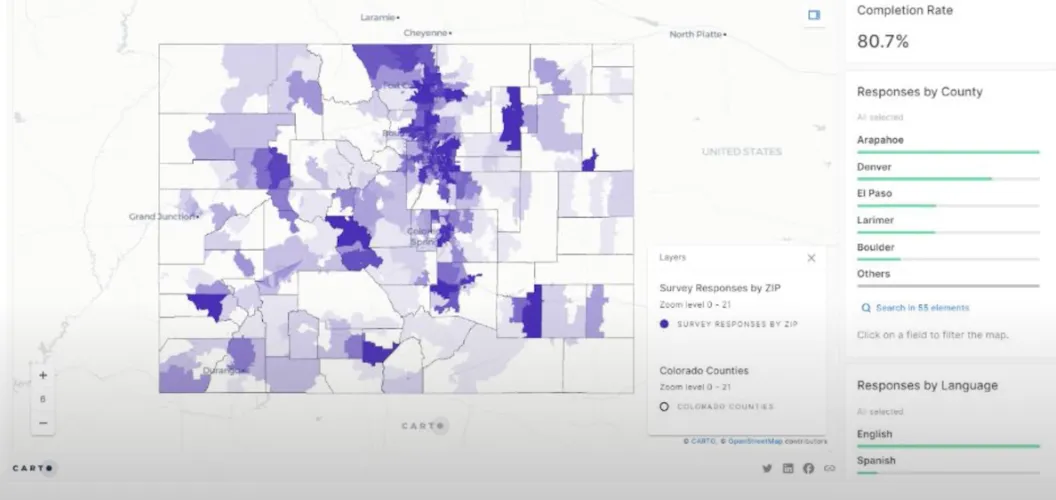
There’s a package called SF in R which stands for Simple Features which has made R a much more powerful GIS in recent times. Essentially what it does is very similar to PostGIS by relating geometries to data and one of the real benefits of it is to quickly create maps based on data. It’s really just a few lines of code to create a map, it’s very quick and easy to do and iterating and building maps is very essential when it comes to coming to interesting conclusions. The other really interesting thing about SF that I’ll touch on quickly is the fact that both geometries and data can be treated the same way. For example I can take some spatial data, group by zip code, break it into deciles, and then put it into a plot like a map very quickly.
The last thing I want to talk about is predictive modeling. We were creating a model that was the probability that a building would sell in any given year in New York City, which can be very useful for canvassing operations and it follows the standard data science process. We took NYC tax lot data and NYC sales data, available online and for free, mashed it together and then went through the iterative process of transforming, visualization, and modeling. We really like random forest modeling, it’s very fast and accurate. For feature engineering one thing that we found was very powerful in terms of predictive accuracy, is the spatial lag which is traditionally only used in geographic weighted progression. It’s essentially taking all of the points around your point and summarizing it, it’s like saying within a quarter mile of this building what was the average increase in income? We find that to be very effective at predictive modeling.
The last thing I’ll say again for driving home this idea that mapping can be used as an exploratory tool, is that if you look at the left hand side that’s a typical chart that a data scientist might make to explore the results of their predictive model. It’s a bar chart and it shows us that our middle model performed much better than the control cases on either side. But what you might not see is that once you plot the true positives on the right side, a probability for sale, you can see a really interesting pattern emerging of where things are clustering together in terms of being easy to predict that they will sell. I was then able to call out a really interesting case in the Bushwick area where there was a high density of easily predictable selling buildings.
To summarize real estate is really interesting and it’s a great time to be in it. It’s really well suited to data science because it’s all about people and there’s a lot of data about people that’s coming out right now. There are new interesting data sources coming online every day and then from a technical perspective, mapping can be used not just as a communication tool but also as an exploration tool.
We interwied Tim Kiely to ask how to create data-driven maps in as little as 10 minutes thanks to CARTO - watch now.