

Transcription
This customer story has been adapted from a presentation given at Discovery 2019.
Insurance Market Introduction
“Good morning, Mr. Technitis, I’m calling from Swiss RE, and your profile matches a job opening we have. What is reinsurance? It’s insurance for insurances, it’s a big thing.” I’m sitting in Santa Barbara, actually traveling down Malibu when I received this phone call. I come from a completely geo-informatic background so entering into insurance was a big thing for me. It was in the middle of chaos, knowing absolutely nothing about it, other than they need someone with geodata capabilities. For me back then insurance was an excel sheet, turns out that it’s not exactly like that. But why is it interesting for us?
We start from the basics which is the reinsurance market: 170 billion - that sounds big, but then the insurance market is even bigger: 3.8 trillion. Keep in mind that we can think of Swiss RE like a very nice set of pants, where you have a reinsurance pocket and an insurance pocket: these two are not allowed to communicate other than IT and money. The market itself shows very slow, not even steady growth, for the past eight years and it looks like it’s going to be like that for more time. What is more important is that 70% of the customers start acting like booking.com. (“I will read your review before I come to join my next insurance product”). On top of that, we have a huge change in law regulation: from IT to Internet to privacy, it’s extremely difficult to release new products into insurance right now. If there is not significant growth, you have difficulty maintaining your clients and you cannot release new products in order to increase your clients’ share. All that translates in a lack of trust from regulators to insurance companies, from insurance companies to the people and definitely from people to insurance companies.
This is where we try to do something about it, performing GDM (Geodata Modeling), we want to extend our geo-reach, to geo-enable our data, and we need to do that now. What we do is that we play with coordinates, we contextualize our data and we monitor our assets. These are the 3 main reasons that business comes to my desk. What we actually do is demystify capabilities, we tailor it for the purpose that the business wants and then we inspire. This is the most important part, we really try to inspire, not just solve something but to inspire through our solutions. With the example of satellite imagery, it becomes difficult to explain that we cannot solve everything with it. I decided to make a list of things that you can do based on remote sensing geo-intelligence, this list goes forever but not everything is relevant to insurance so I selected the ones that are relevant to insurance. There are a couple of which I would like to demystify the capabilities.
Predicting the abundance of mosquitoes and fuel prices
When you think of mosquitoes, you don’t think of insurance necessarily. But let’s consider the borders of Canada, where there are many mosquito attacks, almost a plague. There are so many mosquitoes around the lakes that a large number of animals get attacked by them. Think of a goat walking and then attacked by a cloud of mosquitoes, every square centimeter is filled up with mosquitoes. Animals die there and the interesting part, the geographic part, is that if you maintain the same temperature or elevate the temperature by one degree for one day at the lake, the population of mosquitoes doubles. You have doubled millions of mosquitoes just by a single temperature maintenance or increase. This is very difficult to put into a model but it’s very easy to calculate in real life. You have a set of information, you find the lake, you start calculating the humidity and temperature and you have a funny model that for me was two hours of work. That meant something to someone, which is apparently huge in Canada, that’s one demystification.
How about predicting fuel pricing? I know nothing about fuel pricing but what I do know is how to work with satellite imagery, looking globally at oil refineries and seeing if they have oil in them or not. Perhaps with interferometry like radar, you can calculate approximately how much is in there. I tried to find these balances around the globe and using historical data of the price, I saw that there was two to three months of lag, and then suddenly you can start to predict the price. I don’t know how, I don’t know why, but this is how I reached that point by __breaking it down to very simple geographic questions. __
These are the things that we do: try to take something complicated, and try to see if there are easy ways to go around it. Once you do that, then you come to the second problem, everybody comes to the desk asking for a Ferrari. They think the global economy can be predicted by remote sensing. What actually happens is that most of the people come for a Ferrari while they want to go on family vacations and this is a true example of my last presentation. Actually it was an underwriter, think of it as the 10 of us going to a broker in order to have insurance, then 1,000 brokers go to an underwriter. That underwriter is in Swiss RE and trying to give a price for all the rest. This person comes to me and asks for a very accurate calculation of damage after every natural catastrophic event in the US and wants to have it three hours after the event. You have a tornado, everything’s got damaged, they want to know the damage at every house three hours after the event.
“Is this possible? Yes it is. When can I have it? In two months. When can we start? Price tag is 1.2 million. That’s a bit too much. How much would you be willing to pay? We don’t know. Would you be willing to pay 600,000? It’s a bit too much still. How about if I decrease the accuracy of what we want to demonstrate? That could work. How about instead of three hours we go up to one week, not more than 10 days? Now that could work. Great, that will cost you 50,000. That’s perfect! The solution is for free, the 50,000 I’ll use it for another project.” This is how you start monitoring but what exactly is going on here?
Assessing business questions in insurance field
We came up with three very simple ways to assess the business questions: complexity, sensitivity, cost. What is best and when and how is going to be implemented is directed by these three requirements.
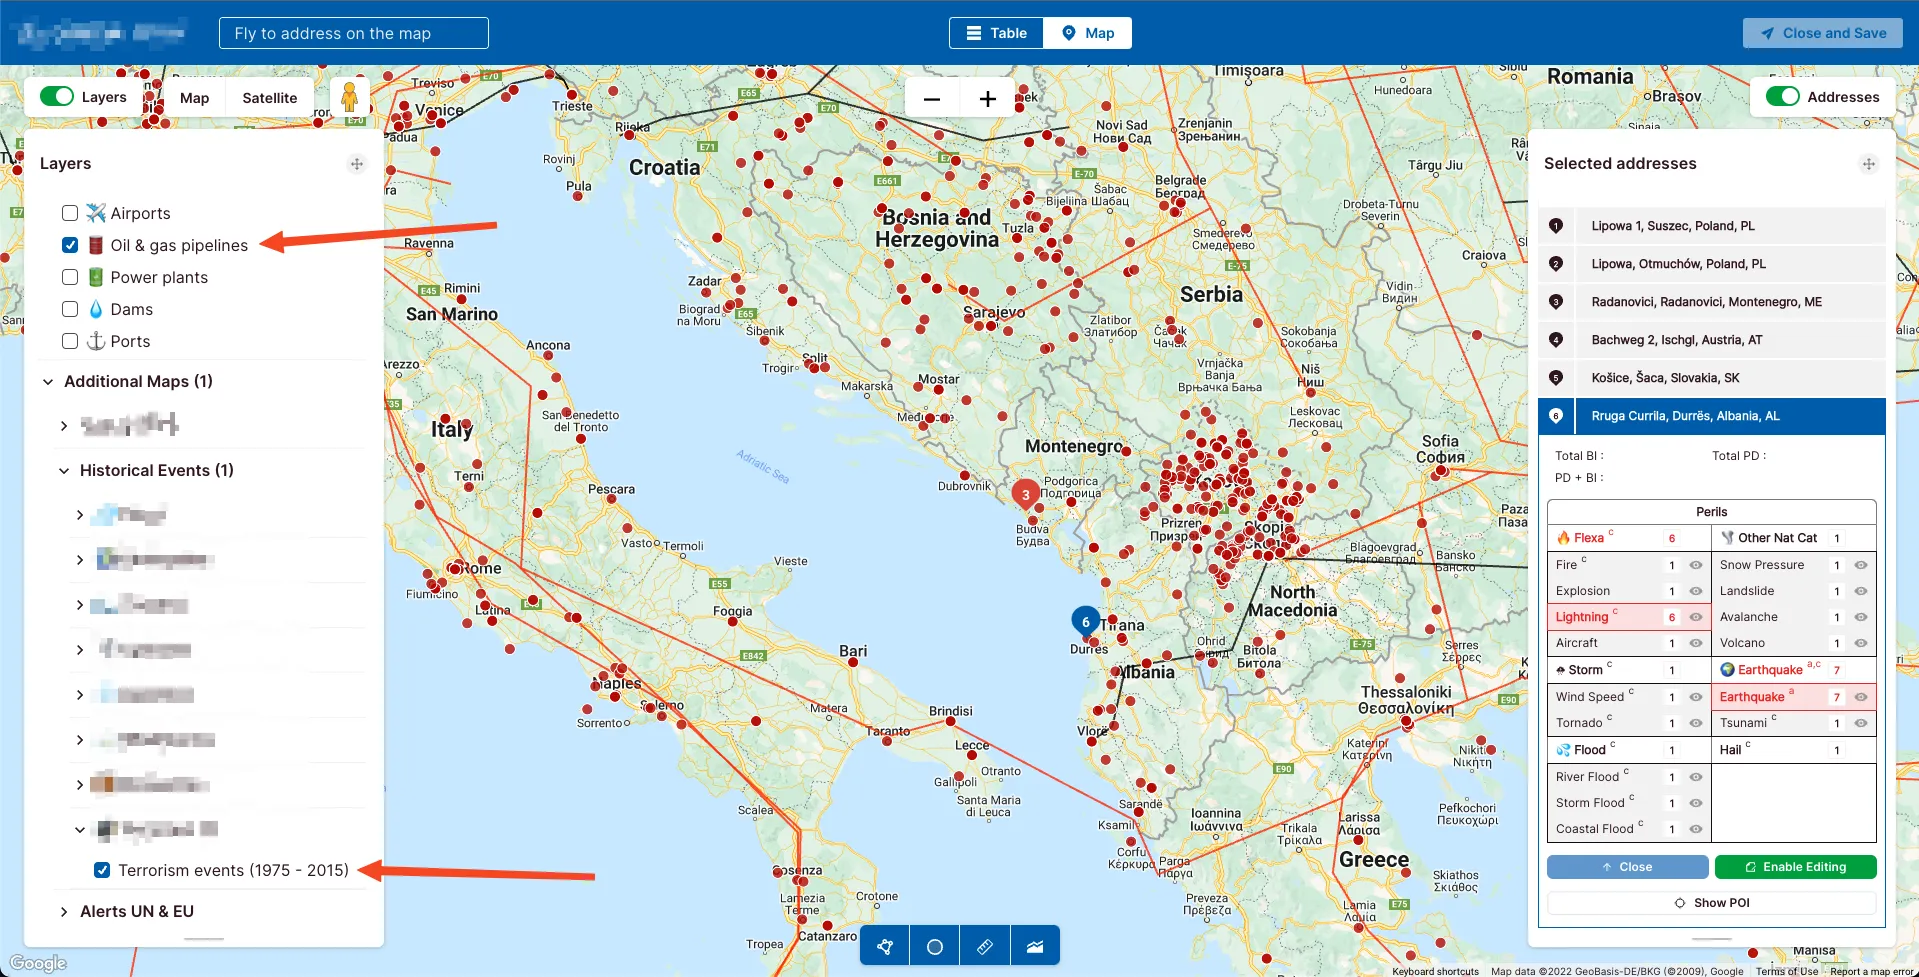
Let’s look at a very simple example, we have multiple satellite imagery trying to scale globally and we want to have very specific analysis on it. It’s not important what it is, it can be from crops to flood to population dynamics. What is important is that we need a tool that actually facilitates this process. You have three vendors that can fulfill data: IBM PAIRS, it’s the developers choice, it’s amazingly cheap disk, full continent for 10€, you have all the terabytes or petabytes of information. We have amazing business support and it comes with a very expensive fee.
Then you go to the Google Earth engine, amazing, unparalleled horsepower. It’s amazing to work on that, you just keep going, throwing things and it returns results in near-real-time. But if you want to deploy your machine learning training data, all your strips that you run, all the pipelines you run, everything is public. Can you handle that in an insurance policy firm setup? It is more difficult.
Then you have ExoLabs, a spinoff from the University of Zurich, which is a bunch of really motivated PhD IT students that put together amazing research. They deliver tailored results with pricing that corresponds to PhD salary so it’s very cheap, not very well documented but you have full support. Whatever they have, they will just give it to you in the best way they can. So developers select IBM, geoscientists, like myself, will work with Google Earth but then if you have to deploy your own data ExoLabs seems to be the perfect choice for clients. When a client comes to you, they don’t know about ExoLabs, they know about Google Earth and they don’t want to pay for IBM. This is a bit abstract, we need to formalize things and that brings us to the vendor assessment.
Vendor assessment
You have a specific tag line that you want to do: “Automated Nat Cat damage assessment based on Remote Sensing techniques.” You have a desk research and first contact, you have a lot of vendors to start with. Then you give them a PoC, they run it for a month, they deliver the results and then you move to a shark-tank process. Out of them, we select one, and then we run a proof of value.
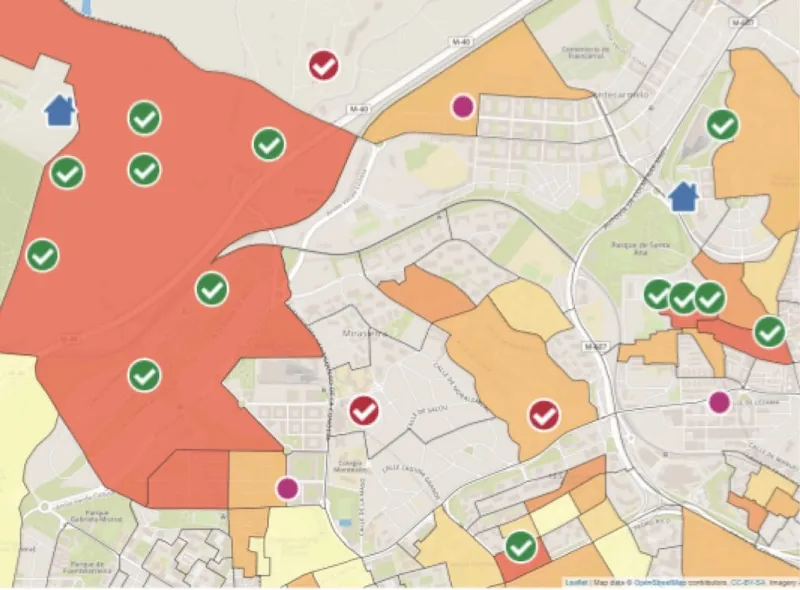
The first event was in Nebraska where flooding occured and we had a trigger that we wanted to cover. The trigger was not three hours but three days and we covered that in a way that it could be used by the underwriters. So discussions took place and this brought us to their actual inspiration part. While trying to detect the floods, I was playing around with a bit of fuzzy logic and trying to analyze and dissect the data. You have a map that we can see as well as the computer. I took the results, presented them in a different format and tried to approach business people. They looked at it and they said: “that’s interesting, let’s try to do something about it”. I explained to them the pipeline, we discussed the outcome and apparently what I was doing as crop identification, they moved it a step further and went to yield estimation. So we set that as day one. By day five, we had read everything online, we started to deploy all kinds of algorithms we had found, everything was quite interesting and all my geo scientists were quite happy. Then in week three, we had our first platform.
At this stage we used CARTO, which was very helpful and in week three we were already up and running. From week one to week three, is the length of time needed to get authorization for the cloud to get up and running. We were not working, we were just waiting for authorization and this is what happens with these kinds of setups. Week five, we started to implement more vendors, more open data, more applications, trying to become as agnostic as possible. By week eight we had our first big result, trying to analyze all of Brazil. We did it and actually this is a level of terapixel processing, quite significant for a company like us who are not a data company. We know that this is something big but we also know that it is something useful to business because we included them in that pipeline of creating it.
Then we tried to visualize that with Kepler and it was a good and free start but we decided that we need something far more professional and that’s where CARTO entered. We also saw that in order to deliver these insights to business it was not good enough to just visualize things - we gave them the API and the visualization and they liked it but didn’t know how to use it. So we gave them an email service to send the email with location and time, which fired up a VM, performed the classification, delivered a result to Dropbox and a link for them to download it - this was keyt. All the rest didn’t matter from the moment they saw the email connectivity. What I learned from this exercise was that all the people that come with a problem, tried to solve it yesterday and they need to solve it now. They become so competitive outside in the market, inside the same company, in order for its group to deliver results that the metrics are all short term. This is a bit difficult and not entirely unfair for geoproducts because it is a long term investment, you cannot have short term metrics. This is very important on the business model, how that impacts the model. The inspiring part is a way to motivate and cultivate people to create a new culture in order to start tackling these kinds of problems the way you should.
Fears & Needs
This is the wind of change: you have plenty of fears that help us: reputation risk, disruption risk, fear of missing out and competition. Reputation risk: if you’re working in the marine industry for example, you have vessels going around the world, you insure them and they go to the war zones. All this information is online and if us, as insurers, don’t take control of that then suddenly, we have reputation risks going on. Disruption risk: every new company or spin off can take a big chunk of the market. The fear of missing out: a new spin-off is about to start, how about investing before that? I literally had companies that came with their business plan on a napkin, asking for billions and I only marginally exaggerate on that. Then you have competition: you have two big companies that are fighting for the same share and trying to get the extra edge.
There is also a need to contextualise the data. You have tons of data, like historical data, you try to contextualize and try to make something more out of it. You try to scale up the solution, it’s not good enough anymore to solve something in a local Madrid neighborhood, you need to expand it to Spain, to Europe, to the whole continent. You need to be transparent, and try to bring back a bit of trust that’s been missing. All of this geointelligence and CIA helps in this process.
This is my favorite part, it is an ode to machine learning and machine messing. As we develop all these algorithms and try to control a bit of our extra 1% of accuracy and a little bit of better data, we often come into these kinds of setups. I had thousands of data points of all the crops in one specific area classified. It was the best data I’ve ever had, very proud of having this data that was going to bring them the edge against their competitors. I started working on that, the machine learning was really going south, the results were really bad and then I was trying to figure out what was going on. We were seeing interesting parallel lines and what was happening was that a farmer was going to their farm and clicking on his GPS to report that they had corn. Then the next farmer would go to their farm and do the same. The problem was that the farmers were in the truck as they were driving through the farm and pinging the GPS coordinates at the same time they were driving. We ended up having 10,000 pinpoints on the street which were classified as corn and attempting to train the model out of it. You can control the data and start removing all of these erroneous points but when you start developing the product you depend on this data, through a process of trial and error. When you receive the full data set it becomes very messy so trying to communicate back to the business why that is not really possible is tricky. That’s when we try to enhance our labels.
Human labeling for machine learning
Enhancing our label is like the label data you gave us is not good enough, how about going and trying to do something out of it? It’s the classic capture thing which we can use a company called Hive to demonstrate. For example, they ask you which pictures have cars in them and you click on the corresponding pictures. Potentially where this car is, you can also polygonize around the car. They have by now two million users, and they can fire up the pipeline really fast. Now how does that work in the real world? If you’re a student in Germany and you need to make some extra money on the side of your studies you can go to one of these companies called “wafer companies” who pay a lot of money for advertisement of their logo while a football match takes place. So if you see the Goodyear logo somewhere for some reason, they paid a lot of money to be seen on the TV. They put students to validate that the Goodyear logo was actually shown there. So imagine you have 10 students watching all the matches like that and clicking whenever the logo is shown.
Now imagine that in Formula 1 where things go really fast and logos are everywhere, a harder task. How about finding all the logos everywhere in Formula 1 in real-time? How are you going to do that? Two competitors survived this challenge, one was Google and the other was Hive. For Google the number was 40% coverage of the logos with 60% accuracy. And Hive with the manual workers behind it was 80% coverage with 39% accuracy. The real goal is to point out what is going on here, this is a machine learning algorithm based on the label data that took place with human interaction. This is something unseen before, it’s quite cool and we were trying to justify it in a business case and suddenly agriculture became a good business case and it works really well.
What actually happened in this setup is that insurance, a traditionally conservative business domain, accepted a person like me, many like-minded people that were quite entrepreneurial, quite geoscientific oriented but were trying to apply that in a business environment. They really gave us a small cloud of protection in order to get us started and at the end we started having some actions. We started using data and having behavioral analytics working with time series, aviation, crops, pandemics, marine, smart homes, and more. All these are projects tapped into the internal GDM, geodata-modeling and at the end what we do is geoenable our data and multiply our reach which is something quite important.
I would like to give a final comment to all the people that sit behind a terminal, somewhere in any geo-inspired location, it doesn’t matter if it’s CARTO or anything else. Every person that actually books a ticket for someone and every person that creates an algorithm that does something a bit better. That person creates a result that someone will see and if inspired by it then we start having better reach and it allows us to have more time to work on things that matter. Yes insurance is business but the value behind insurance is resilience - it’s about people. Being able to have this extra reach allows us to work with pandemics, allows us to work with things that affect people immediately, even though we don’t make money out of it. Please be sure that every little bit that we get is actually working towards that direction.