CARTO FOR DEVELOPERS
Accelerated geospatial app development, for the enterprise
Create scalable, map-centric applications with our powerful developer toolkit.


Cloud native
Process and visualize data directly in your lakehouse - no duplication, no compromise. Built-in enterprise-grade security included.

Rapid development
Accelerate development with the most comprehensive cloud-native development toolkit available, including APIs, frameworks, and templates.

Cost-effective
Eliminate backend APIs and ETLs. CARTO runs natively on your stack, saving you time, effort, and infrastructure costs.
Built for developing powerful spatial applications in your cloud

Cloud Native
Unmatched performance and scalability for visualizing spatial data hosted in the cloud.
APIs & Frameworks
APIs, libraries and development frameworks that speed up location-based application deployment.
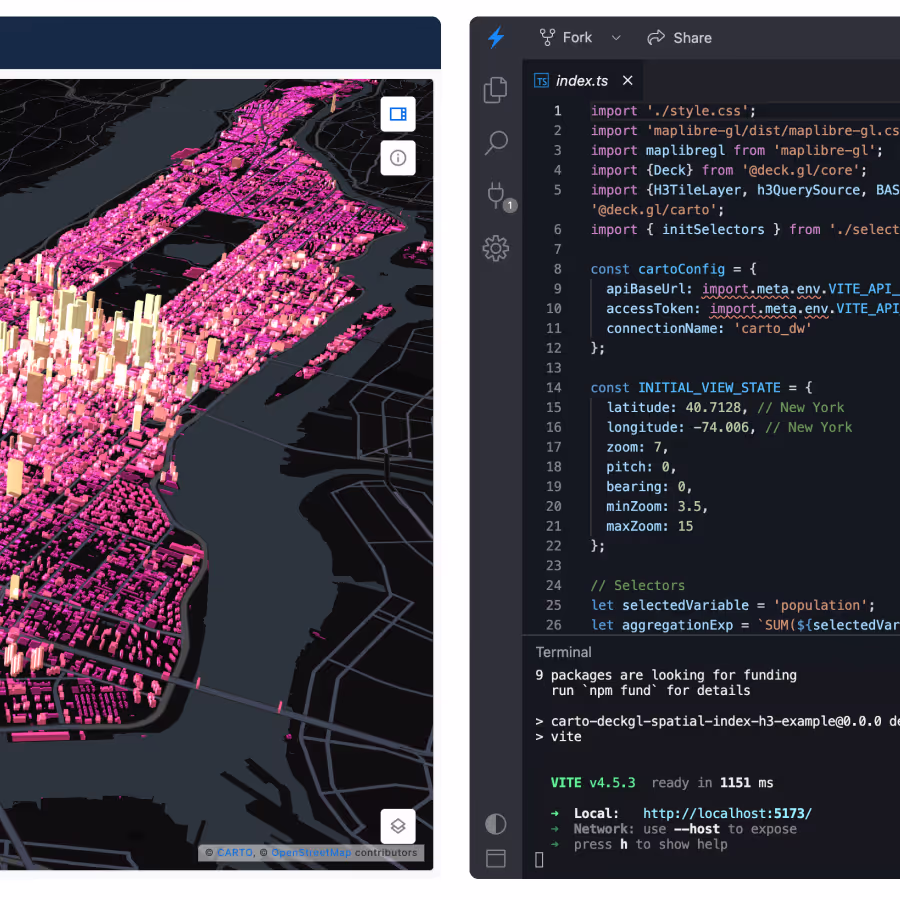
Visualization tools
Visualization using deck.gl, web-GL technology and GPU rendering for unparalleled performance.
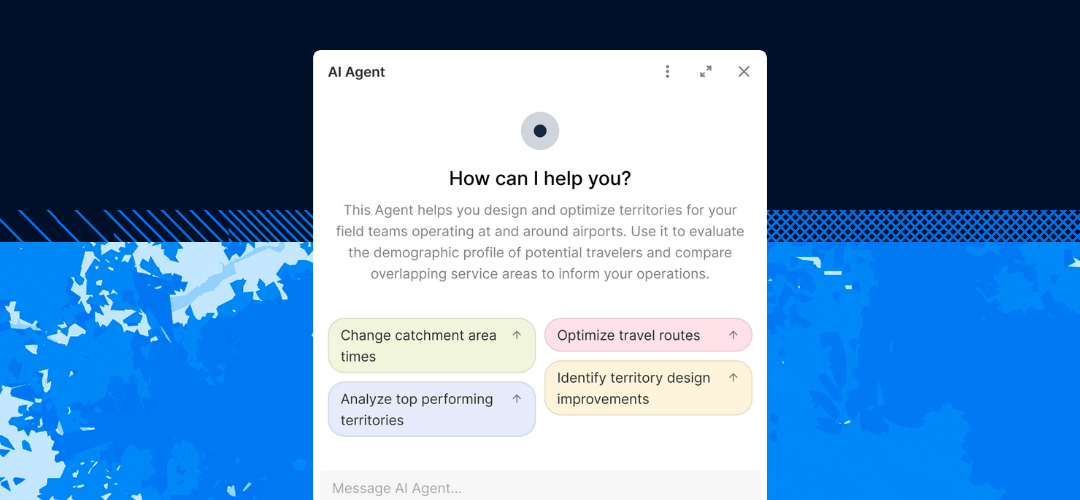
Widgets & Charts
Easily build your own customized charts and other visual data components that stay fully synchronized with the map.
Tilers
Our Tiling technology dynamically renders massive geospatial datasets without any intermediate databases.
Basemaps
Integrate quality basemaps into your spatial apps to visualize data with clarity and precision.
Builder
Builder lets you to rapidly design maps and reference them in your code and applications.
Data
Access more than 12,000 geospatial datasets to enhance your spatial analysis and applications.
A fully cloud-native platform
Eliminate ETL pain and data duplication by using CARTO to build your app entirely inside your lakehouse - BigQuery, Snowflake, Redshift, Databricks, Azure, and more.


Scale without compromise
Tired of performance issues when working with big data? Our dynamic tiling - combined with deck.gl - delivers blazing-fast performance and seamless scalability, all inside your lakehouse.

Your apps, your way
Don’t get backed into a framework corner. CARTO works flawlessly with any JavaScript framework or vanilla JS, letting you build spatial apps in the way that works for you.


Applications built with CARTO


CARTO for Site Selection
An end-to-end solution for site selection and planning that includes data, advanced visualization and embedded models to pinpoint the best locations for network expansion.
-poster-00001.jpg)
CARTO for OOH Advertising
A cloud-based Location Intelligence platform that combines outdoor media inventory with 3rd party data, street-level brand affinity and targeted consumer audiences.

CARTO for CPG
An end-to-end solution including data, advanced visualization and embedded models to segment trade partners and pin-point the best locations for brand expansion.

Vodafone Analytics
A data monetization solution that provides insights into human mobility patterns, based on mobile network events, to drive better decision-making in Tourism, Retail and Real Estate.

Supply Chain Solutions
Powerful Location Intelligence applications that reduce costs & improve visibility through spatially optimized supply chain operations and fleet management.

Addressing City Congestion
Location Intelligence applications that integrate crowdsourced and open traffic data streams to gain real-time mobility insights.

Gloval Analytics
Location analysis for Real Estate decision-making, using key metrics to obtain a realistic view of market behavior, and rapid online property valuations.
Frequently asked questions
Yes! Our 14-day free trial includes unlimited access to our developer platform. Sign up and get started today!
We designed the CARTO platform to handle datasets of all sizes with impressive performance, cost effectively, on any modern device. Billions of points, polygons, and lines. You can find many examples in our blog.
No, CARTO also offers rich analytical capabilities, including Workflows, our low-code analysis design and automation tool, and the Analytics Toolbox, a set of functions and procedures you can use directly in your cloud data warehouse. We also offer a range of APIs, such as our SQL API, the LDS API (for geocoding, isoline calculation, routing...), or the Imports API, so that you can build the perfect application your organisations needs.
While open-source tools are great (among other major contributions, we're part of the steering committee for deck.gl) in most cases they're not fully ready to cover the needs of large-scale developments and the enterprises behind them.
CARTO drastically reduces development time by offering solutions that integrate:
a) with your existing cloud and data architecture
b) with any volume of data
c) with your enterprise Single Sign-On and identity management systems
It also reduces maintenance needs and exposure: the CARTO team are constantly improving the platform while you focus on your business. Our Support and Customer Success teams will proactively and quickly complement your team with their deep geospatial expertise, as required.
No - CARTO works entirely inside your cloud data warehouse (BigQuery, Snowflake, Redshift, Databricks, etc.), so your data stays where it lives. No ETLs required.
CARTO is framework-agnostic. You can build spatial apps with Vue, Angular, or even vanilla JavaScript and TypeScript.
No backend required. Our APIs handle mapping, SQL queries, authentication, and data imports - so you can focus on building your app, not maintaining infrastructure.
Yes. CARTO maps and components can be seamlessly embedded or integrated into your existing applications or dashboards.
Easily! Workflows run natively in your cloud data warehouse, and can be triggered directly from your app using simple API calls. This allows for seamless, automated spatial analysis behind the scenes.
Yes. Developers and non-developers can use Builder to experiment quickly and visually with data, styling and interactivity - CARTO provides a set of tools for developers to integrate what you’ve built as a foundation in your production app.