Dynamic Tiling: The key to highly performant cloud-native maps


Nowadays most enterprise organizations are building their data applications on top of a cloud-native technology stack (e.g. data warehouses, data lakes, etc.). For many of these apps, including interactive maps to visualize and analyze large amounts of geospatial data is a pivotal business requirement, but a complex challenge for the development team.
Rendering geospatial data on digital maps has been well-addressed for smaller datasets, with several technological solutions available, such as PostGIS. However, the challenge arises when dealing with extensive data volumes, as ensuring optimal map visualization performance can become increasingly complex. More so, if you need to dynamically visualize data directly from cloud data warehouse platforms, such as BigQuery, Snowflake, or Redshift, in a truly cloud-native architecture. The conventional approach of transferring and hosting data in intermediate mapping infrastructure introduces inefficiencies, additional costs, and overcomplicates data integrity and governance.
In this blogpost we will provide an overview on how CARTO has been working to overcome these technical challenges, and how we can enable you to seamlessly integrate interactive maps in your cloud-native applications, without compromising on performance or having to build complex ETLs.
The conventional approach of transferring and hosting data in intermediate mapping infrastructure introduces inefficiencies, additional costs, and overcomplicates data integrity and governance.
Tiling and mapping on the web
In the GIS/mapping world, the solution to render data on digital maps is called “Tiling”. In Google Maps, as an example, data is sent to your browser/application and is loaded progressively based on your location and your current zoom level on the map. A couple of years ago, CARTO launched a set of tilers allowing users to produce what are called “pre-generated tilesets”, directly on top of cloud data warehouse platforms. As illustrated below, our technology allows users to generate vector tilesets for visualizing very large datasets natively in cloud data warehouses by executing simple SQL queries. You can find more about how to create pre-generated tilesets with CARTO in the documentation of our Analytics Toolbox for BigQuery, Snowflake, Redshift, and PostgreSQL.
CALL carto.CREATE_SIMPLE_TILESET(
 ‘SELECT geom, height, category FROM nycbuildingstable’,
 ‘MYDB.MYSCHEMA.nycbuildings_tileset’,
 ‘{
   “geom_column”: “geom”,
   “zoom_min”: 0, “zoom_max”: 6,
   “properties”: {
   “height”: “Number”,
   “Category”: “String”
   }
 }
);
Click here to open the map in full screen!
Although crucial for visualizing vast amounts of spatial data, tilesets have some intrinsic limitations that make them unsuitable for all types of map visualization. A tileset is a pre-generated data structure, which means that you have to pre-compute the tilesets and then load them in your maps for visualizing the data. But, what if the underlying data changes? What if a filter or a user interaction in your application generates an entirely new map that you can not pre-generate? In many of these scenarios you cannot pre-generate tilesets for all of the data that you want to visualize on your map. To overcome this limitation, we have developed and implemented Dynamic Tiling.
Introducing Dynamic Tiling for the modern data stack
Currently, most enterprise organizations are in the process of migrating their data apps and geospatial solutions to run on cloud-based services, to benefit from the unrivaled scalability, flexibility and cost-efficiency gains. It is core to CARTO to provide these organizations with the most advanced cloud-native geospatial technology, and to make them successful in their stack modernization journey. To achieve that, it is fundamental to provide a technological solution to dynamically render large amounts of geospatial data on web maps and to allow users to interact with it without forcing them to move the data out of where it lives. For this reason, CARTO’s Dynamic Tiling implementation is unique in the sense that you do not need to ETL your data into any other mapping service so it can be then rendered on maps; our technology works natively with your data directly in your data warehouse, no intermediate databases or servers are required.
CARTO’s Dynamic Tiling implementation is unique in the sense that you do not need to ETL your data into any other mapping service so it can be then rendered on maps; our technology works natively with your data directly in your data warehouse.
Dynamic tiling is a mechanism that progressively generates tiles on demand based on the SQL queries that users push down to their cloud data warehouse. This only retrieves the data needed to render the map; instead of instantiating the map with all the data from the source, independently of where the map is centered and its resolution level (i.e. what we call, document mode). Back in the day, CARTO added support for a similar type of dynamic tiling over PostGIS, and today we have extended this to make it available on top of all modern data stacks, including BigQuery, Snowflake and Redshift.
Access the ultimate guide to navigating the new geospatial landscape. Download the free report: Modernizing the Geospatial Analysis Stack today.
How does Dynamic Tiling work?
With CARTO, you don’t need to be a geospatial expert to develop a web application or build an interactive dashboard that analyzes data on a map. Creating a map leveraging CARTO’s technology and deck.gl is as simple as adding a ‘CartoLayer’ layer in your Deck class, as showcased in the snippet below. For more details on this, you can check this guide on how to build a public application.
// This is how to add your SQL layer. "my_connection" is a live connection to BigQuery, Snowflake, Redshift, Databricks, PostgreSQL or the CARTO Data Warehouse, that you first created in the CARTO platform.
deck.setProps({
 layers: [
   new CartoLayer({
     id: ’layer’,
     connection: ‘my_connection’,
     type: MAP_TYPES.QUERY, // this is telling CARTO to retrieve tiles dynamically starting with a SQL query
     data: ‘SELECT * FROM my_dataset WHERE conditions’,
     pointRadiusMinPixels: 3,
     getFillColor: [200, 0, 80],
     … // the rest of your styling properties!
   })
 ]
})
With this, the CARTO platform will then know how to retrieve the different tiles to render the data on the map based on the actions of the end-user, and with a mix of front-end back-end technology.
As illustrated in the diagram below, after the initial request, CARTO will first instantiate the map, obtain metadata about the data sources, and generate a vector tileset end-point. Then, when the map is loaded in the user’s web browser, tiles start to get requested on demand progressively. At that point, CARTO generates highly optimized SQL queries in order to retrieve data from the cloud data warehouse, and finally encode it in a format that is suitable for rendering by the GPU.
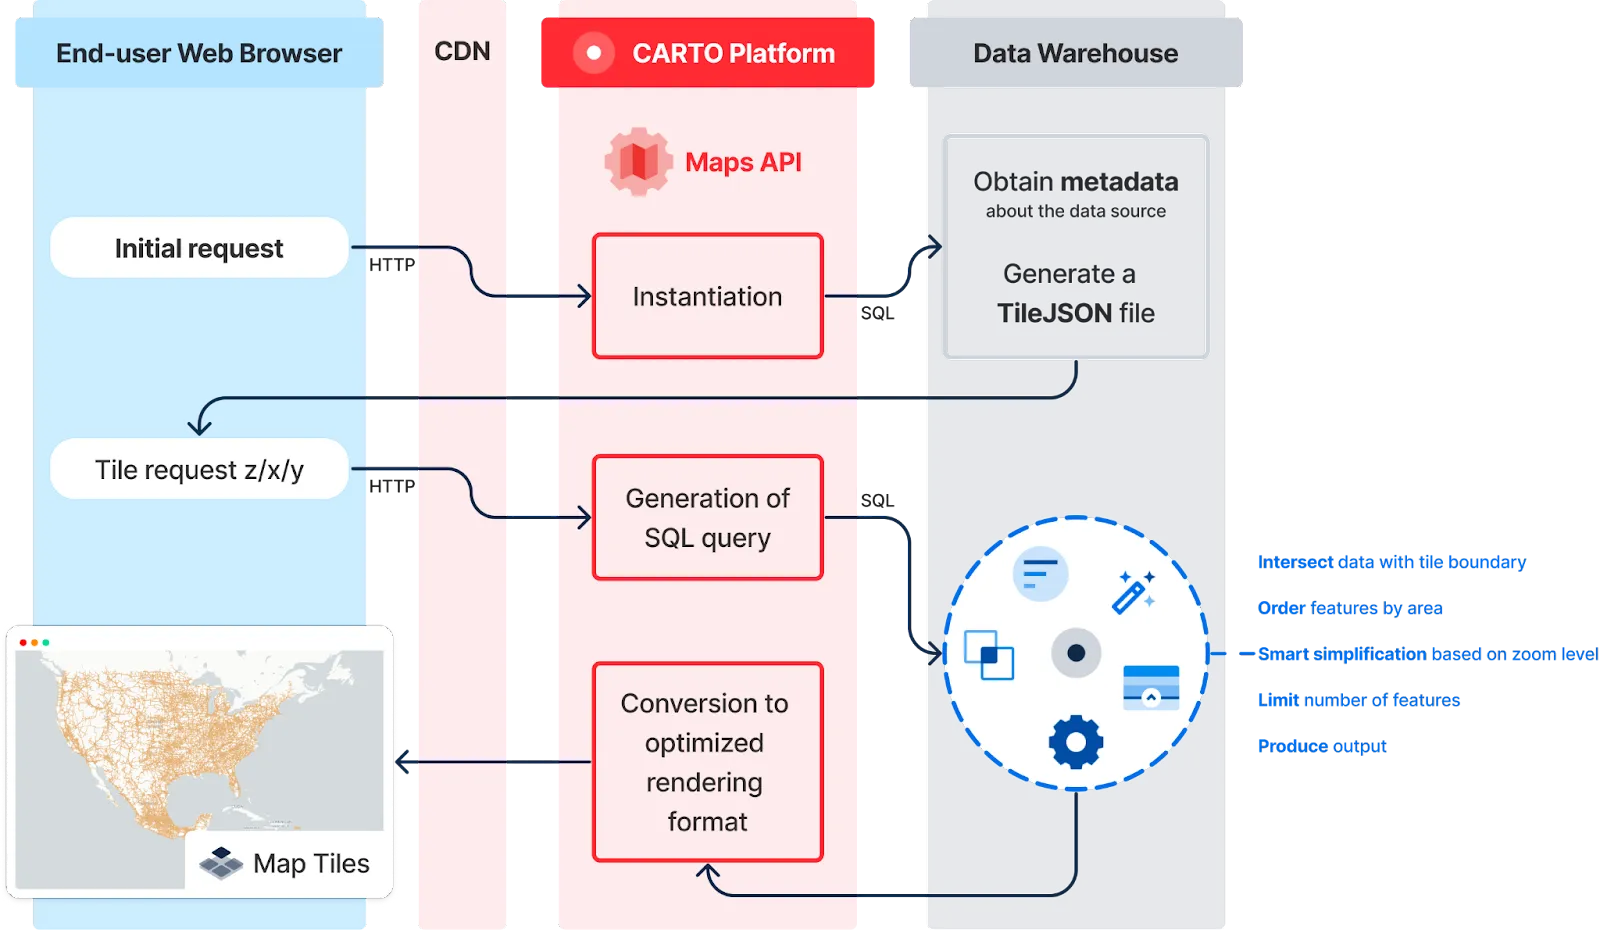
As you can see, there is a back and forth between the browser, CARTO and the cloud data warehouse. This is needed in order to obtain the effective amount of data for each tile. And in that last step, a lot of things happen: like using intersections, calculating the area of the features, aggregating where possible, simplifying geometries to the tile resolution, etc. All that is necessary to obtain a tile that is representative of the actual data, that is returned fast and that it does not cause an unnecessarily high compute cost using the data warehouse. And by the way, these steps are all very specific to each data warehouse, so CARTO has had to adapt the different techniques to run dynamic tiling on each of them.
Optimized for high performance and large amounts of data
As previously mentioned, one of the biggest challenges with Dynamic Tiling is the need to - on the fly - determine what features should be added to the map tile or dropped, without jeopardizing the purpose of the visualization and preserving a high quality user experience. Moreover, doing this in an agile, fast, and simple process that can be executed in a matter of milliseconds so users can have truly lag-free map experience. Another big challenge when implementing a Dynamic Tiling mechanism is making sure it does not overload the cloud data warehouse with too many requests, forcing users to have complex queuing systems and query cancellation policies.
CARTO’s implementation overcomes these challenges with different strategies that leverage the capabilities of each data warehouse by making use of the most adequate native functions available. Limiting the number of features that are included in the tiles is a crucial requirement to boost performance and to prevent processing, transferring and rendering more data than is actually necessary. For example, if you are rendering a map at a global view, it is not necessary to include a polygon that represents a 5-min walking area around a point in your tiles; a polygon is simply not visible at that scale. This is what we call “feature dropping”.
For large datasets of point data, we dynamically aggregate data into a Discrete Global Grid of varying resolutions depending on the zoom level; which lets us to keep the tile size under control in a predictable way and significantly reduces the amount of data that is sent to the map, maximizing query performance and rendering speed. Note that we aggregate the points in each tile only on the map visualization, decoupling from the KPIs represented in the interactive widgets and filters, so as to allow users to interact with the data without affecting its integrity. In the example below, we are rendering 11.3 million points (pick-up and drop-of locations of taxi rides in NYC) using dynamic tiling, with data sitting on a cloud data warehouse.
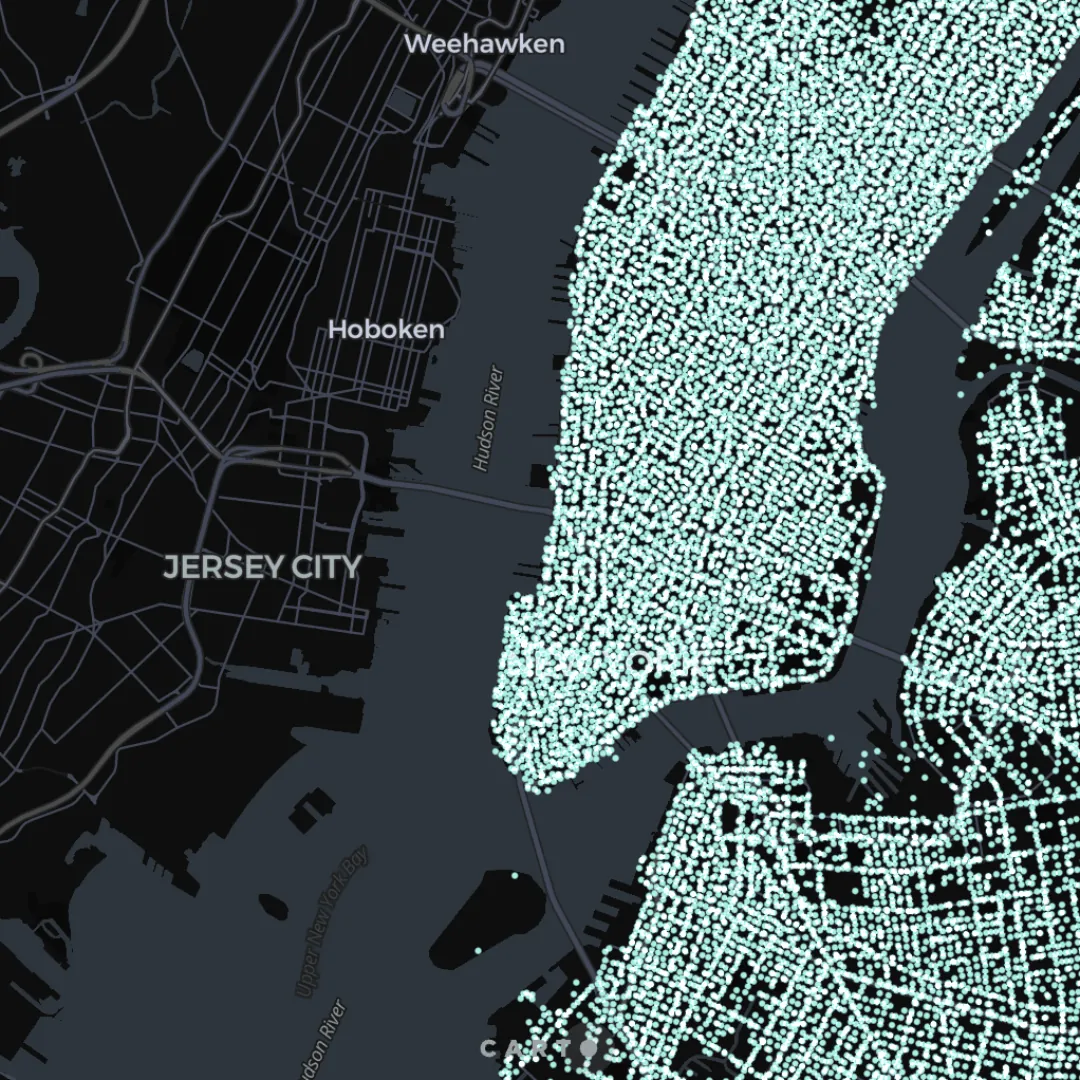
Click here to open the map in full screen!
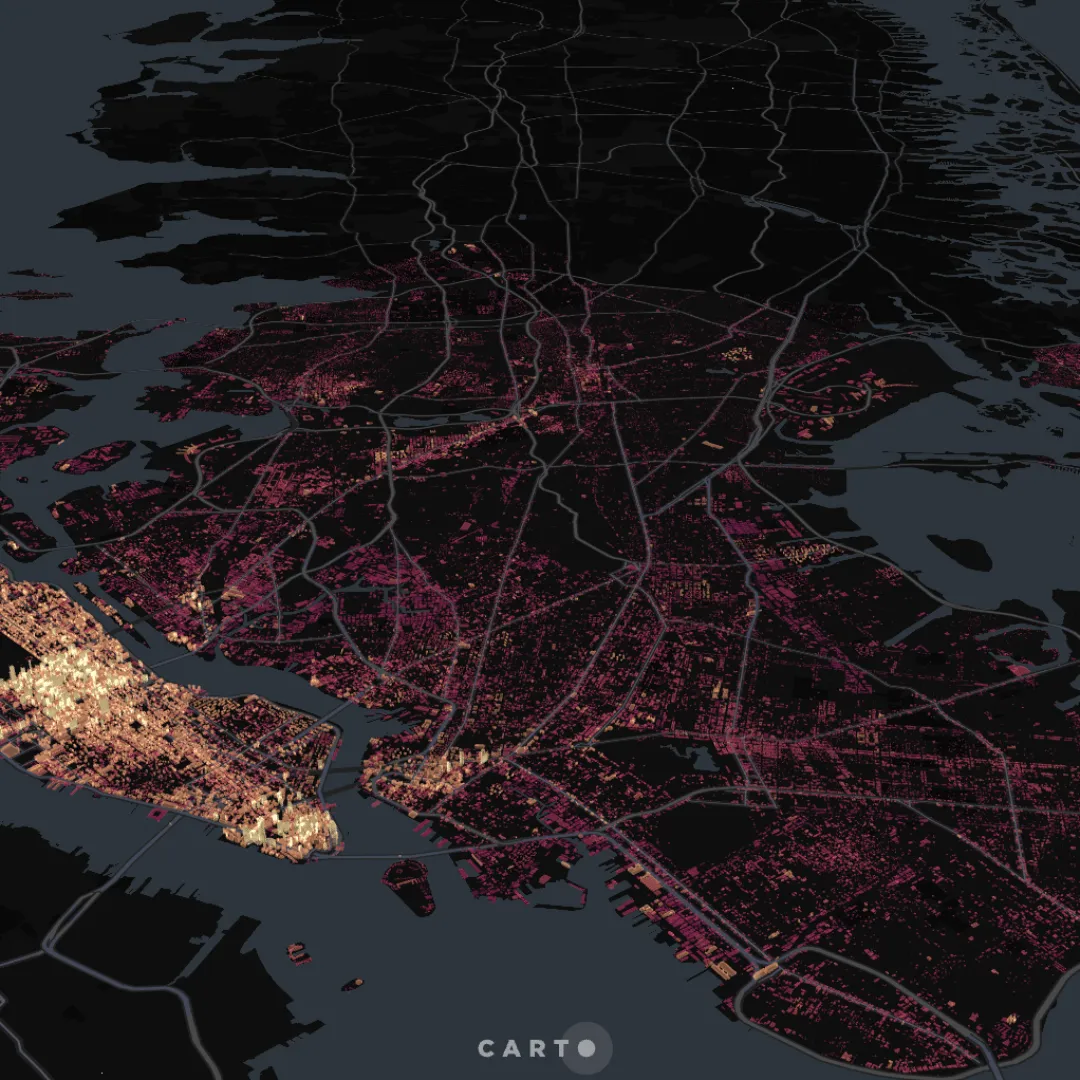
For datasets including polygons and lines, our Dynamic Tiling implementation follows a slightly more complex approach. Larger features are prioritized over smaller ones, as they are more visible at any zoom level. Therefore in order to ensure an optimal performance, we rank features based on size, and then we apply a level of simplification that is dependent on the zoom level; this process removes invisible details and reduces the size of the data significantly. We finally apply a limit that controls the number of features per tile that are transferred to the front-end for rendering. The following map is rendering a table with 49.5M polygons (OpenStreetMap building footprints) natively from a cloud data warehouse.
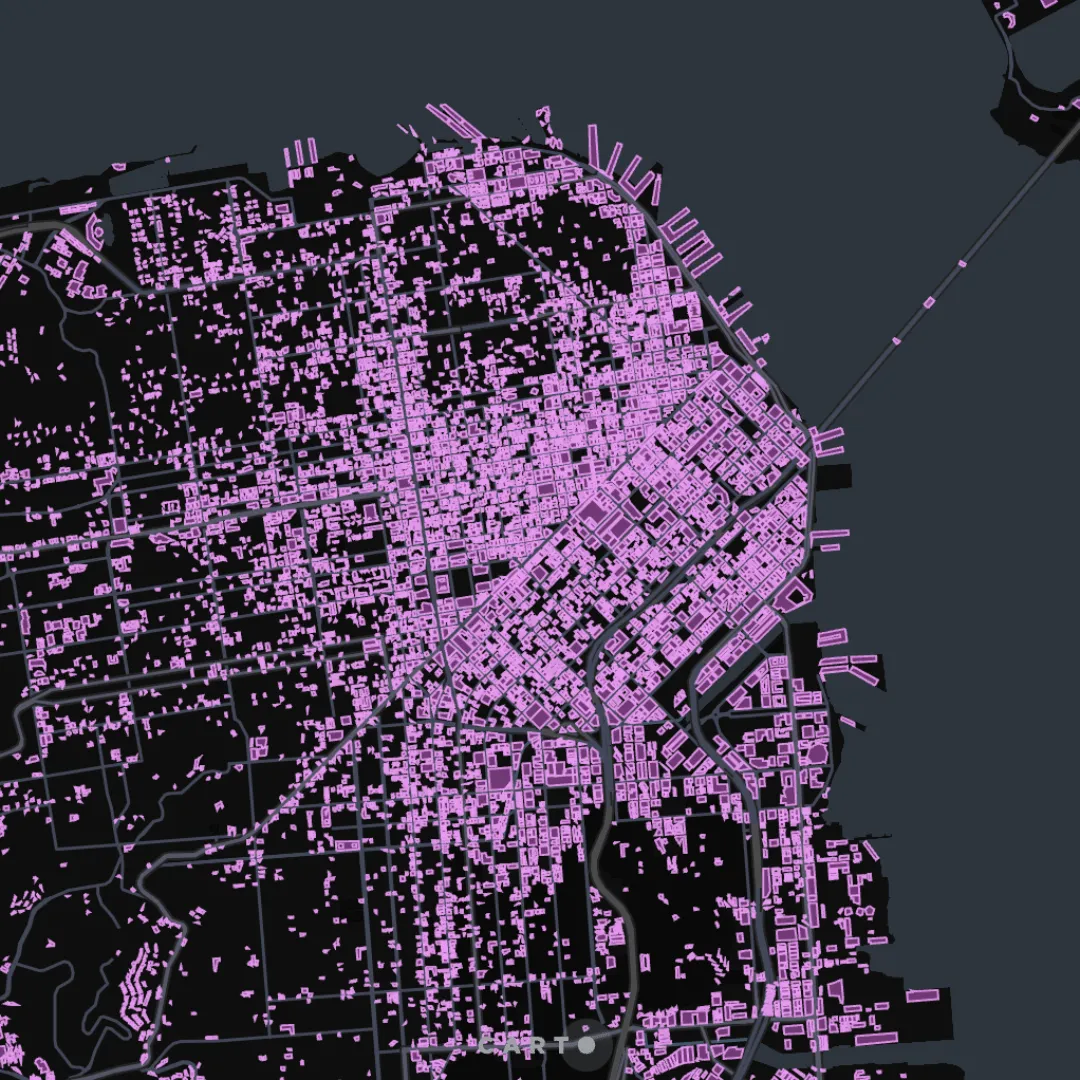
Click here to open the map in full screen!
Finally, providing a Content Delivery Network (CDN) ensures that the same data is not processed multiple times, reducing unnecessary computing load in the data warehouse while taking into consideration that the data may have been updated. CARTO handles this with different caching strategies depending on the nature of the data source. Data resulting from applying SQL queries to your data sources are considered point-in-time extractions and cached for a year. If a tile has already been requested, it won’t need to be processed again. Then, full tables are cached differently depending on the data warehouse platform they sit on, caching the data for a minimum amount of time and not re-processing the data unless the source table has been updated.
In the latest version of our platform, we made a revisited implementation of our Dynamic Tiling technology available in which we have made updates to all of these areas. These have resulted in much faster maps, more intelligent feature dropping that keeps the integrity of your data visualizations, and a more efficient use of data warehouse resources.
How far can it go? With the fast-paced evolutions of the cloud data warehouse platforms and CARTO, we can’t yet know the limits of this technology, but what we know for sure is that it can go very far, as you can see with this last example, visualizing 2.7 BILLION points with dynamic tiling!
Try this yourself!
Producing tiles dynamically on top of the modern data stack is a crucial component for developing cutting-edge geospatial applications. At CARTO, we have spent a lot of time optimizing this process for the different data warehouse platforms so you don’t need to worry about it, and you can focus on ensuring your users l have the best application in their hands to turn spatial data into truly actionable insights.
Would you like to try out these features for yourself? Sign up for our free 14 day trial or book a demo with one of our specialists.