Power 3D Maps with Google Maps Platform, CARTO & deck.gl


The use of 3D visualization can add a whole new dimension to your analysis and create much more immersive and engaging user experiences, especially for key telecom and sustainability use cases. However, implementing 3D map visualizations can be challenging, particularly when it comes to gathering accurate data and guaranteeing performance directly in the web browser. That's why we're excited to share that CARTO has teamed up with Google Maps Platform to bring 3D visualization features to deck.gl and CARTO.
This collaboration offers exciting possibilities for those looking to take their data visualization to the next level. In this post, we'll explore the importance of 3D visualization and dive into an example that showcases the importance of vegetation for cities.
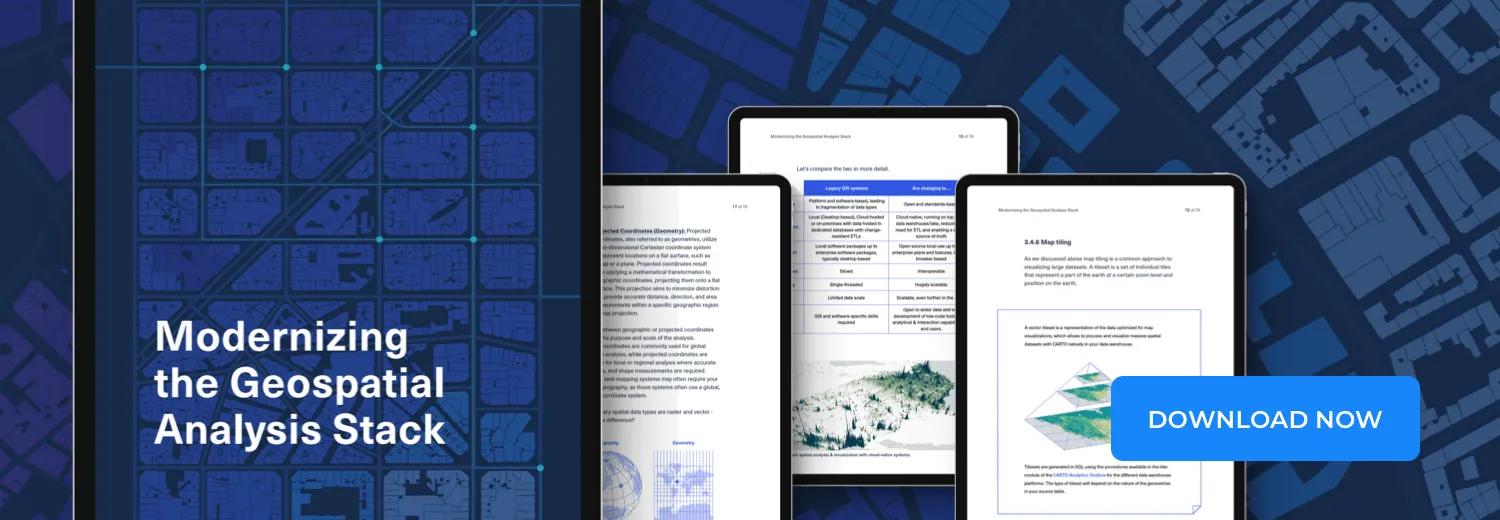
Access the ultimate guide to navigating the new geospatial landscape. Download the free report: Modernizing the Geospatial Analysis Stack today.
Announcing support for Google’s Photorealistic 3D Tiles
Google Maps Platform has opened up their stunning photorealistic data for use with the OGC standard for 3D visualization, available in over 2500 cities across 49 countries. This is a game-changer for those looking to create engaging data presentations. Google Maps are renowned for their beauty and detail, and now this geodata product is available for use in a wide range of 3D visualization projects. The results are truly breathtaking, and we're excited to see the amazing projects that will come out of this collaboration.
CARTO, deck.gl and Google Maps Platform have been collaborating on the integration of Photorealistic 3D Tiles into deck.gl. One of the key updates that we have worked on has added a new terrain extension to allow the visualization of any deck.gl layer on top of Google’s 3D Tiles.
Although deck.gl previously had support for Tile3DLayer, it couldn’t be combined with any other layer in 2D in the same visualization. The new TerrainExtension renders otherwise 2D data along a 3D surface. For example, a dataset of 2D buildings can be overlaid on top of the 3D Tiles. The re-positioning of geometries is performed on the GPU.
However, since the launch of version 8.9, deck.gl now seamlessly aligns terrain, making it effortless to overlay other data into the Tile3DLayer. It’s as simple as this:
     const TILESET_URL = `https://tile.googleapis.com/v1/3dtiles/root.json`;
     new deck.DeckGL({
       ….
       layers: [
         new deck.Tile3DLayer({
          data: TILESET_URL,
          loadOptions: {
           fetch: { headers: { 'X-GOOG-API-KEY': GOOGLE_API_KEY } }
          },
          operation: 'terrain+draw'
	  }
         new deck.GeoJsonLayer({
           data: https://,
           getFillColor: [254, 246, 181]
           extensions: [new deck._TerrainExtension()]
         })
       ]
    })
This improvement opens up many new possibilities for users to create more intricate and detailed visualizations with deck.gl by using 3D Tiles and overlaying any deck.gl layer on top. That’s an entirely new world of visualization possibilities! Now let’s look at an example use case for this type of analysis.
The importance of vegetation for cities
Vegetation plays a crucial role in cities, providing significant environmental, economic, and social benefits. It helps to purify the air, regulate temperature and humidity, and reduce the urban heat island effect. Additionally, it reduces energy costs for cooling and heating and also provides aesthetic benefits by enhancing the beauty of urban areas.
Our CARTO story map brought to you in collaboration with Google Maps Platform and deck.gl illustrates the relationship between urban vegetation and land surface temperature. The story map centers on the analysis of vegetation in Prague, Czech Republic. 3D maps show the locations in Prague with a high density of trees and how this vegetation coincides with areas of lower temperature. Evidence that vegetation cools their surroundings by providing shade and retaining more moisture than concrete and buildings.
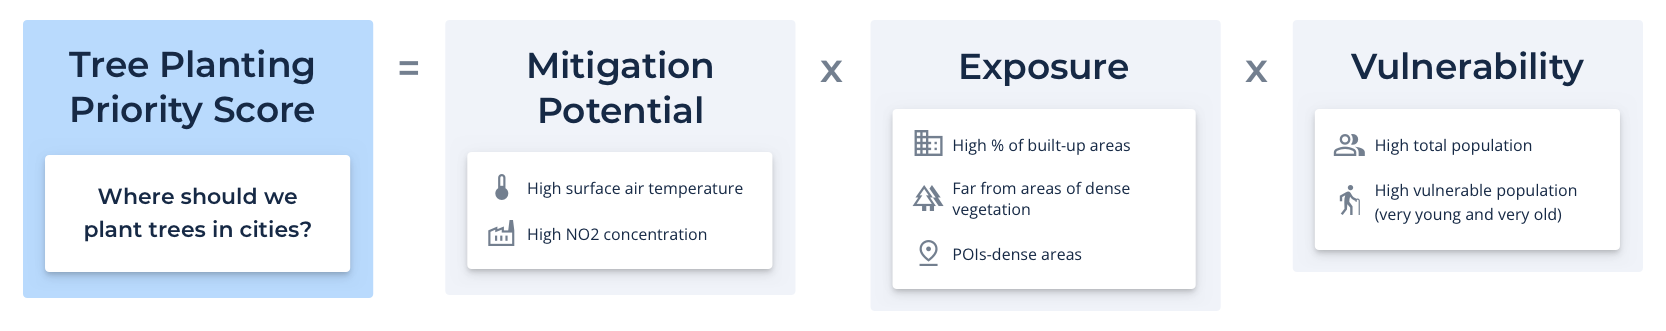
With the 3D capabilities of deck.gl, we can visualize analysis layers on top of Google’s Photorealistic 3D Tiles to better determine where to plant trees in cities. Our Tree Planting Priority score identifies the best places to plant trees in Prague, based on the modeling of multiple datasets that take into account air temperature, NO2 concentration, % of built-up areas, points of interest, distance to areas of dense vegetation and vulnerable populations. Each building is assigned a score, representing the level of priority to plant trees in that area.
As demonstrated in this example, with the latest advancements in this space it is now possible to use massive datasets in BigQuery and gain a much more immersive 3D context on a truly global scale. Let’s dive into exactly how this can be done.
How was this story map built?
Our story map was built using various sources of public data that you can check in the About section of the map. We used CARTO workflows, our no-code visual workflow design & automation tool, for two main purposes:
- To create a geospatial ETL to ingest the data into Google BigQuery and run basic data transformations.
- To build the Tree Planting Priority score to determine where we should plant trees in cities.
Once the data was ready, we used CARTO Builder to create the maps used in the story. These maps were later embedded in a web application using CARTO for deck.gl with the Photorealistic 3D Tiles to give more realism to our visualizations.
In the near future, we will publish a blog post with details of the geospatial analysis steps used to calculate the Tree Planting Priority score.
Get started with 3D visualizations for your use case
Ready to take your data visualization to the next level? Try CARTO with a free 14-day trial and experience the power of 3D visualization in action. For more information on Google’s Photorealistic 3D Tiles read the announcement here.