Overture Maps data now on the cloud: how to use it with CARTO


Overture Maps data is one of the most valuable topographic datasets for Spatial Data Scientists. Global in scope and updated monthly, analysts can access a wide range of data which is standardized across administrative boundaries. Built from a range of sources - predominantly OpenStreetMap - the data includes localities, administrative boundaries, transport nodes and buildings.
The catch? Well, the Overture Maps buildings dataset alone is made up of over 2.3 BILLION features. That’s one heavy dataset, making it difficult to access and use - until now!
We’ve been working with Overture Maps, Google Cloud & Snowflake to solve this problem and in April 2024, we announced that you can now access Overture Maps data seamlessly in Google Cloud’s BigQuery and Snowflake! Users can effortlessly tap into all Overture Maps data themes without the need for ETL processes, directly linking to the data via SQL queries and CARTO Workflows. Maintaining the original schema closely, updates align with Overture Maps's monthly releases.
So… how can you leverage Overture Maps data for your geospatial use case? In this blog post, we’ll explore 5 different ways to incorporate this invaluable data into your spatial analysis.
Why this matters
In its native format, Overture Maps data is published in GeoParquet files hosted on S3 and Azure blob storage. This makes it very easy for nearly anybody to access this data - however at 200 gigabytes the data can be very difficult to work with at scale. To make use of the entire global extent of the data, organizations can benefit from a fresh, cloud-native alternative approach.
Here's where we come in! Leveraging CARTO's data sharing capabilities, organizations can now seamlessly tap into this dataset from the cloud without the headache of data migration. This means they can integrate it effortlessly with their existing organizational data, with credible global data available from one centralized source.
Keep reading to learn how!
How can I access Overture Maps data on the cloud?
CARTO’s cloud-native capabilities mean that you can seamlessly access Overture Maps’s data without any need for onerous ETL processes. You’ll need a CARTO account to do this - if you don’t have one you can sign up for a free 14-day trial here.
From there - accessing the data is easy! Your options are:
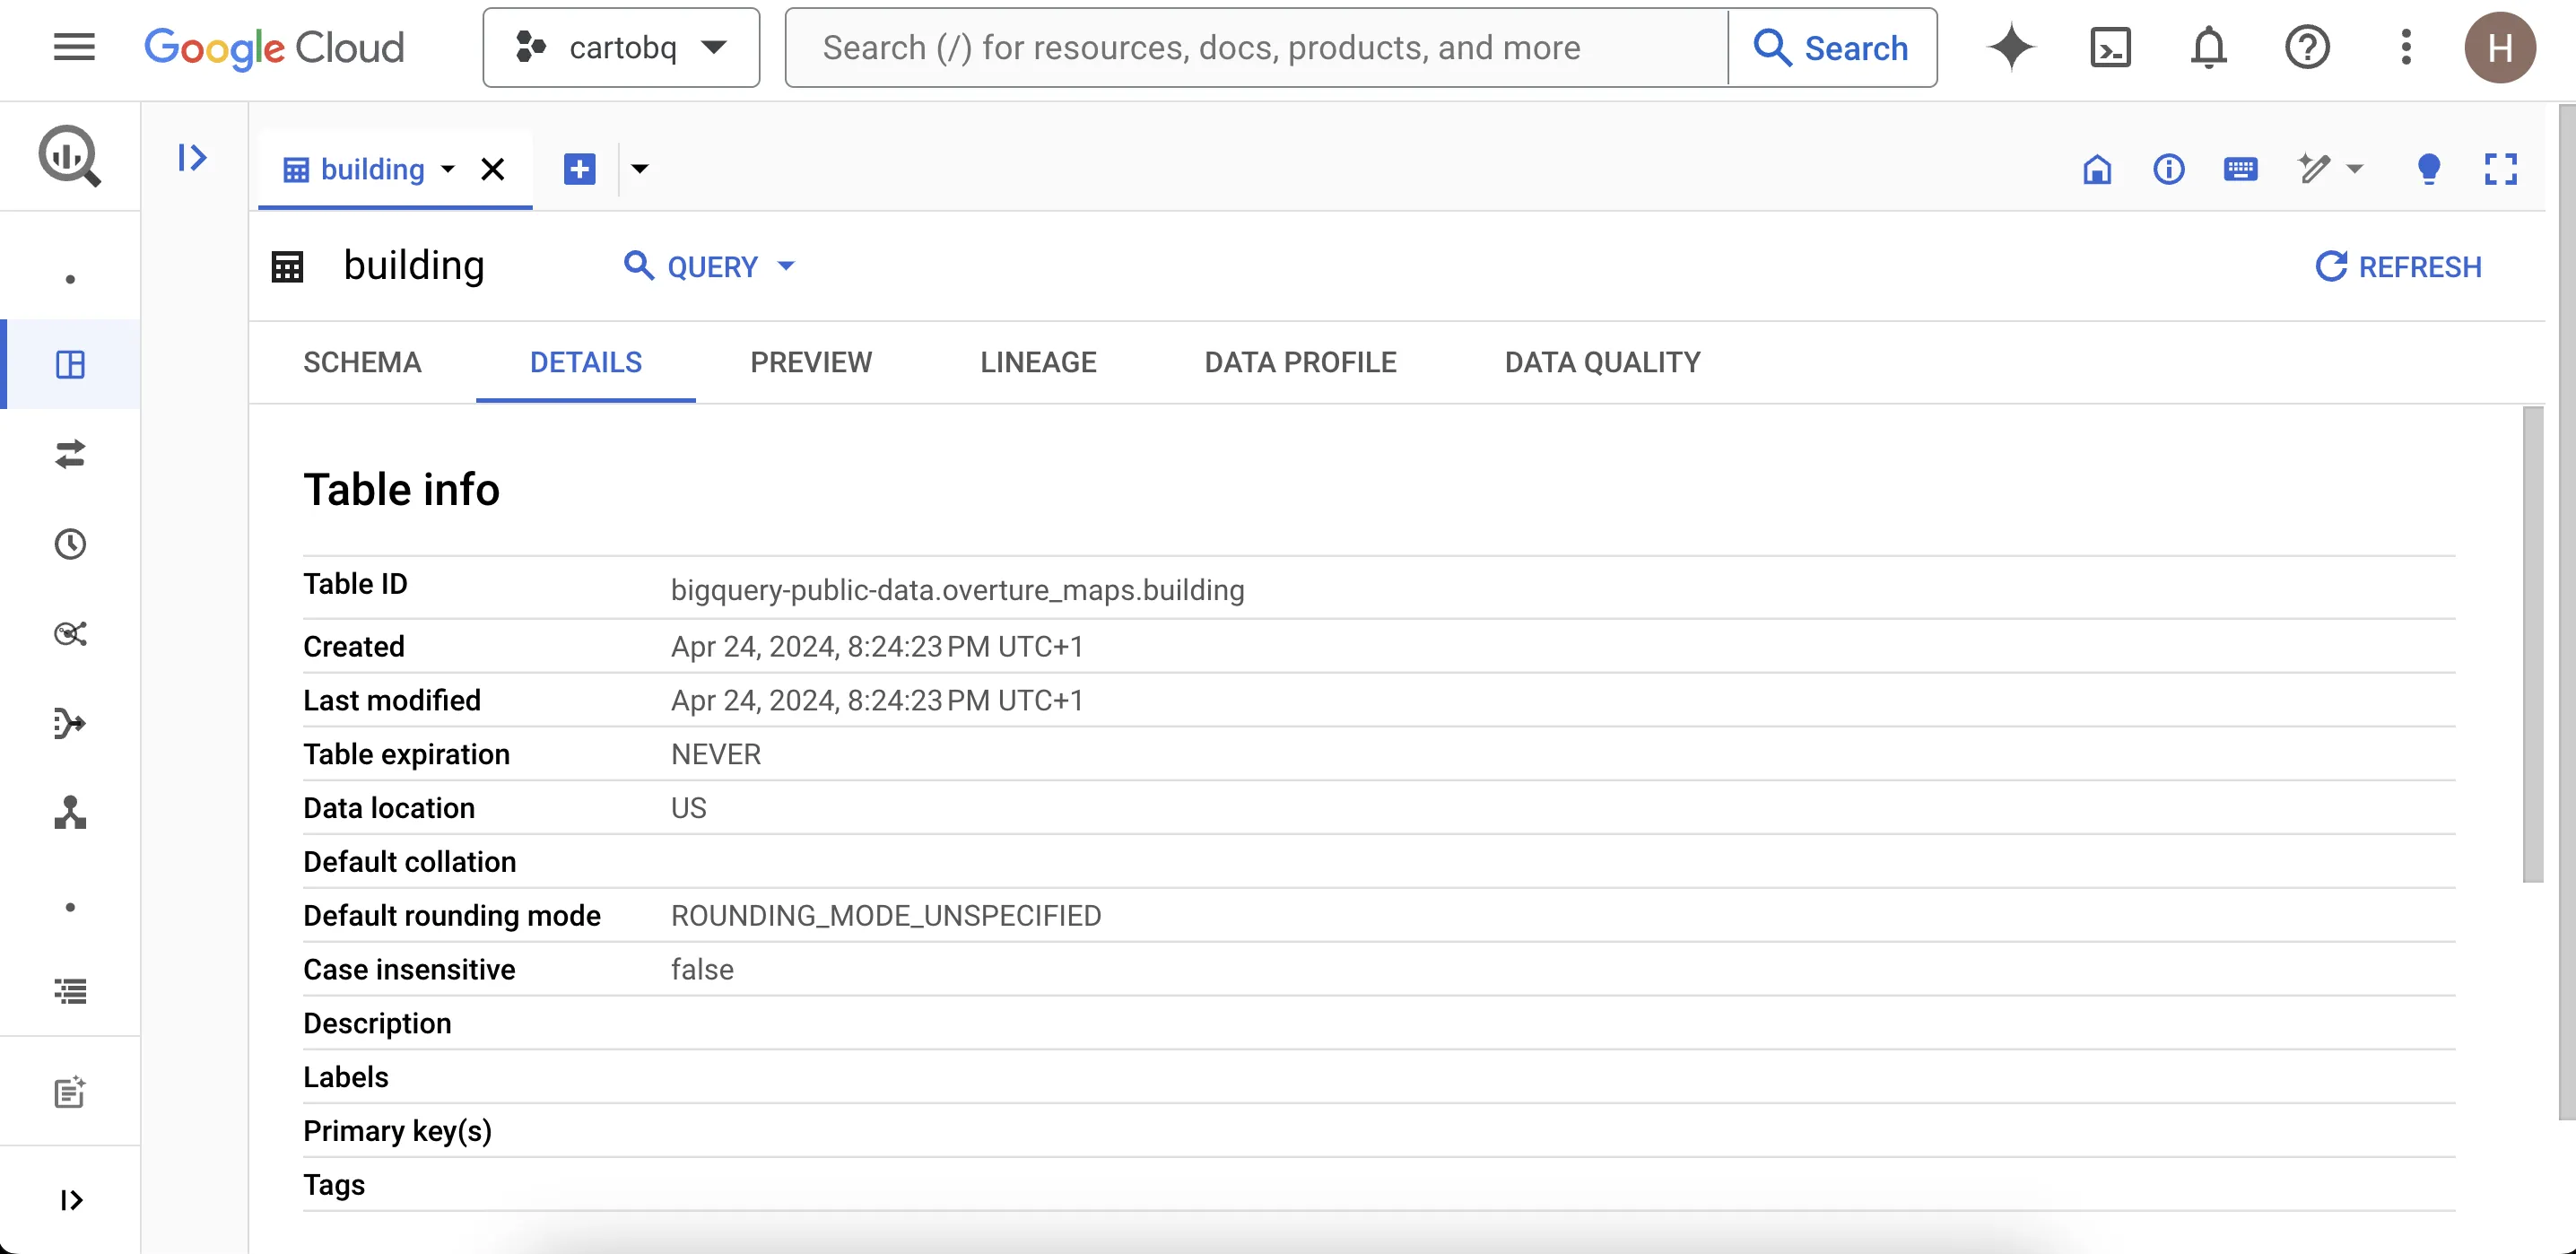
- Google Cloud users can access the data via the BigQuery Public Data Project. It is available for all regions meaning no transfer is required!
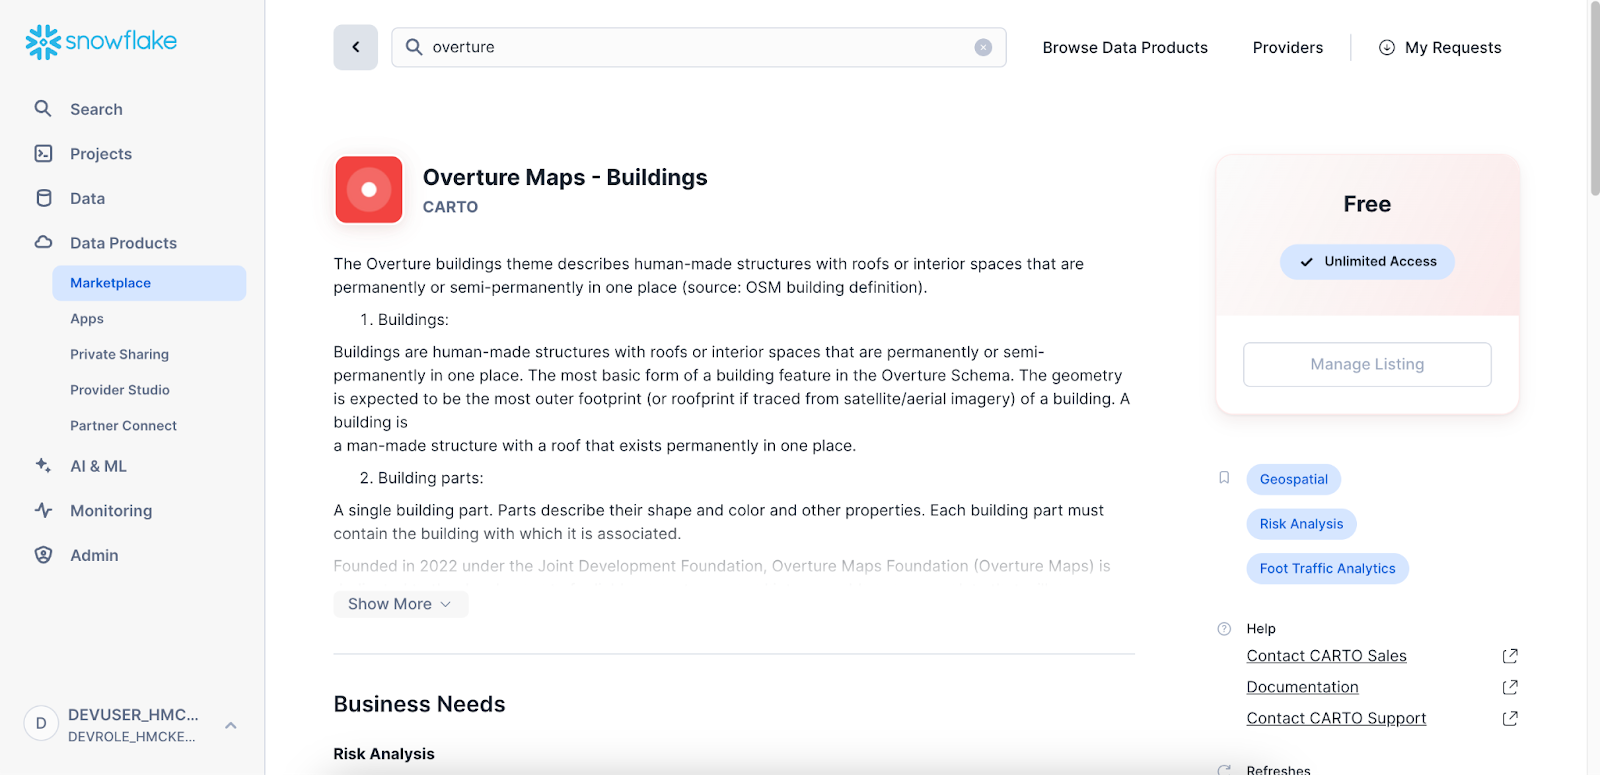
- Snowflake users can access the data via the Snowflake Data Marketplace.
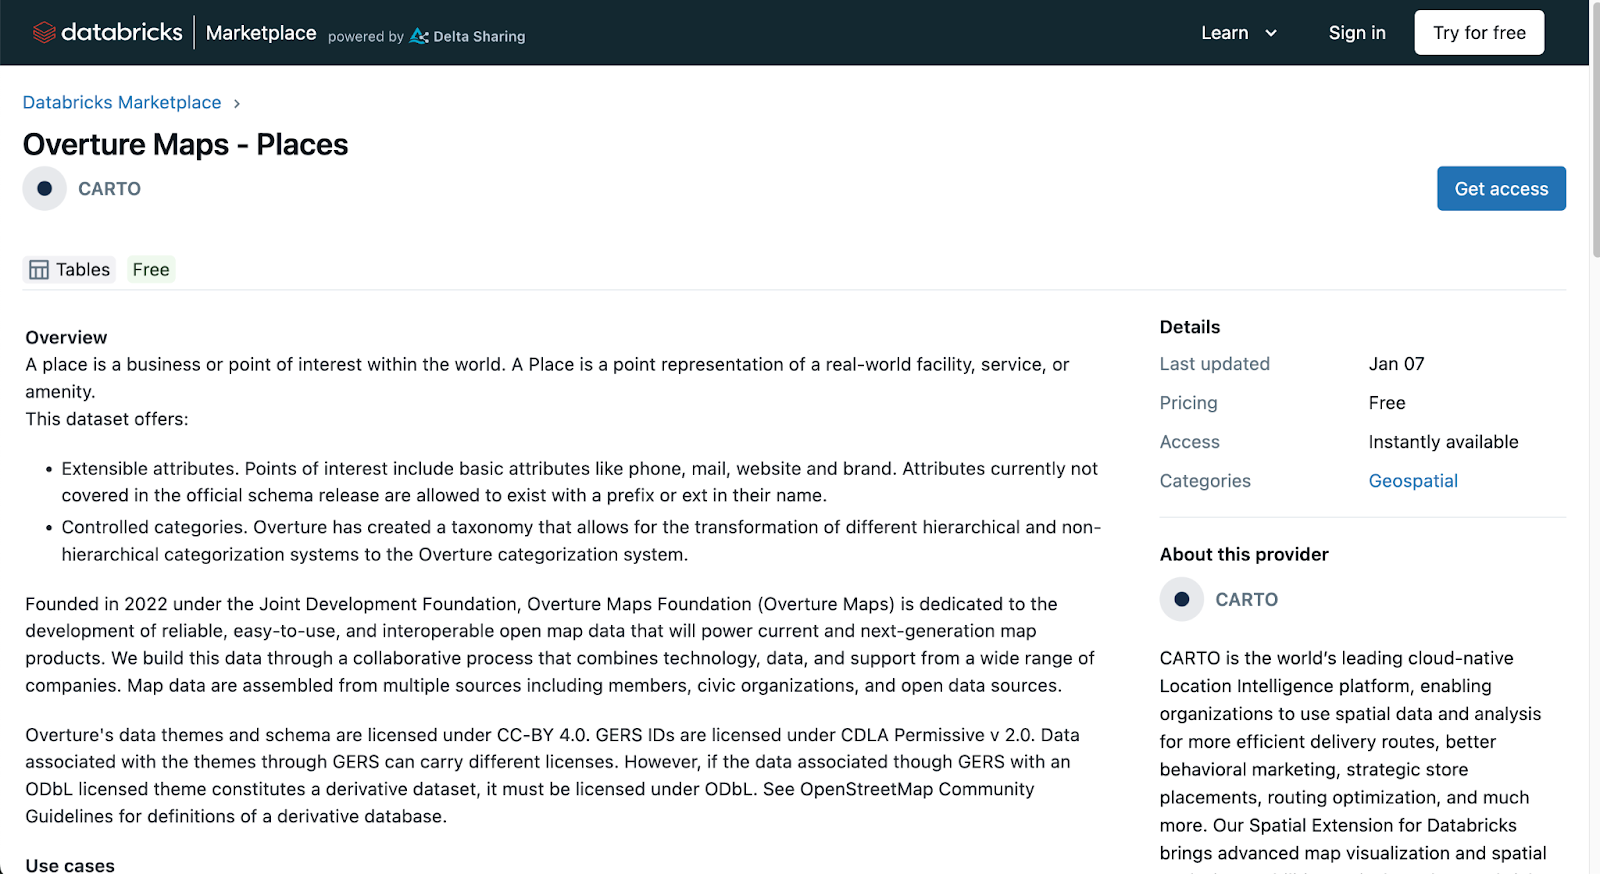
- Databricks users can access the data via the Databricks Data Marketplace.
Learn more about how you can use Overture data in Databricks in our webinar: Final Verdict: Data Lake vs Delta Lake When Performing Geospatial Analytics with Overture Maps!
So now you’re subscribed to your Overture Maps data - let’s put it through its paces!
Connecting Your Data to Overture
In June 2025, Overture Maps announced a powerful new feature called the Global Entity Reference System (GERS), which assigns stable, unique identifiers to real-world entities like addresses, roads, places, and administrative divisions. This makes it dramatically easier to match and join your data - such as GPS traces, addresses, or business locations - with Overture’s open datasets for large-scale spatial analysis.
In the coming months, CARTO will be helping to streamline the “GERSifying” process. Updates to our platform will enable users to assign division boundaries, match transportation lines, and link places or addresses safely and securely inside the data warehouse alongside their own data. This unlocks a scalable, cloud-native way to perform conflation and enrichment using Overture’s open, GERS-enabled datasets.
Overture Maps data in action
1 Create a dashboard

This CARTO Builder map of Overture Maps buildings in Manhattan visualizes the building height variable in 3D at a 1:1 scale - perfect for conveying the scale of the Manhattan skyline! Complete with pop-ups and a series of interactive widgets, map users can easily filter the data to those of interest.
Building height data has immense value across a wide variety of use cases, such as premium setting for insurers (with taller structures typically requiring higher repair costs) and urban coverage analytics for telcos.
2 Perform low-code analysis with CARTO Workflows
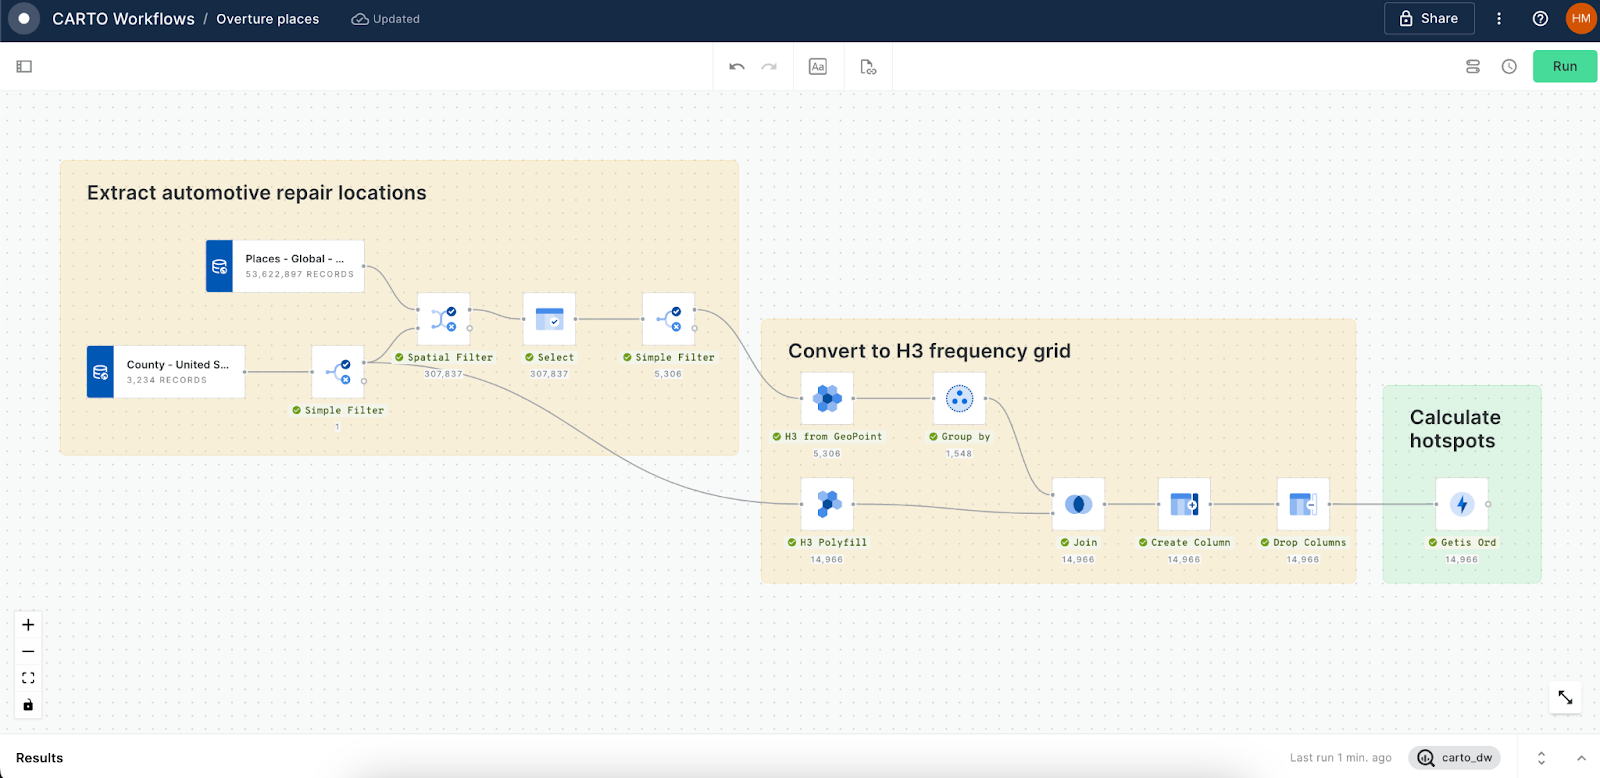
Working with massive spatial data can feel challenging at the best of times, and one way to take some of the pain away is to use low-code tools like CARTO Workflows.
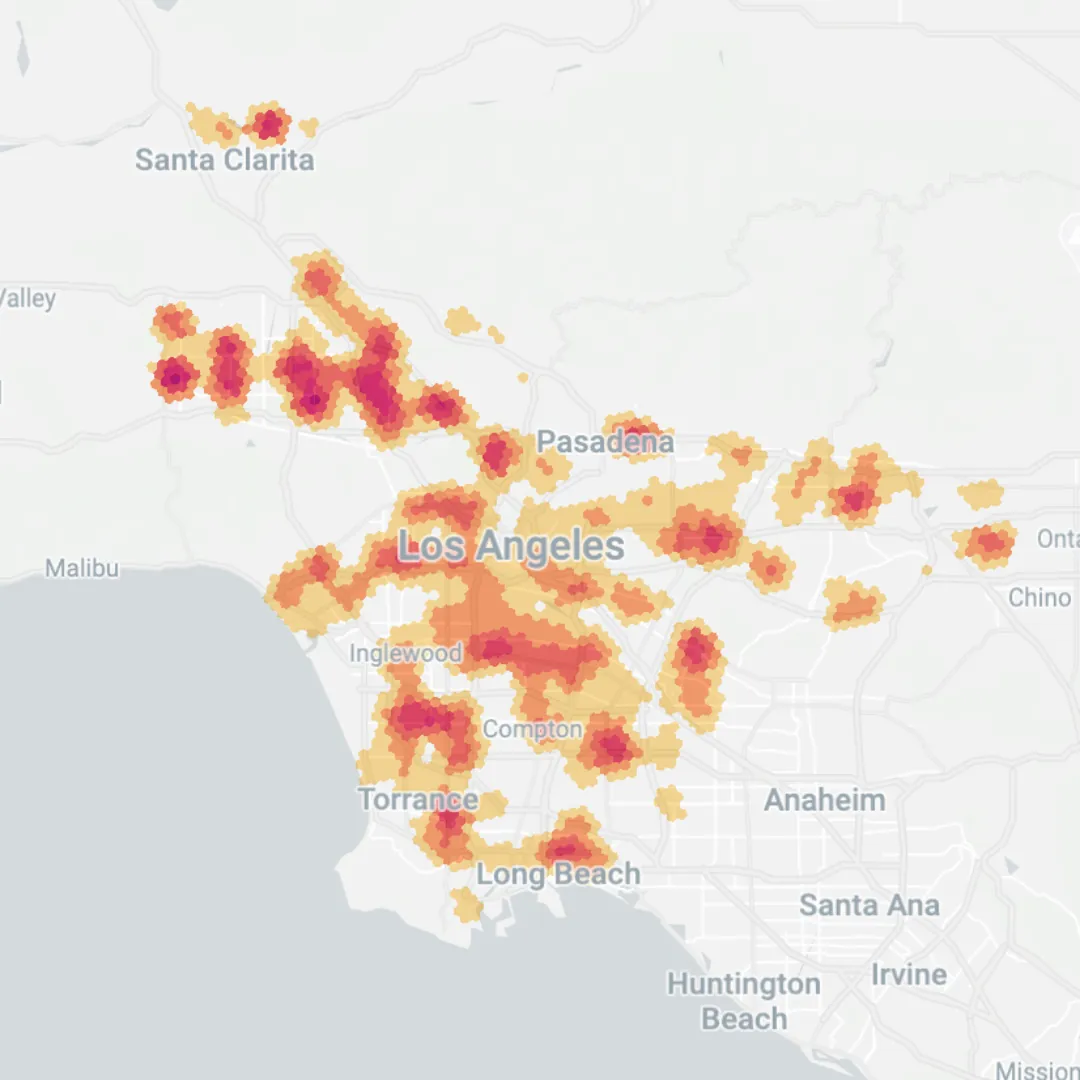
In the example above, the analyst extracts automotive repair locations in San Francisco from the global Locations dataset, before converting them to a H3 grid. Finally, hotspot analysis is run to determine statistically significant areas where there are a high number of automotive repair locations.
The results of this can be viewed below, with red areas indicating the strongest hotspots. This analysis could be useful particularly to vehicle insurers to reduce vehicle downtime, more accurately predict costs and detect fraud and unusual claims.
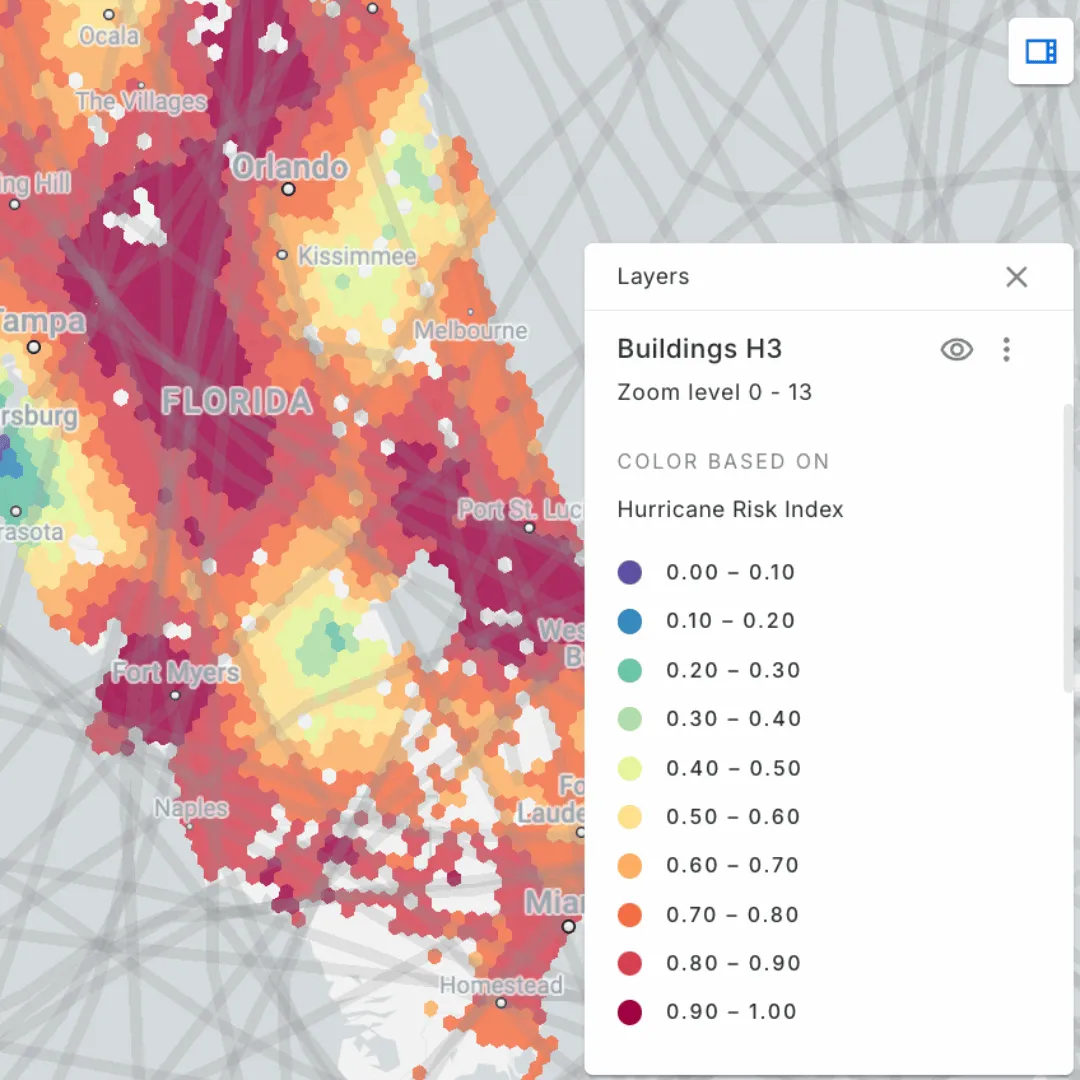
3 Visualize variables at scale with H3
Overture Maps data is fantastic for building hyper-local insights, but as you start to look at larger areas the data can start to feel a bit… noisy. One approach to this is to leverage Spatial Indexes like H3 and Quadbin.
You can see this in action in the demo below. Risk from hurricanes is calculated through proximity to historic hurricane paths with a category of 3 or more. When zoomed to view the entire state of Florida this risk level is aggregated to a H3 grid, allowing the user to understand state and regional level trends. As you zoom in, individual buildings become clear allowing for much more granular insights.
—
Ready to start generating insights from spatial data at a massive scale? Request a demo with one of our geospatial experts to learn how!