CARTOframes
Power your Data Science models with location data and spatial analysis
CARTOframes is a Python package that allows data scientists to seamlessly integrate CARTO maps, data, and analysis into their current environment, and spend less time gathering and cleaning their data.
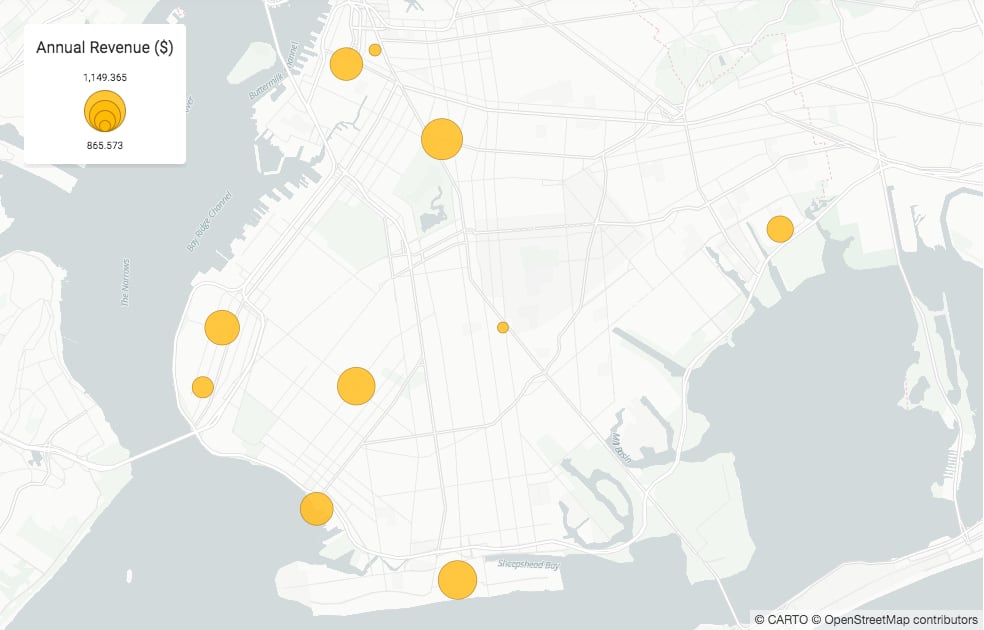
Explore your data
Visualize your local data (even without a CARTO account) or hosted datasets straight out of Jupyter notebooks.
from cartoframes.auth import set_default_credentials
from cartoframes.data.services import Geocoding
from cartoframes.viz import Map, Layer, size_continuous_style
import pandas as pd

set_default_credentials('creds.json')

stores_df = pd.read_csv('http://libs.cartocdn.com/cartoframes/files/starbucks_brooklyn.csv')
stores_gdf, _ = Geocoding().geocode(stores_df, street='address')
Map(Layer(stores_gdf, size_continuous_style('revenue', size_range=[10,40]), title='Annual Revenue ($)'))
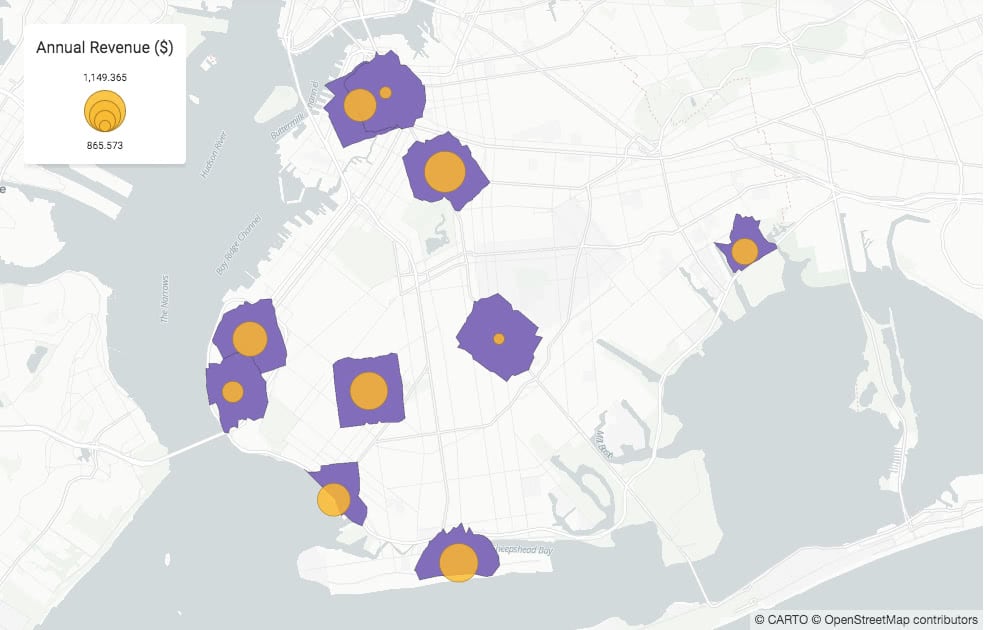
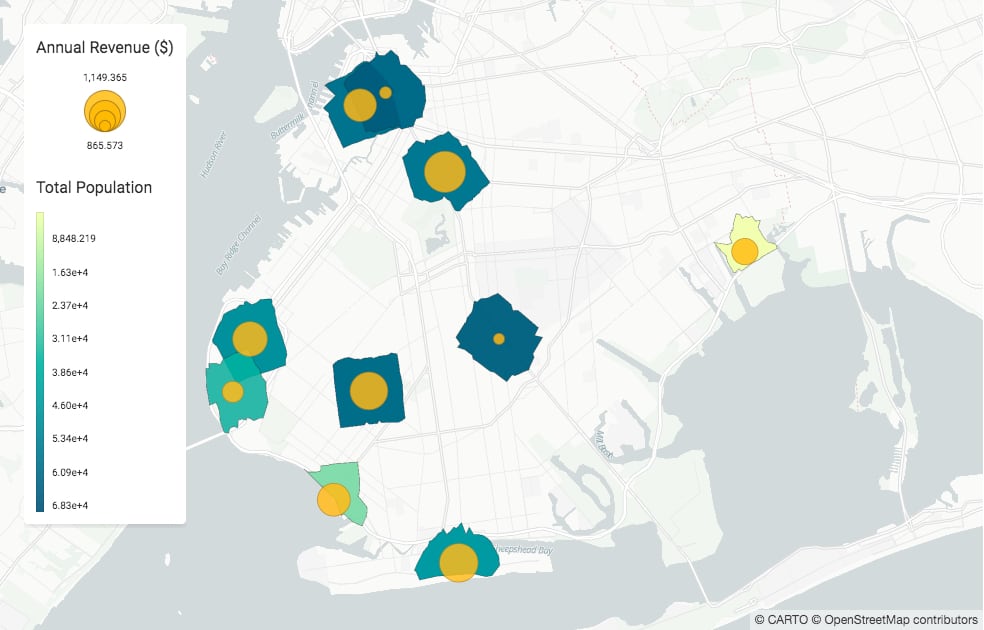
Enrich your data
Access a wide range of datasets from around the globe—all on standardized spatial aggregations to reduce your time to insight.
Spatial Data Catalogfrom cartoframes.data.services import Isolines
aoi_gdf, _ = Isolines().isochrones(stores_gdf, [15*60], mode='walk')
Map([
Layer(aoi_gdf),
Layer(stores_gdf,
size_continuous_style('revenue', size_range=[10,40]),
title='Annual Revenue ($)')
])
Analyze your data
Get insights from your data using our API and interact with CARTO using your own libraries, functions, and workflows.

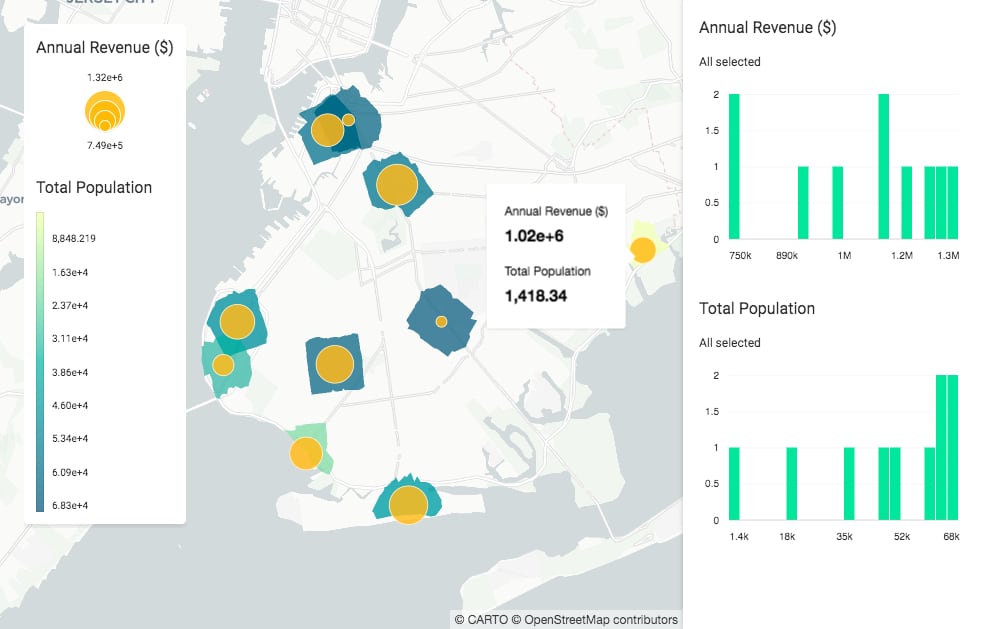
Upload and share your maps
Once your analysis is done, add some pre-defined widgets and share the results—empowering business teams to act straight away.

-
Explore your data
Visualize your local data (even without a CARTO account) or hosted datasets straight out of Jupyter notebooks.
-
Get your data ready
Use Location Data Services to convert plain text to geometries (geocoding), create areas of influence within a specific distance or travel time (isolines), and more.
-
Enrich your data
Access a wide range of datasets from around the globe—all on standardized spatial aggregations to reduce your time to insight.
Spatial Data Catalog -
Publish and share
Once your analysis is done, add some pre-defined widgets and share the results—empowering business teams to act straight away.
CARTOframes 1.0
We've released 1.0, the latest version of CARTOframes, packed with functionality to speed up your spatial analysis.
Learn more
Understand the ins and outs of CARTOframes and get started today. You don’t need a CARTO account to start visualizing your local data.
Try for free
CARTOframes gives teams and organizations the flexibility to create any map—not just limited to pre-canned maps, and the highest performance through a robust tech stack.