.png)


Live maps with automated Workflows integrations are here
Create live, always-updated maps with CARTO by integrating Workflows and Builder. Automate geospatial analysis to visualization in one step.
.jpg)

Making Human Mobility Models Fair, Inclusive, & Private
Discover our Scientific Committee's latest insights when they gathered recently to discuss human mobility data topics including representation, bias, & privacy.


Announcing CARTO’s Return to In-Person Events
We are pleased to announce our return to in-person events! Discover the events we will be attending this year including Big Data LDN, Groceryshop, & ODSC West.


The Data Appeal Company POI & Sentiment Data now available in CARTO
We are pleased to announce our partnership with The Data Appeal Company, a leader in POI & visitor sentiment data, & their inclusion in our Data Observatory

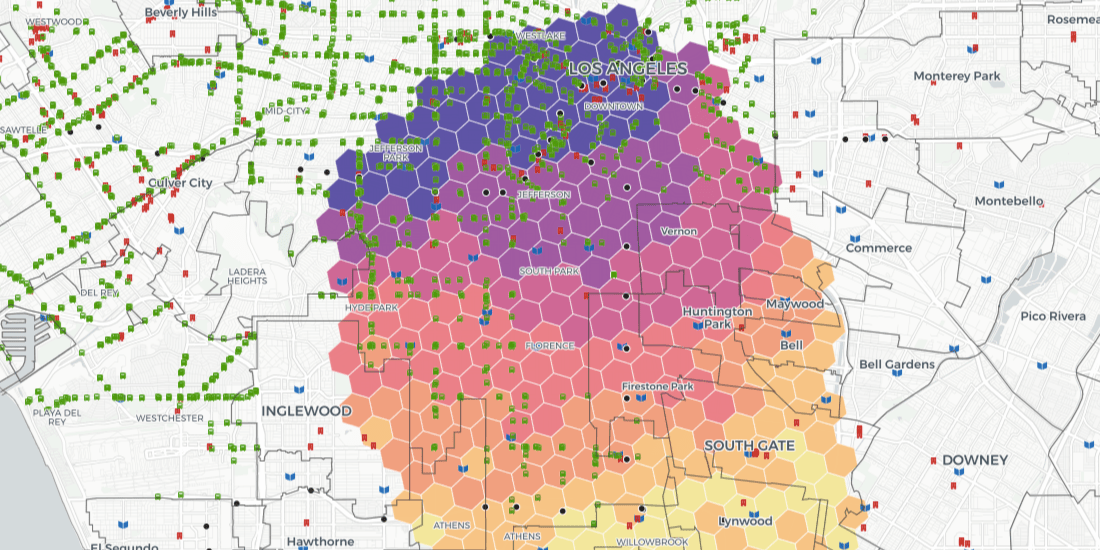
How to Build a Tree Equity Index & Dashboard using BigQuery
Lack of trees is linked to higher temperatures & more violent crime. Discover how to use the BigQuery Spatial Extension & CARTO for React to build a tree score dashboard.


Simplified tileset creation for streamlined app development
Discover the latest updates to CARTO’s BigQuery Tiler, simplifying the SQL code & reducing the processing steps required to ingest & visualize large datasets

#SDSC21: Speak at the largest Spatial Data Science Conference
Want to connect with thousands of Spatial Data Science experts? Speak at #SDSC21 & be part of the biggest & most global community of Data Scientists with spatial expertise

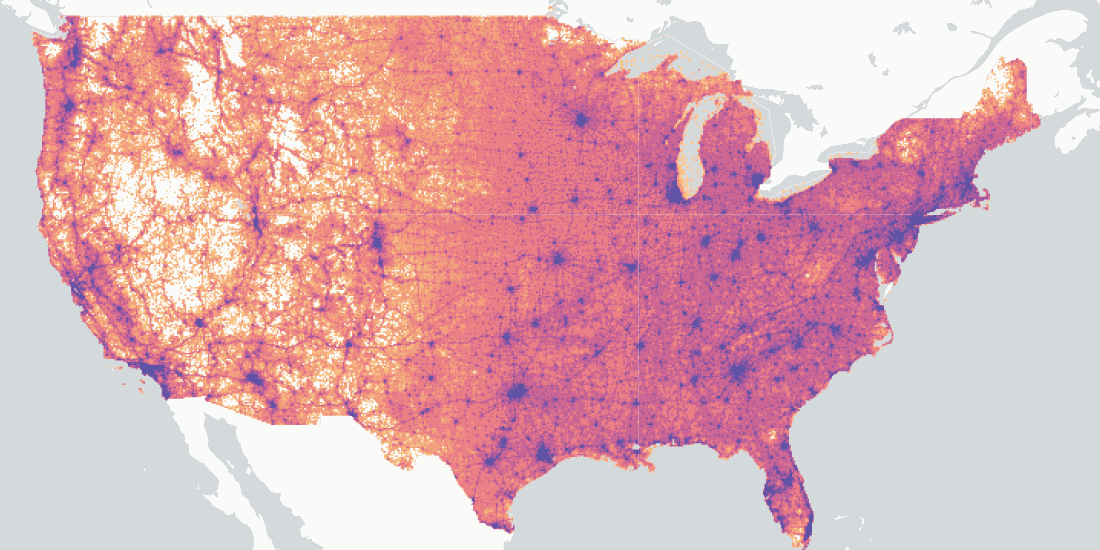
Z Score Visualization: How to Identify Hotspots with BigQuery
Index, or Z Scores, have often been used in geospatial analytics to identify hotspots & rank locations. Discover how to visualize them using Google BigQuery.

Announcing #SDSC21: Telecoms & Utilities Summit
Following the successful industry-specific #SDSC21 events earlier this year we are pleased to announce the Spatial Data Science in Telecoms & Utilities Summit
.png)
How to Visualize Urban Growth with Spatial Analytics in BigQuery
How has your city or urban area grown? Discover how to create an Urban Growth visualization using open data & CARTO's Spatial Analytics in BigQuery.

Delivering Geospatial Datasets on the Leading Cloud Data Platforms
Access your location based datasets from the CARTO Data Observatory directly on leading cloud platforms, including Google Cloud, AWS, and Azure


Authoritative Environmental Remediation Mapping in NYC
Learn about SPEED 2.0, a collection of spatial datasets wrapped into one app for the purpose of helping individuals identify environmental issues in New York City

Join CARTO at Mobile World Congress MWC21 Barcelona
CARTO will be attending Mobile World Congress MWC21 Barcelona to discuss how location data can be used in a wide range of telecoms use cases.

Academy
Live maps with automated Workflows integrations are here
Create live, always-updated maps with CARTO by integrating Workflows and Builder. Automate geospatial analysis to visualization in one step.

Introducing User Comments: boost collaboration in your maps
Boost team collaboration with User Comments in CARTO Builder—add, track, and resolve feedback directly on your enterprise maps.

Navigate global risk with MBI CONIAS Political Risk data
Monitor and forecast global political risks with MBI CONIAS data - spatial, predictive, and ready to support smarter decisions in volatile regions.
.png)
