Posts by
Helen McKenzie

The Changing Role of the GIS Analyst
Discover how GIS Analysts are evolving from map makers to strategic AI-driven experts shaping enterprise decision-making with cloud-native tools.
Unlock planetary-scale insights with CARTO & Google Earth AI
Learn how CARTO & Google Earth AI make planetary-scale insights accessible with foundation models & Agentic GIS.
How to build a geospatial AI roadmap (that actually works)
Only 1 in 4 AI projects deliver ROI. Discover a proven 5-step roadmap for scaling geospatial AI - govern data, automate workflows, and unlock Agentic GIS value.


Introducing CARTO Site Selection AI Agent for Gemini Enterprise
Transform Site Selection with CARTO’s AI Agent in Google's Gemini Enterprise - analyze, compare, and plan new locations in minutes.


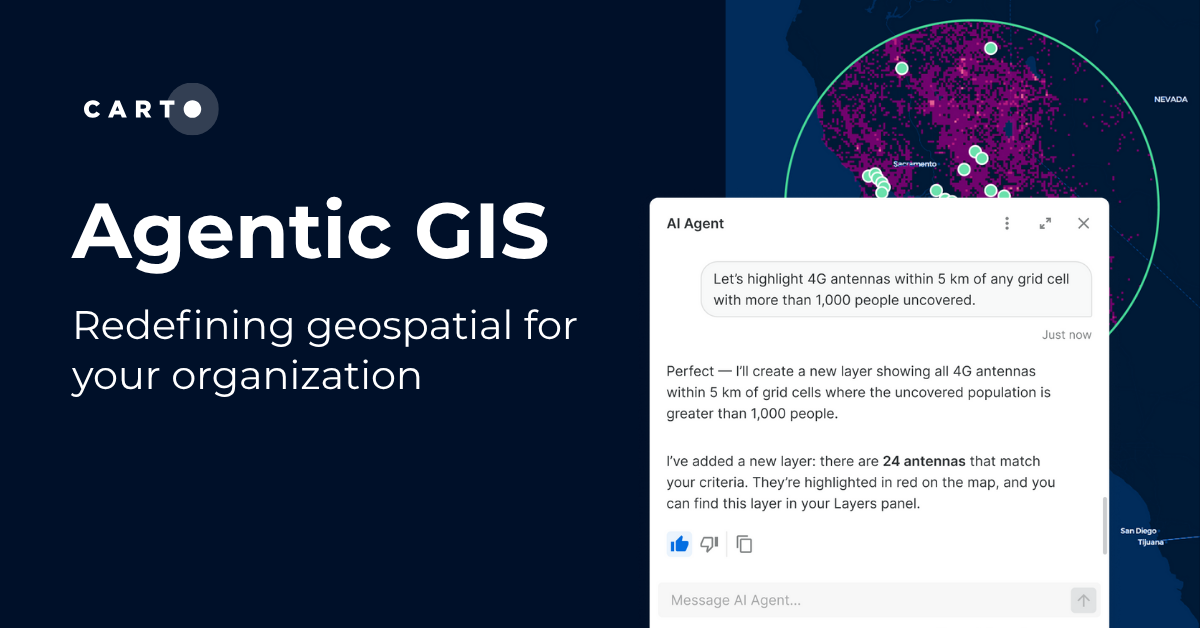
Agentic GIS has landed: redefining geospatial for your organization
Discover how CARTO’s Agentic GIS platform and AI Agents are transforming spatial analysis - making Location Intelligence accessible to everyone.


What’s new in CARTO - Q3 2025
Discover CARTO’s Q3 2025 updates: smarter workflows, better governance, easier imports & new tools for territory planning.


.jpg)
Navigate consumer demand with NIQ Purchasing Power Data
Navigate consumer demand with NIQ Purchasing Power Data. Understand consumer spending, optimize location planning, and boost marketing.
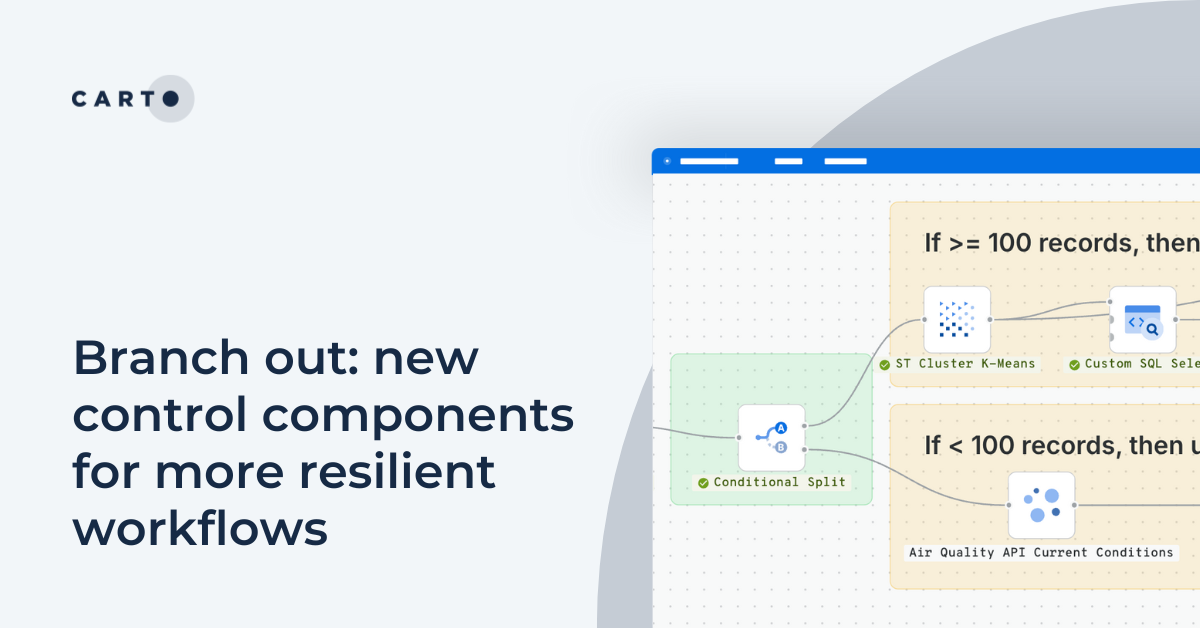
Branch out: new control components for more resilient workflows
Discover CARTO Workflows’ new Conditional & Success/Error Split components to build flexible, resilient spatial analysis pipelines.
5 ways to transform spatial analysis for environmental resilience
Discover 5 ways to transform spatial analysis for environmental resilience using cloud-native GIS, automation, and real-time insights.


Cotality’s Location Intelligence Insights - now in CARTO
Explore Cotality’s US Location Intelligence data in CARTO - now available via Data Observatory for fast, actionable spatial insights at scale.


What’s New in CARTO - Q2 2025
Discover CARTO's Q2 2025 updates - new features for smarter maps, team collaboration, automation, and scalable spatial analysis in the cloud.


Create your expansion strategy with CARTO and Snowflake
Learn how CARTO and Snowflake help you build a winning expansion strategy. Pinpoint ideal locations, leverage spatial analytics & AI for confident growth.


.jpg)
Pain-free data integration with Overture Maps, GERS & Databricks
Seamlessly integrate spatial data with Overture Maps, GERS & Databricks for fast, scalable geospatial analysis - no ETL or data wrangling needed.
Personalizing services with spatial analytics in Google Cloud
Personalize services at scale with spatial analytics on Google Cloud. Learn how to boost ROI using CARTO for location-based insights.


Overture Maps data now on the cloud: how to use it with CARTO
Announcing Overture Maps data in the cloud! Seamlessly access, analyze, and visualize data on global buildings, POIs, boundaries & more with CARTO!


Geospatial & AI at the Databricks Data + AI Summit 2025
Explore the biggest geospatial & AI highlights from Databricks Data + AI Summit 2025, including Agent Bricks & native Spatial SQL.
Snowflake Summit 2025 - highlights for geospatial
Discover top geospatial highlights from Snowflake Summit 2025 -from AI to open formats -shaping the future of cloud-native spatial analytics.
From selection to consolidation: 6 ways to optimize site planning
Optimize site planning with data, AI, and real-time insights. Discover 6 of the best strategies in this expert guide from CARTO.
Geo for the Agentic Era: Highlights from #SDSC25 London
Explore how AI, open data, and scalable geospatial tech are redefining GIS at #SDSC25 London. Catch highlights, keynotes, and sessions on demand.


How Iceberg, GeoParquet & CARTO are reshaping geospatial
Discover how GeoParquet, Iceberg, and CARTO are transforming geospatial analytics with cloud-native, scalable, and open data architectures.


Live maps with automated Workflows integrations are here
Create live, always-updated maps with CARTO by integrating Workflows and Builder. Automate geospatial analysis to visualization in one step.


Introducing User Comments: boost collaboration in your maps
Boost team collaboration with User Comments in CARTO Builder—add, track, and resolve feedback directly on your enterprise maps.


Navigate global risk with MBI CONIAS Political Risk data
Monitor and forecast global political risks with MBI CONIAS data - spatial, predictive, and ready to support smarter decisions in volatile regions.
Google Cloud Next 2025: Key takeaways for geospatial
Discover key geospatial insights from Google Cloud Next 2025 - AI, low-code tools, Earth Engine, and more innovations shaping the future of location tech.


What's New in CARTO - Q1 2025
Announcing the latest new features in the CARTO platform from Q1 2025! AI Agents, cloud-native raster, QGIS integrations - and more!
The first 5 maps everyone needs to make with CARTO
New to CARTO? Start with these 5 essential maps! Learn how to analyze proximity, work with big data, integrate real-time updates, and leverage AI-driven insights.


Seamlessly integrate Google Earth Engine with CARTO Workflows
Seamlessly integrate Google Earth Engine with CARTO Workflows to analyze spatial data at scale - no coding required. Unlock powerful geospatial insights today!


Unlock raster analytics & visualizations - now in your lakehouse!
Unlock raster analytics in your lakehouse! Analyze & visualize raster data natively in CARTO for unmatched scalability, efficiency & cost savings.


CARTO AI Agents: now in public preview!
Discover how CARTO AI Agents are democratizing spatial analysis, making it accessible to all users. Learn about real-life applications revolutionizing geospatial industries.


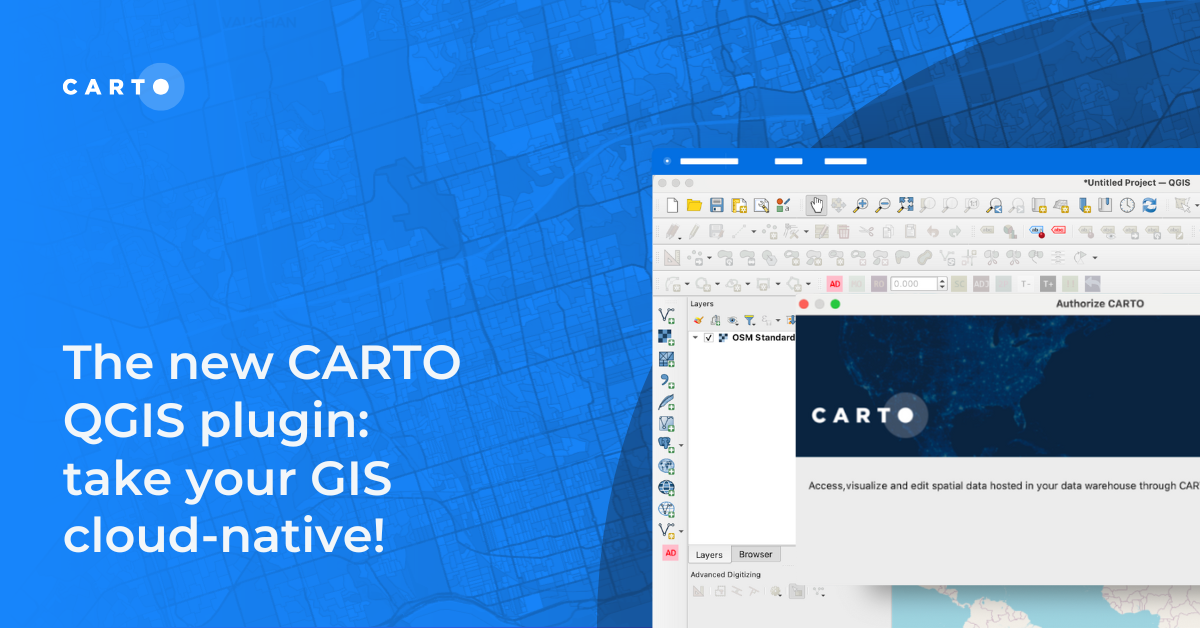
The new CARTO QGIS plugin: take your GIS cloud-native!
Modernize your GIS with QGIS & CARTO for scalable cloud-based analytics. Maximize efficiency, security, and collaboration.


Expand your analysis with the new CARTO Workflows Extensions
Expand & simplify your spatial analytics with AI-powered CARTO Workflows Extension Packages. Automate tasks, ensure consistency & enhance geospatial insights!


Drive smarter decisions with new BT mobility data in CARTO
Unlock mobility insights with BT Active Intelligence & CARTO! Drive smarter decisions with road-level data, OD matrices & seamless cloud integration.


What's New in CARTO - Q4 2024
Announcing the latest new features in the CARTO platform from Q4 2024! Explore the latest in visualisation, app development, analytics & security.
24 of the best maps, visualizations & analysis from 2024
Discover 24 of the best maps, visualizations, and analyses from 2024! Explore innovations in geospatial data, user-centric tools, & advanced spatial analytics.


What's New in CARTO - Q3 2024
Announcing the latest new features in the CARTO platform from Q3 2024.


What space-time analysis tells us about the Paris Olympics
Explore space-time analytics through the 2024 Paris Olympics! Discover insights from human mobility data & learn how to leverage spatial analysis tools.
How to retrieve spatial data from APIs, the no code way
Learn how to retrieve spatial data from APIs without coding! Discover the benefits of using REST APIs for scalable and automated geospatial analysis.


Cloud-native Life Sciences analytics with CARTO & Snowflake
Optimize Life Sciences analytics with cloud-native geospatial solutions using CARTO & Snowflake. Scale data insights for improved decision-making.
What is Supply Chain Network Design and How Does It Work?
Improve your supply chain network design! Use spatial analysis to optimize your supply chain design for cost savings, efficiency, resilience & sustainability.
Boost Telecom Analysis with FCC Data - now available on CARTO!
Access FCC telecom data on CARTO for seamless, cloud-native insights! Analyze broadband & mobile availability, speeds, and more for the entire U.S.
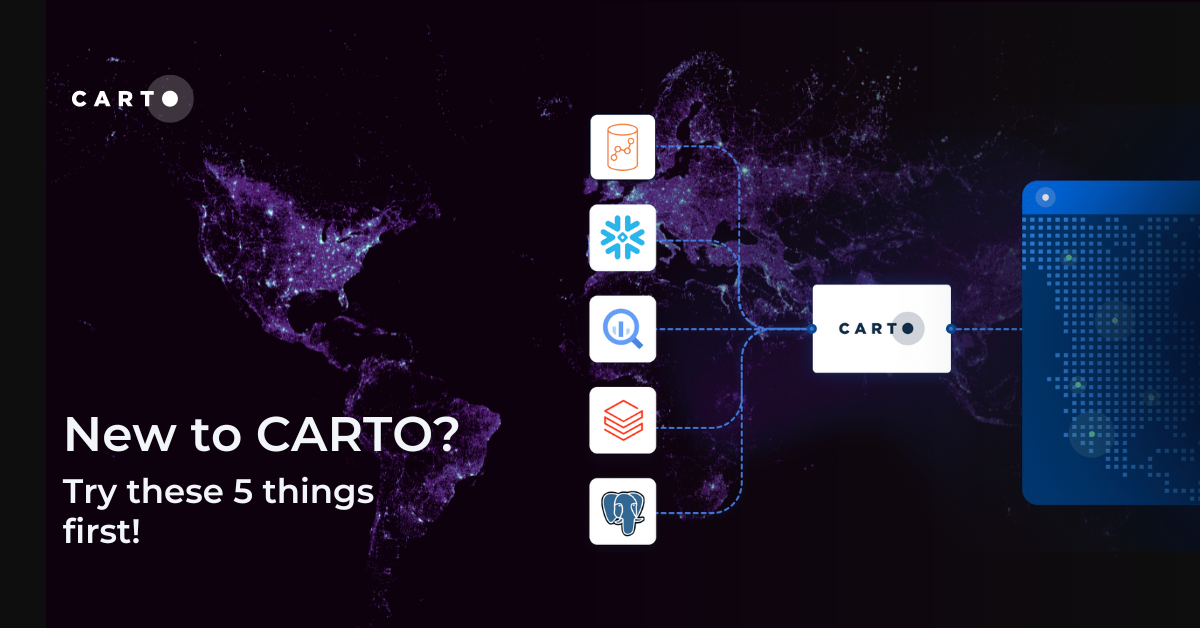
New to CARTO? Try these 5 things first!
New to CARTO? Discover the first 5 things to try, from running a cloud-native spatial analysis to creating your first map.
The State of Spatial Data Science 2024 - get your free copy!
Download your FREE copy of The State of Spatial Data Science 2024; stay ahead with insights on AI, cloud integration, GIS, climate impact & more!
Introducing CARTO Heatmaps for Big Data Visualization
Enhance your big data visualization with CARTO's heatmap style! Learn how to impactful, large-scale heatmaps with this guide.


Enhancing geospatial analytics with CARTO & Databricks
Unlock advanced spatial analysis in Databricks with CARTO’s Analytics Toolbox. Visualize & analyze large geospatial data inside your data warehouse.


Understanding flood risk at scale with Fathom’s new Risk Scores
Fathom's Flooding Risk Scores now available on the cloud with CARTO! Make more intelligent decisions for insurance, financial services & engineering.
Smarter Investment Decisions for Workspace Providers: The Instant Group
Make smarter investment decisions for flexible workspace with The Instant Group’s Coworkintel platform, powered CARTO.


Transforming Data Center Locations for Nautilus Data Technologies
Learn how we are collaborating with Google Cloud to provide Nautilus Data Technologies with an innovative solution for data center site selection and monitoring.
What are isolines and how to use them with CARTO
Learn what isolines are and how to use them at CARTO. Follow this quick guide for creating isolines & trade areas. Use them to derive actionable insights.


BT Active Intelligence Location Insights Now Available with CARTO
Access hyper-local footfall insights with BT Active Intelligence Location Insights, now available with CARTO! Explore granular mobility data in the cloud.
H3 Spatial Indexing, accelerated with Snowflake & CARTO
H3 Spatial Indexing is now available natively in Snowflake - learn about our new H3 Acceleration Program and discover how to get started!


Introducing Workflows Templates: pre-built spatial analysis
Boost efficiency with CARTO Workflows Templates - no-code spatial analysis made easy. Explore pre-built templates for streamlined geospatial projects.
Elevate your real estate property analysis with CARTO & Markerr
Announcing CARTO & Markerr's data partnership! Subscribe to spatial real estate data including transactions, rent and property details.
5 Advantages of No Code Spatial Analysis
Is no code for spatial analysis possible? Discover 5 advantages to go no code & see CARTO Workflows in action! Reduce bottlenecks, save time & de-risk.
Geographic Segmentation: How to get started
Get started with Geographic Segmentation with our guide & tutorials. Leverage demographic & consumer data to tailor your strategy & maximize ROI.
Modernizing the Geospatial Analysis Stack report - get your copy!
Level up your geospatial analysis with our FREE report! Modernize your tech stack for bigger, faster, and more collaborative spatial analysis.


4 ways catastrophe analysts can use spatial analytics
Discover 4 different spatial analytics techniques Catastrophe Analysts can use to understand key climate-related risks for better insurance decision-making.
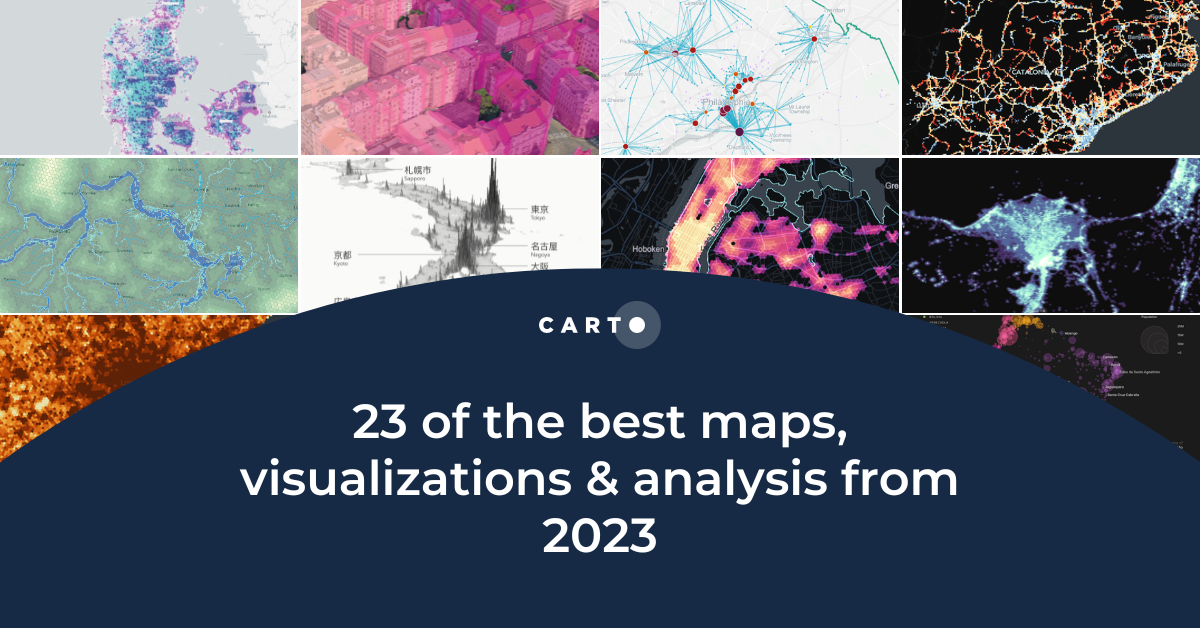
23 of the best maps, visualizations & analysis from 2023
Explore 23 of the best maps and visualizations of 2023. From advanced analytics to awesome visualizations with huge geospatial data.


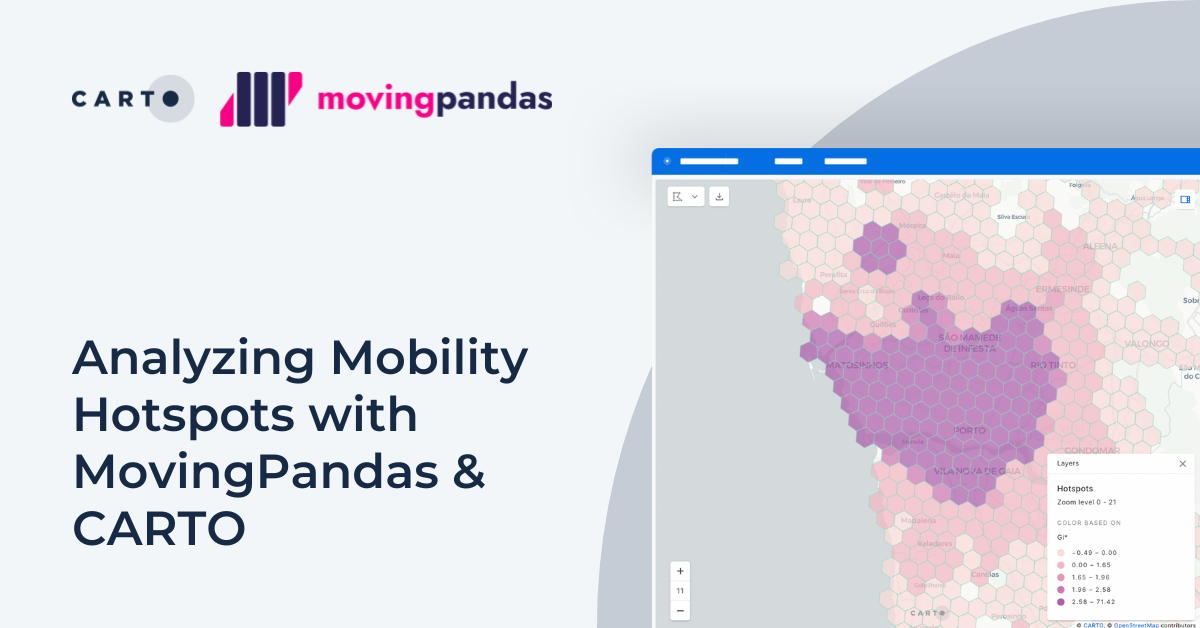
Analyzing Mobility Hotspots with MovingPandas & CARTO
Explore mobility hotspots with MovingPandas and CARTO. Tutorial on transforming trajectory data into space-time hotspots for intelligent decision-making.


Pie Charts: An Effective Data Visualization Tool?
A guide to creating Pie Charts for effective spatial Data Visualization & dashboards, including best practice and examples.
Using crime data & spatial analysis to assess home insurance risk
Discover how spatial analysis of crime data can be used for smarter home insurance decisions, including personalized underwriting & targeted marketing.


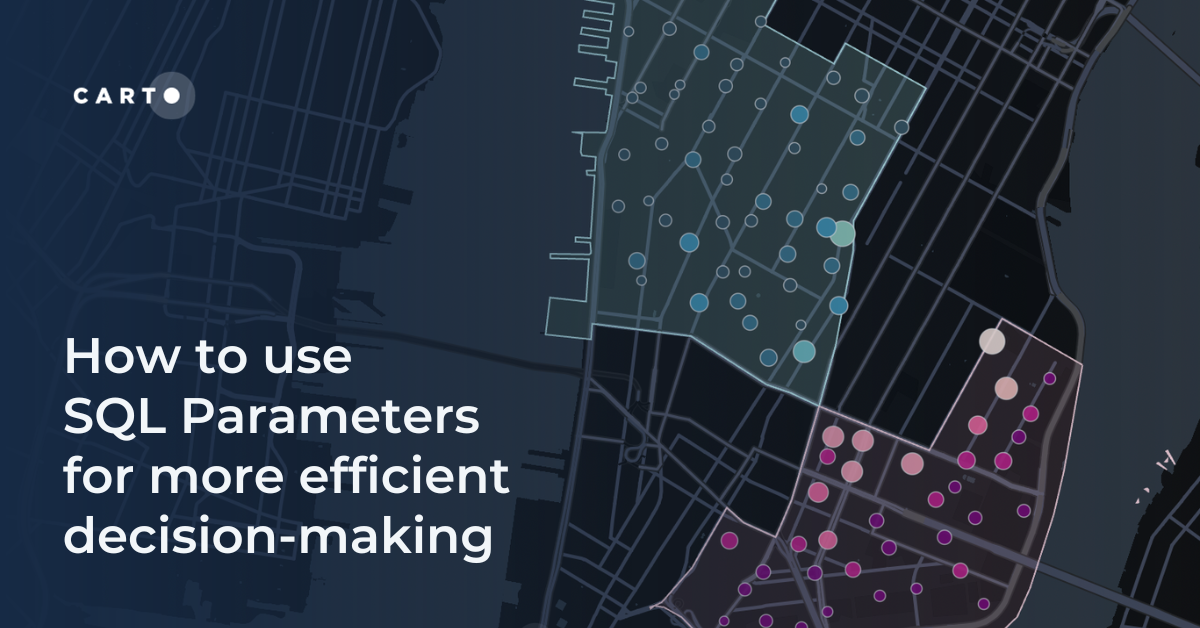
How to use SQL Parameters for more efficient decision-making
Make decisions more efficiently with SQL parameters. Follow this step-by-step guide exploring data-driven insights from Citi Bike analytics.
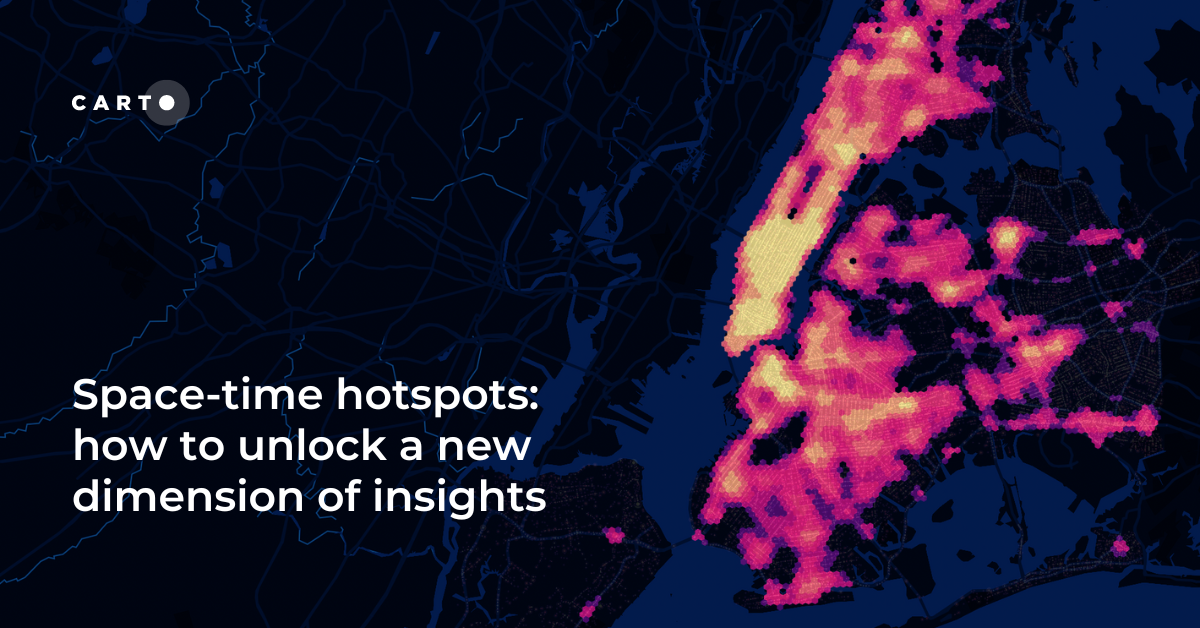
Space-time hotspots: how to unlock a new dimension of insights
How to use Space-Time Clustering to generate insights & optimize decision making with this step-by-step guide.


Introducing the Spatial App Development Summit NYC!
Join the first-ever Spatial App Development Summit! Engage with experts, explore cutting-edge tools, and shape the future of spatial app development.


Spatial Scoring: Measuring Merchant Attractiveness & Performance
Learn how to use Spatial Scoring for Merchant Prioritization in the CPG Industry. Optimize sales and reduce costs with this step-by-step guide.
Cannibalization Analysis: what is it & how can I use it?
Balance competing demands between multiple business locations with our 4-step guide to Cannibalization Analysis: from data collection to decision!


Boosting Retail & CPG Sales with Sentiment Analysis
Leverage sentiment analysis for retail growth. Explore Data Appeal's insights, using sentiment data for strategic business expansion. Free 14-day trial.


Optimizing Site Selection for EV Charging Stations
Optimize EV Charging Site Selection with Spatial Data Science - improve accessibility and convenience, drive revenue, and de-risk growth.
Spatial interpolation: which technique is best & how to run it
Fix missing or coarse data with Spatial Interpolation. Compare IDW and Kriging methods & follow along with tutorials!


Driving Decisions with Spatial Analysis: Vacation Rentals
Discover spatial trends in vacation rentals & relationships with land use, ft. tutorials on how to conduct this analysis and use it to drive decision-making.
Map tiles: 5 examples to get started
Learn how to effectively visualize geospatial data with tilesets, including a step-by-step guide and 5 examples to inspire you!
Do you need to code for a career in data?
Exploring the role of coding in data careers | Do you need to learn, and which language is right for you? Low-code, SQL, Python, R, HTML & Javascript.


%20Koronkowski.jpeg)


%20Koronkowski.jpeg)

Boosting International CPG Market Share with Location Intelligence
Unlock Global CPG Growth with Location Intelligence! Overcome challenges, target the right markets, cater to preferences & boost revenue.
Unlock the Potential of Spatial Indexes: 10 Powerful Uses of H3
Unleash the potential of H3 and revolutionize spatial data analysis with this lightweight global grid system. Explore real-world examples.
Self-service spatial analytics with user-defined parameters
Unlock Spatial Insights for non-expert users with User-Defined Parameters. Learn how to democratize geospatial data analysis for faster decision-making.
Improving Customer Experience in Telecoms with Geospatial
A guide to using geospatial to improve the Telecom customer experience, including network optimization, service personalization & targeted support.
A Guide To Using GTFS Data
The General Transit Feed Specification - or GTFS - is a specification for transit data. Use GTFS data for transit analysis & map visualization. Free tutorial.
How Geographically Weighted Regression works
Find out what Geographically Weighted Regression (GWR) is, how it works, when to use it & how to use spatial indexes in conjunction.
How To Optimize Location Planning For Wind Turbines
Optimize wind farm locations with our guide on location planning for wind turbines. Explore criteria, spatial analysis, and use CARTO for a free trial.
5 maps you didn't know you could create with SQL
Did you know you can use Spatial SQL to create amazing maps and data visualizations? Learn how with these five examples.
How to use Location Intelligence to grow London's brunch scene
How to use Location Intelligence tools to establish new opportunities for specific restaurant types, based on geosegmentation and catchment areas.


Finding that Spatial someone: using analytics to find love
What role does location play in dating apps? This guide shares how spatial analysis can be used to optimize dating apps with real examples.
Women in STEM: reflections & advice from CARTO's experts
To mark Women in STEM day 2023, we interviewed experts across CARTO to hear advice and reflections on a career in STEM.


Calculating Routes at Scale using SQL on BigQuery
A guide to route optimization using Google BigQuery, a cloud-native & scalable alternative to PgRouting & Network Analyst.
How to get your colleagues & clients excited about geospatial
A guide to getting your colleagues & clients excited about geospatial technology and spatial analysis, with practical tips and advice
22 of the best maps, visualizations & analysis from 2022
A round-up of some of our favorite pieces of analysis, maps and visualizations using CARTO from 2022 in areas including retail, transport, climate & more!
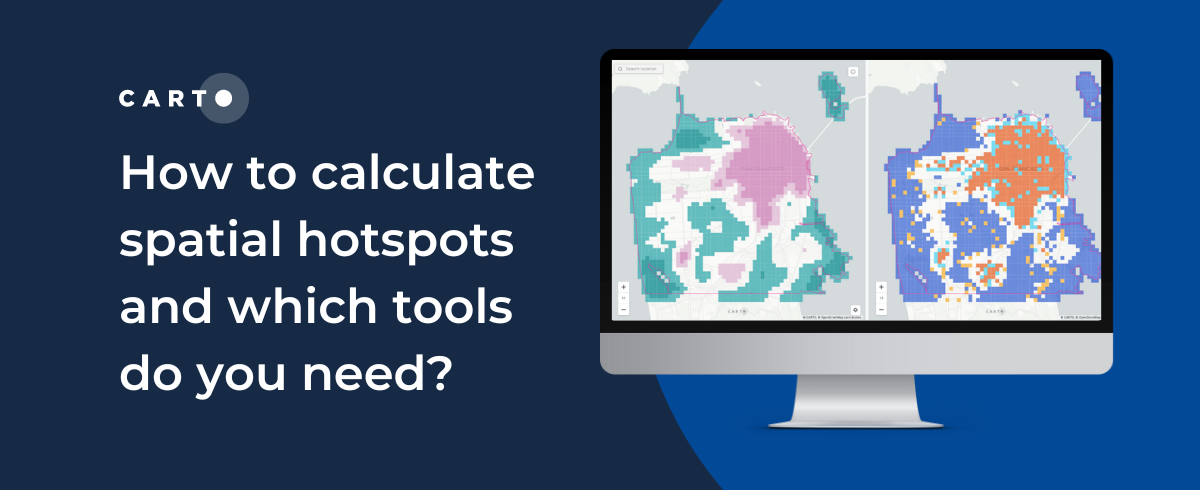
How to calculate spatial hotspots and which tools do you need?
A comparison of the main spatial hotspot tools and which is best for your use case, including a guide on how to use and interpret these.
The Ultimate Guide to OpenStreetMap & BigQuery
A guide to the pros & cons of OpenStreetMap geospatial data, and how to access it via Google BigQuery


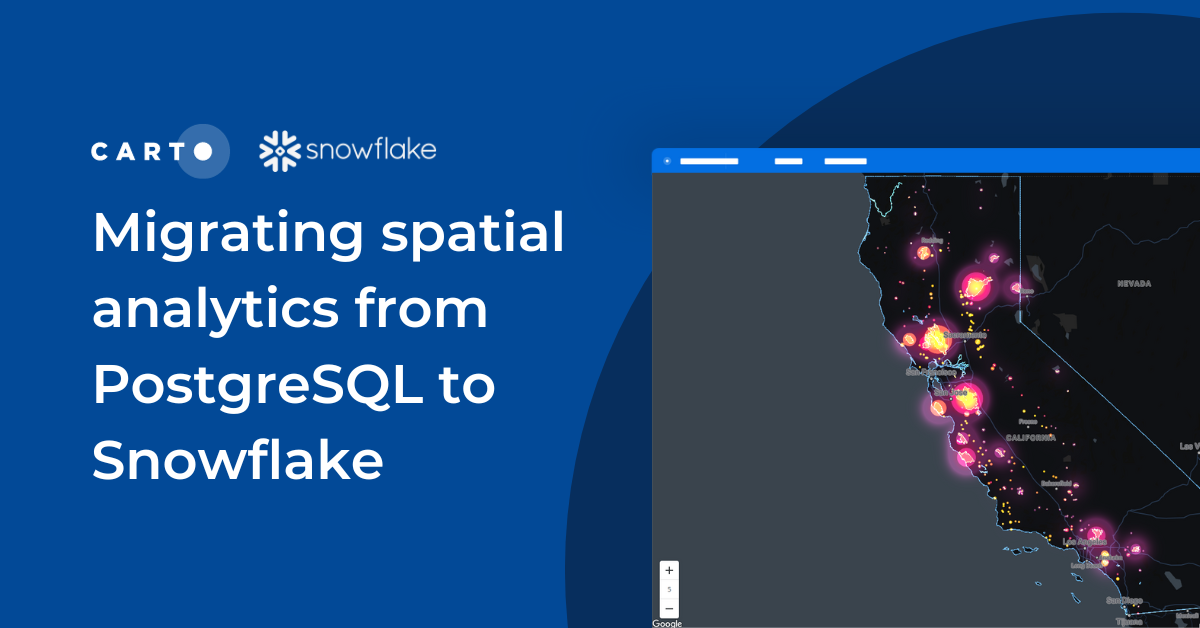
Migrating spatial analytics from PostgreSQL to Snowflake
Discover seamless migration steps from PostgreSQL to Snowflake for advanced spatial analytics. Unleash the power of CARTO for scalable, performant workflows.
What we learned: #SDSC22 New York
Miss the Spatial Data Science Conference in NYC? Here’s a quick recap as well as information about how to get involved in future events.


IoT Analytics & Geospatial Data: How It Works
We explore how IoT Analytics use cases are driven by geospatial data for catastrophe modeling, in smart cities & supply chain.
CARTO’s Ultimate Guide to Spatial Joins & Predicates with SQL
Get started with Spatial SQL with this guide to using spatial relationships.
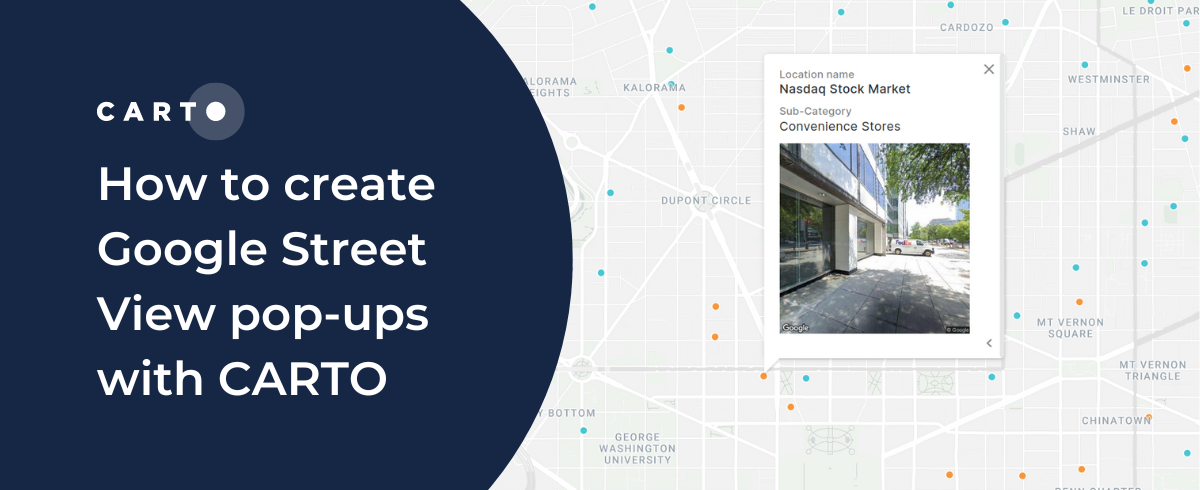
How to create Google Street View pop-ups with CARTO
CARTO's guide to using Google Street View images in your map pop-ups.
Using Location Intelligence to combat The Great Resignation in Logistics
The Great Resignation means competition for staff is ever increasing. CARTO explores how spatial unemployment patterns can be used to tackle this.
Venue Suitability Analysis for the Eurovision Song Contest with CARTO
How to use Location Intelligence to pick the optimal venue for the UK's Eurovision Song contest with CARTO
Sistema.bio's Story: Optimizing field operations with CARTO
Understand how Sistema.bio is using CARTO to manage and plan their field operations to bring their sustainable biodigester to the world’s smallholders.
COVID, mapped: The analytics behind an epidemic
CARTO teams up with ZOE to analyze & predict the spatial patterns of COVID-19to develop a blueprint for understanding the spatial patterns of an epidemic.


Exploratory Data Analysis: UK retail centres
CARTO shares how you can use Exploratory Data Analysis to better understand your data and frame future analysis with CDRC’s latest dataset - UK Retail Centres
Super Charged Site Selection for Electric Vehicles
CARTO partners with CITD to understand how Location Intelligence can be used to drive stronger return on investment for Electric Vehicle charging stations.


Analyzing Sentiment & Footfall in Post-COVID Berlin
Follow along as Data Appeal uses CARTO’s Location Intelligence platform to evaluate tourism in Berlin post-COVID.
Cost of Living Crisis: Location Intelligence for Energy Efficiency
Improved availability & analytics of residential energy performance data will be a powerful tool to help during this crisis. Learn more & see it in action.


The Changing Role of the GIS Analyst
Discover how GIS Analysts are evolving from map makers to strategic AI-driven experts shaping enterprise decision-making with cloud-native tools.


Unlock planetary-scale insights with CARTO & Google Earth AI
Learn how CARTO & Google Earth AI make planetary-scale insights accessible with foundation models & Agentic GIS.


How to build a geospatial AI roadmap (that actually works)
Only 1 in 4 AI projects deliver ROI. Discover a proven 5-step roadmap for scaling geospatial AI - govern data, automate workflows, and unlock Agentic GIS value.


Introducing CARTO Site Selection AI Agent for Gemini Enterprise
Transform Site Selection with CARTO’s AI Agent in Google's Gemini Enterprise - analyze, compare, and plan new locations in minutes.


Agentic GIS has landed: redefining geospatial for your organization
Discover how CARTO’s Agentic GIS platform and AI Agents are transforming spatial analysis - making Location Intelligence accessible to everyone.


.jpg)
Navigate consumer demand with NIQ Purchasing Power Data
Navigate consumer demand with NIQ Purchasing Power Data. Understand consumer spending, optimize location planning, and boost marketing.


Branch out: new control components for more resilient workflows
Discover CARTO Workflows’ new Conditional & Success/Error Split components to build flexible, resilient spatial analysis pipelines.


5 ways to transform spatial analysis for environmental resilience
Discover 5 ways to transform spatial analysis for environmental resilience using cloud-native GIS, automation, and real-time insights.


Cotality’s Location Intelligence Insights - now in CARTO
Explore Cotality’s US Location Intelligence data in CARTO - now available via Data Observatory for fast, actionable spatial insights at scale.


.jpg)
Pain-free data integration with Overture Maps, GERS & Databricks
Seamlessly integrate spatial data with Overture Maps, GERS & Databricks for fast, scalable geospatial analysis - no ETL or data wrangling needed.


Personalizing services with spatial analytics in Google Cloud
Personalize services at scale with spatial analytics on Google Cloud. Learn how to boost ROI using CARTO for location-based insights.


Geospatial & AI at the Databricks Data + AI Summit 2025
Explore the biggest geospatial & AI highlights from Databricks Data + AI Summit 2025, including Agent Bricks & native Spatial SQL.


Snowflake Summit 2025 - highlights for geospatial
Discover top geospatial highlights from Snowflake Summit 2025 -from AI to open formats -shaping the future of cloud-native spatial analytics.


From selection to consolidation: 6 ways to optimize site planning
Optimize site planning with data, AI, and real-time insights. Discover 6 of the best strategies in this expert guide from CARTO.


Geo for the Agentic Era: Highlights from #SDSC25 London
Explore how AI, open data, and scalable geospatial tech are redefining GIS at #SDSC25 London. Catch highlights, keynotes, and sessions on demand.


Live maps with automated Workflows integrations are here
Create live, always-updated maps with CARTO by integrating Workflows and Builder. Automate geospatial analysis to visualization in one step.


Google Cloud Next 2025: Key takeaways for geospatial
Discover key geospatial insights from Google Cloud Next 2025 - AI, low-code tools, Earth Engine, and more innovations shaping the future of location tech.


The first 5 maps everyone needs to make with CARTO
New to CARTO? Start with these 5 essential maps! Learn how to analyze proximity, work with big data, integrate real-time updates, and leverage AI-driven insights.


Unlock raster analytics & visualizations - now in your lakehouse!
Unlock raster analytics in your lakehouse! Analyze & visualize raster data natively in CARTO for unmatched scalability, efficiency & cost savings.


CARTO AI Agents: now in public preview!
Discover how CARTO AI Agents are democratizing spatial analysis, making it accessible to all users. Learn about real-life applications revolutionizing geospatial industries.


The new CARTO QGIS plugin: take your GIS cloud-native!
Modernize your GIS with QGIS & CARTO for scalable cloud-based analytics. Maximize efficiency, security, and collaboration.


Drive smarter decisions with new BT mobility data in CARTO
Unlock mobility insights with BT Active Intelligence & CARTO! Drive smarter decisions with road-level data, OD matrices & seamless cloud integration.


24 of the best maps, visualizations & analysis from 2024
Discover 24 of the best maps, visualizations, and analyses from 2024! Explore innovations in geospatial data, user-centric tools, & advanced spatial analytics.


How to retrieve spatial data from APIs, the no code way
Learn how to retrieve spatial data from APIs without coding! Discover the benefits of using REST APIs for scalable and automated geospatial analysis.


Cloud-native Life Sciences analytics with CARTO & Snowflake
Optimize Life Sciences analytics with cloud-native geospatial solutions using CARTO & Snowflake. Scale data insights for improved decision-making.


What is Supply Chain Network Design and How Does It Work?
Improve your supply chain network design! Use spatial analysis to optimize your supply chain design for cost savings, efficiency, resilience & sustainability.


Boost Telecom Analysis with FCC Data - now available on CARTO!
Access FCC telecom data on CARTO for seamless, cloud-native insights! Analyze broadband & mobile availability, speeds, and more for the entire U.S.


New to CARTO? Try these 5 things first!
New to CARTO? Discover the first 5 things to try, from running a cloud-native spatial analysis to creating your first map.


The State of Spatial Data Science 2024 - get your free copy!
Download your FREE copy of The State of Spatial Data Science 2024; stay ahead with insights on AI, cloud integration, GIS, climate impact & more!


Introducing CARTO Heatmaps for Big Data Visualization
Enhance your big data visualization with CARTO's heatmap style! Learn how to impactful, large-scale heatmaps with this guide.


Enhancing geospatial analytics with CARTO & Databricks
Unlock advanced spatial analysis in Databricks with CARTO’s Analytics Toolbox. Visualize & analyze large geospatial data inside your data warehouse.


Understanding flood risk at scale with Fathom’s new Risk Scores
Fathom's Flooding Risk Scores now available on the cloud with CARTO! Make more intelligent decisions for insurance, financial services & engineering.


Smarter Investment Decisions for Workspace Providers: The Instant Group
Make smarter investment decisions for flexible workspace with The Instant Group’s Coworkintel platform, powered CARTO.


What are isolines and how to use them with CARTO
Learn what isolines are and how to use them at CARTO. Follow this quick guide for creating isolines & trade areas. Use them to derive actionable insights.


BT Active Intelligence Location Insights Now Available with CARTO
Access hyper-local footfall insights with BT Active Intelligence Location Insights, now available with CARTO! Explore granular mobility data in the cloud.


H3 Spatial Indexing, accelerated with Snowflake & CARTO
H3 Spatial Indexing is now available natively in Snowflake - learn about our new H3 Acceleration Program and discover how to get started!


Introducing Workflows Templates: pre-built spatial analysis
Boost efficiency with CARTO Workflows Templates - no-code spatial analysis made easy. Explore pre-built templates for streamlined geospatial projects.


Elevate your real estate property analysis with CARTO & Markerr
Announcing CARTO & Markerr's data partnership! Subscribe to spatial real estate data including transactions, rent and property details.


5 Advantages of No Code Spatial Analysis
Is no code for spatial analysis possible? Discover 5 advantages to go no code & see CARTO Workflows in action! Reduce bottlenecks, save time & de-risk.


Geographic Segmentation: How to get started
Get started with Geographic Segmentation with our guide & tutorials. Leverage demographic & consumer data to tailor your strategy & maximize ROI.


Modernizing the Geospatial Analysis Stack report - get your copy!
Level up your geospatial analysis with our FREE report! Modernize your tech stack for bigger, faster, and more collaborative spatial analysis.


23 of the best maps, visualizations & analysis from 2023
Explore 23 of the best maps and visualizations of 2023. From advanced analytics to awesome visualizations with huge geospatial data.


Pie Charts: An Effective Data Visualization Tool?
A guide to creating Pie Charts for effective spatial Data Visualization & dashboards, including best practice and examples.


Using crime data & spatial analysis to assess home insurance risk
Discover how spatial analysis of crime data can be used for smarter home insurance decisions, including personalized underwriting & targeted marketing.


Space-time hotspots: how to unlock a new dimension of insights
How to use Space-Time Clustering to generate insights & optimize decision making with this step-by-step guide.


Introducing the Spatial App Development Summit NYC!
Join the first-ever Spatial App Development Summit! Engage with experts, explore cutting-edge tools, and shape the future of spatial app development.


Cannibalization Analysis: what is it & how can I use it?
Balance competing demands between multiple business locations with our 4-step guide to Cannibalization Analysis: from data collection to decision!


Boosting Retail & CPG Sales with Sentiment Analysis
Leverage sentiment analysis for retail growth. Explore Data Appeal's insights, using sentiment data for strategic business expansion. Free 14-day trial.


Spatial interpolation: which technique is best & how to run it
Fix missing or coarse data with Spatial Interpolation. Compare IDW and Kriging methods & follow along with tutorials!


Driving Decisions with Spatial Analysis: Vacation Rentals
Discover spatial trends in vacation rentals & relationships with land use, ft. tutorials on how to conduct this analysis and use it to drive decision-making.


Map tiles: 5 examples to get started
Learn how to effectively visualize geospatial data with tilesets, including a step-by-step guide and 5 examples to inspire you!


Do you need to code for a career in data?
Exploring the role of coding in data careers | Do you need to learn, and which language is right for you? Low-code, SQL, Python, R, HTML & Javascript.


%20Koronkowski.jpeg)


%20Koronkowski.jpeg)

Boosting International CPG Market Share with Location Intelligence
Unlock Global CPG Growth with Location Intelligence! Overcome challenges, target the right markets, cater to preferences & boost revenue.


Unlock the Potential of Spatial Indexes: 10 Powerful Uses of H3
Unleash the potential of H3 and revolutionize spatial data analysis with this lightweight global grid system. Explore real-world examples.


Self-service spatial analytics with user-defined parameters
Unlock Spatial Insights for non-expert users with User-Defined Parameters. Learn how to democratize geospatial data analysis for faster decision-making.


Improving Customer Experience in Telecoms with Geospatial
A guide to using geospatial to improve the Telecom customer experience, including network optimization, service personalization & targeted support.


A Guide To Using GTFS Data
The General Transit Feed Specification - or GTFS - is a specification for transit data. Use GTFS data for transit analysis & map visualization. Free tutorial.


How Geographically Weighted Regression works
Find out what Geographically Weighted Regression (GWR) is, how it works, when to use it & how to use spatial indexes in conjunction.


How To Optimize Location Planning For Wind Turbines
Optimize wind farm locations with our guide on location planning for wind turbines. Explore criteria, spatial analysis, and use CARTO for a free trial.


5 maps you didn't know you could create with SQL
Did you know you can use Spatial SQL to create amazing maps and data visualizations? Learn how with these five examples.


How to use Location Intelligence to grow London's brunch scene
How to use Location Intelligence tools to establish new opportunities for specific restaurant types, based on geosegmentation and catchment areas.


Finding that Spatial someone: using analytics to find love
What role does location play in dating apps? This guide shares how spatial analysis can be used to optimize dating apps with real examples.


Women in STEM: reflections & advice from CARTO's experts
To mark Women in STEM day 2023, we interviewed experts across CARTO to hear advice and reflections on a career in STEM.


Calculating Routes at Scale using SQL on BigQuery
A guide to route optimization using Google BigQuery, a cloud-native & scalable alternative to PgRouting & Network Analyst.


How to get your colleagues & clients excited about geospatial
A guide to getting your colleagues & clients excited about geospatial technology and spatial analysis, with practical tips and advice


22 of the best maps, visualizations & analysis from 2022
A round-up of some of our favorite pieces of analysis, maps and visualizations using CARTO from 2022 in areas including retail, transport, climate & more!


How to calculate spatial hotspots and which tools do you need?
A comparison of the main spatial hotspot tools and which is best for your use case, including a guide on how to use and interpret these.


The Ultimate Guide to OpenStreetMap & BigQuery
A guide to the pros & cons of OpenStreetMap geospatial data, and how to access it via Google BigQuery


Migrating spatial analytics from PostgreSQL to Snowflake
Discover seamless migration steps from PostgreSQL to Snowflake for advanced spatial analytics. Unleash the power of CARTO for scalable, performant workflows.


What we learned: #SDSC22 New York
Miss the Spatial Data Science Conference in NYC? Here’s a quick recap as well as information about how to get involved in future events.


CARTO’s Ultimate Guide to Spatial Joins & Predicates with SQL
Get started with Spatial SQL with this guide to using spatial relationships.


How to create Google Street View pop-ups with CARTO
CARTO's guide to using Google Street View images in your map pop-ups.


Using Location Intelligence to combat The Great Resignation in Logistics
The Great Resignation means competition for staff is ever increasing. CARTO explores how spatial unemployment patterns can be used to tackle this.


Venue Suitability Analysis for the Eurovision Song Contest with CARTO
How to use Location Intelligence to pick the optimal venue for the UK's Eurovision Song contest with CARTO


Sistema.bio's Story: Optimizing field operations with CARTO
Understand how Sistema.bio is using CARTO to manage and plan their field operations to bring their sustainable biodigester to the world’s smallholders.


COVID, mapped: The analytics behind an epidemic
CARTO teams up with ZOE to analyze & predict the spatial patterns of COVID-19to develop a blueprint for understanding the spatial patterns of an epidemic.


Super Charged Site Selection for Electric Vehicles
CARTO partners with CITD to understand how Location Intelligence can be used to drive stronger return on investment for Electric Vehicle charging stations.


Cost of Living Crisis: Location Intelligence for Energy Efficiency
Improved availability & analytics of residential energy performance data will be a powerful tool to help during this crisis. Learn more & see it in action.


How Yale Climate Connections Uses Spatial Visualization for Community Engagement
See how Yale Climate Connections used CARTO to create a spatial visualization that shares local stories to help explain climate change.


Ghost Kitchens: Predictive Location Intelligence
CARTO uses Location Intelligence to predict locations of one of the hottest trends in food delivery - ghost kitchens.


Hexagons for Location Intelligence: Why, When & How?
CARTO explains how using hexagonal grids in your location-based analysis can lead to more efficient analysis and greater insight.


Understanding Retail Store Clusters with Local Outlier Factor Analysis
“See how Local Outlier Factor can be used as a tool for understanding the spatial patterns of retail store locations."


Dark Store Site Selection: How Geospatial Data Can Help
See how market leaders are doing dark store site selection using geospatial data & analytics with CARTO & Snowflake.


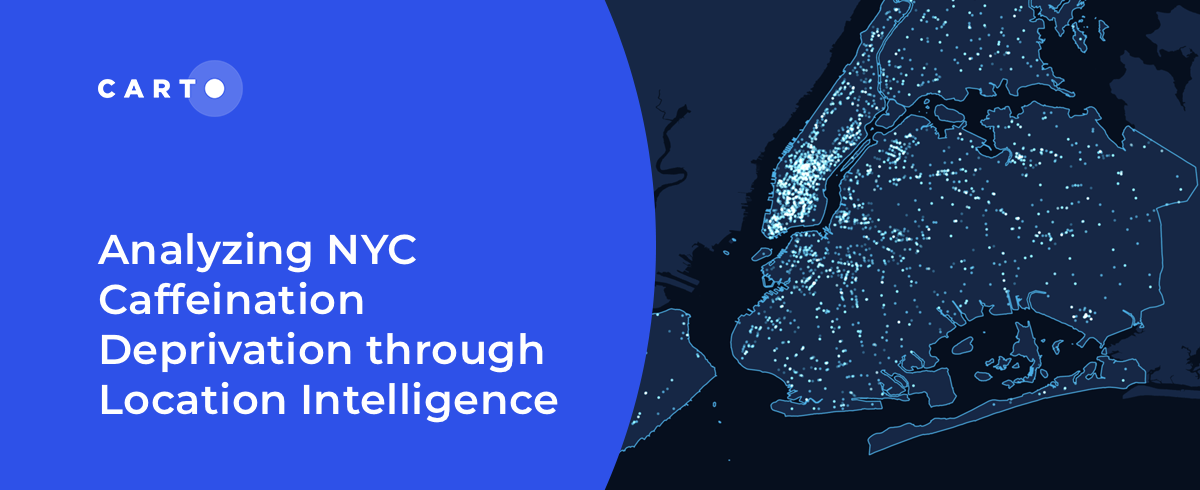
Analyzing NYC Caffeine Deprivation through Location Intelligence
“Curious about the number of coffee shops in NYC? Join us as we investigate the spatial patterns of coffee shops across the city."


International Women’s Day: Mapping Financial Inequality by Gender
“For International Women’s Day 2022, CARTO uses location intelligence to analyze financial inequality between gender in different countries. "
How to Build a Tree Equity Index & Dashboard using BigQuery
Lack of trees is linked to higher temperatures & more violent crime. Discover how to use the BigQuery Spatial Extension & CARTO for React to build a tree score dashboard.
How to Visualize Urban Growth with Spatial Analytics in BigQuery
How has your city or urban area grown? Discover how to create an Urban Growth visualization using open data & CARTO's Spatial Analytics in BigQuery.
How to Improve Retail Trade Area Accuracy with Mobility Data
Read how to improve retail trade area accuracy by moving beyond buffers & drive times to using spatial analysis & human mobility data
React to the Changing Face of Retail DIY with Behavioral Data
With COVID-19 causing dramatic shifts in consumer spending behavior, DIY & other retailers can leverage geospatial data to discover new revenue opportunities.
CARTO BigQuery Tiler Upgrade Gives Speed & Feature Boost
Read about new features to CARTO BigQuery Tiler: the fastest, most convenient, & cost effective way to visualize spatial Big Data & generate Tilesets for the web
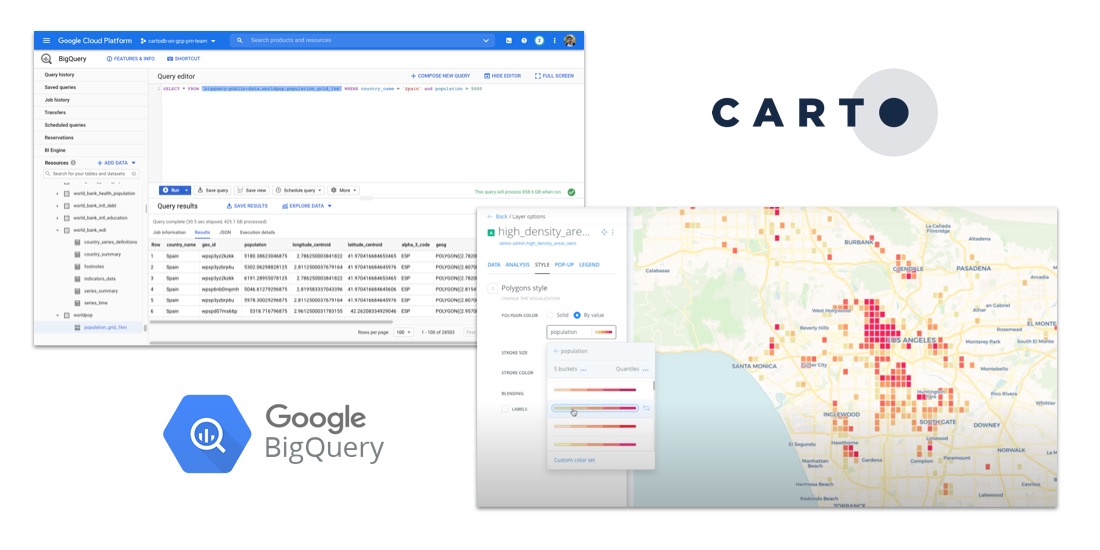
How to Analyze Google BigQuery Data in CARTO
Learn how to visualize geospatial Big Data hosted in Google BigQuery by creating a CARTO instance on the Google Cloud Platform & using our BigQuery Connector.
CARTO + Placekey: Cloud Native Spatial Linkability
Learn more about our integration with Placekey, enabling universal standard identifiers for any physical place to be used with spatial analysis & visualization.
Improving Healthcare Access with BigQuery Tiler
Identifying high impact health facility locations with CARTO's BigQuery Tiler & open-sourced geospatial Big Data.
Where Do Expats Invest in Property on the Spanish Coast?
See how idealista used geospatial analysis & real estate location data to uncover fascinating insights on coastal property demand in Spain
CARTO & Google Cloud Announce Partnership
CARTO is now a Google Cloud Partner & available on the Google Cloud Platform Marketplace enabling analysis & visualization within a rich ecosystem.
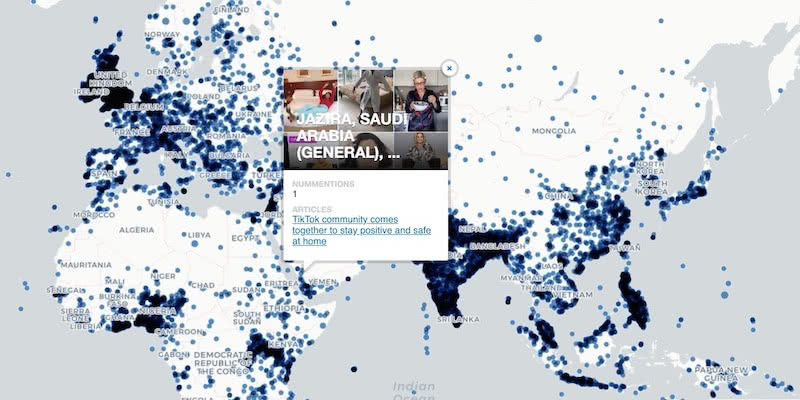
Google BigQuery Visualization: Mapping Big Spatial Data
The GDELT Project describe how to use Google BigQuery to visualize their dataset of online news coverage focusing on COVID-19
Google Analytics Spatial Data Visualized with BigQuery
Our partner Liveli takes a look at how to visualize spatial data from Google Analytics using BigQuery, gaining deeper insights from website traffic.
What Geospatial Analysis tells us about Meatpacking & COVID-19
One of our partners, makepath, describe how to use multiple open source spatial libraries for COVID-19 analysis focusing on the US meatpacking industry.
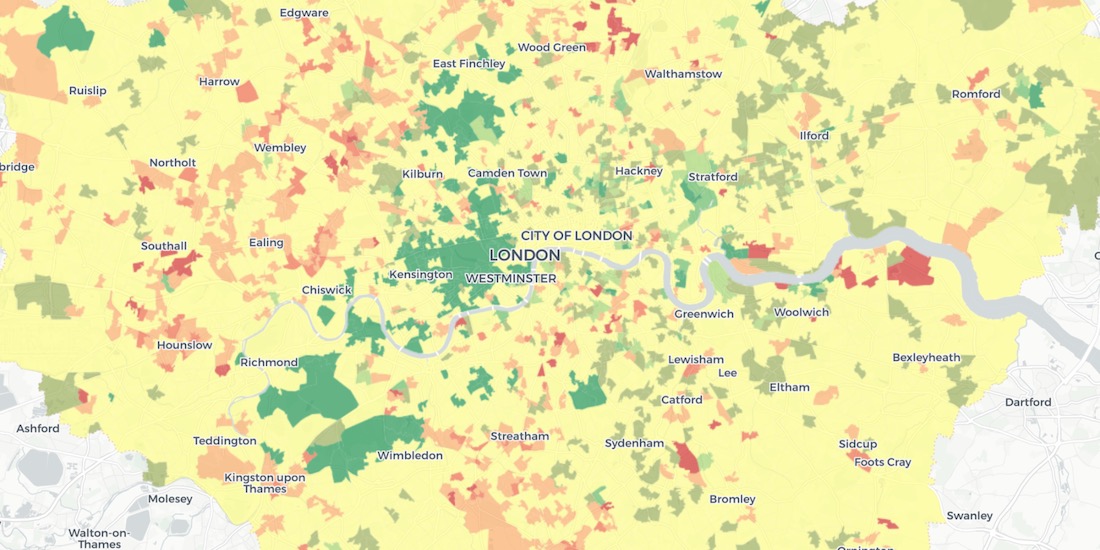
Using Spatial Analysis to Measure UK Gentrification
Read how Spatial Analysis & Machine Learning were used by researchers at UCL to understand neighborhood real estate changes & shape policy making in cities.
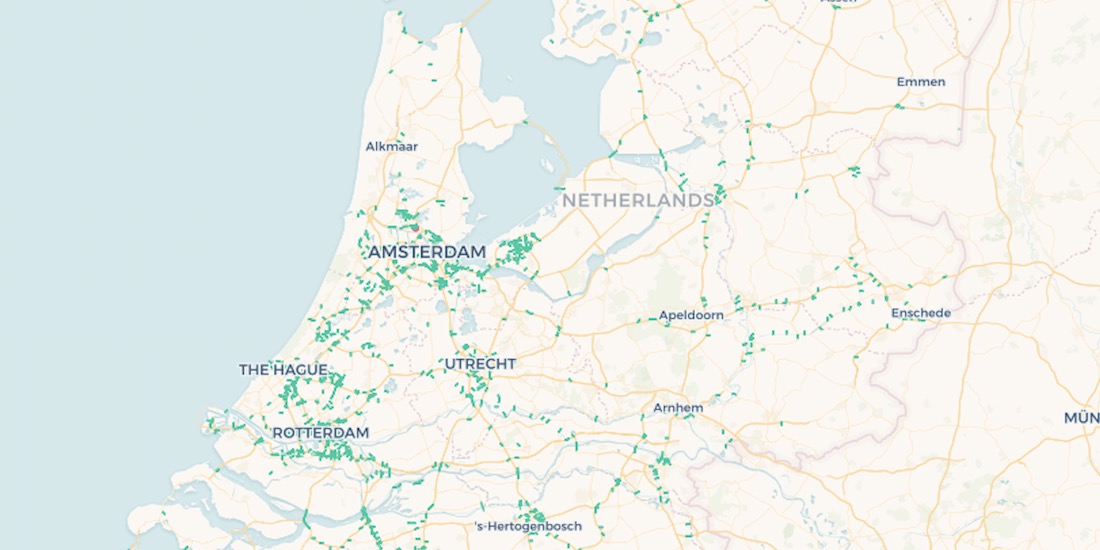
10,000 Dutch Bridges: A Foray into Using BigQuery Connector
Explore how to use our Google BigQuery connector to import large public datasets for geospatial analysis.


.png)
.png)
%20(1).png)
.png)

.png)
.png)
.png)
.png)
.png)
.png)
.png)


.png)


.png)
.png)


.png)




.png)
.png)
.png)



.png)

.png)


.png)

.png)
.png)




.png)
.gif)
.png)
.png)
.png)
.png)
.png)









.png)


