Live maps with automated Workflows integrations are here


At CARTO, we’re always looking for ways to make spatial analysis faster, more collaborative, and more impactful. Today, we're excited to unveil an exciting new feature that connects two of our most important tools - Workflows and Builder.
Workflows is our low-code tool for automating data processing, while Builder turns your analysis into interactive, visually compelling maps. Our new Create Builder Map component integrates these two tools in a seamless, intelligent way, allowing you to streamline your data pipeline between analysis and visualization.
This integration allows you to generate interactive maps directly from a Workflow, saving time, reducing manual effort, and ensuring consistency. The real power of this feature is its ability to keep your maps in sync with the latest analysis results - creating "live maps" that are always powered by the most up-to-date data in your workflows.
Whether you’re preparing a one-off analysis or operationalizing a process that runs on a schedule or via API, this component will supercharge how you create, manage, and share geospatial insights - keep reading to learn how!
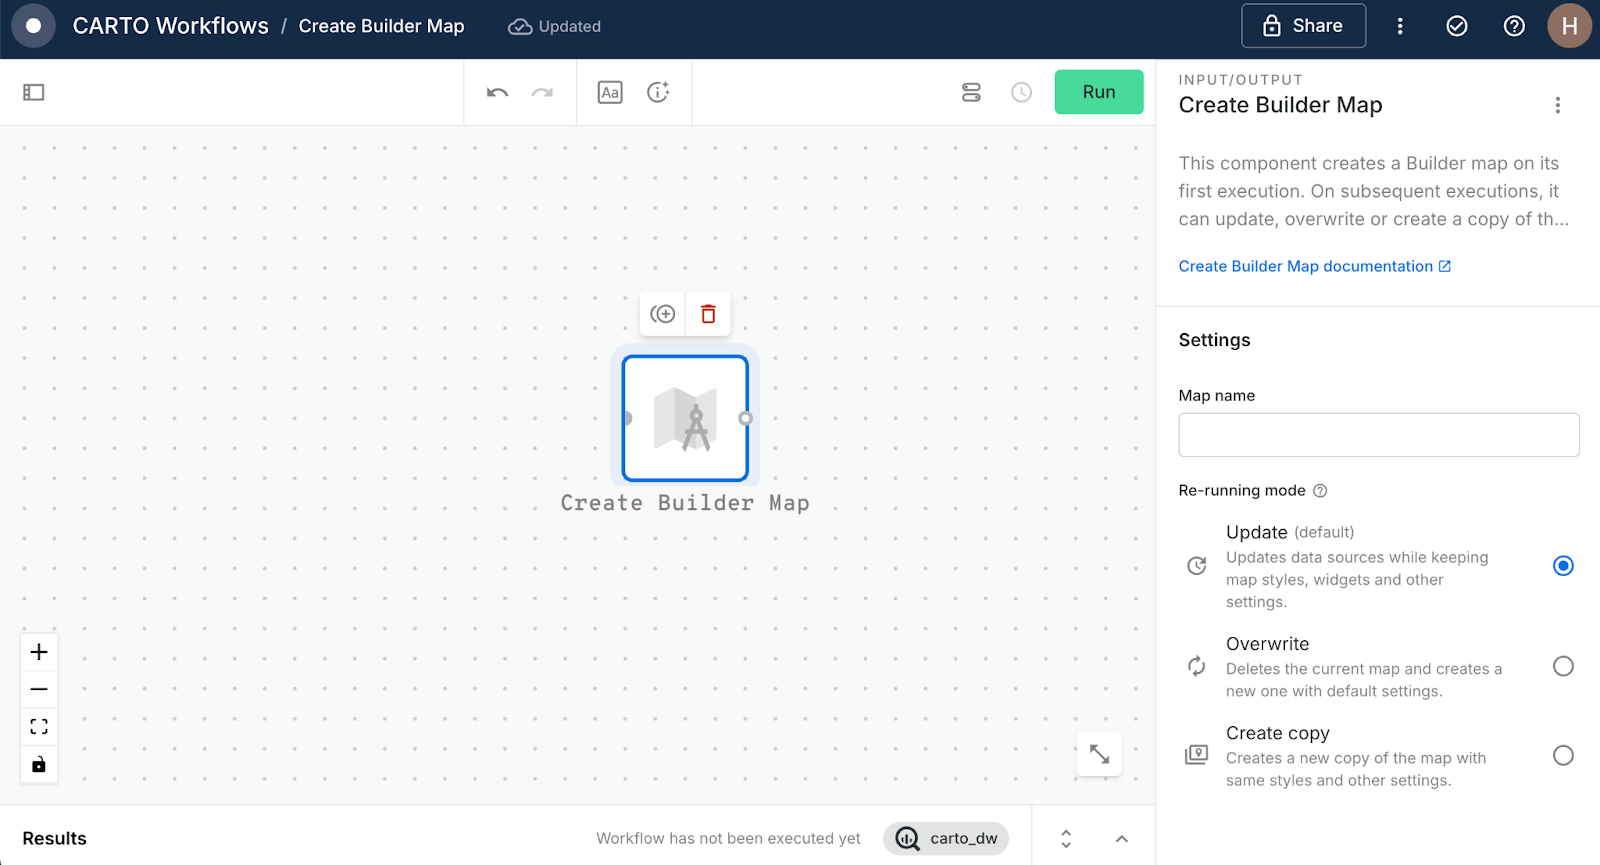
What is the Create Builder Map Component?
The Create Builder Map component allows users to create or update maps in Builder automatically when a Workflow is executed. You can define the data sources in the Workflow, control how the map is generated, and access the result instantly via a clickable link - all without ever leaving the Workflows interface.
The component supports three flexible modes:
- Update an existing map, preserving styles and widgets (when schemas are compatible).
- Overwrite to fully regenerate a map from scratch.
- Create copy to generate a new, styled map for each execution.
This component is ideal for analysts who want quick visualizations, developers building internal tools, or teams needing standardized, repeatable map outputs. The best part? Your maps are always powered by your analysis: any changes in the Workflow’s data sources are automatically reflected in the Builder map – no need to sync manually or re-upload data. This means your visualizations stay live, consistent, and always aligned with the latest results of your analysis.
5 ways you can use the Builder Map Component
1. Deliver always-current insights
Use Workflows to process your analysis and push the results directly to an interactive Builder map. You can be confident that stakeholders are getting immediate access to the latest metrics, without you needing to manually update the map yourself.
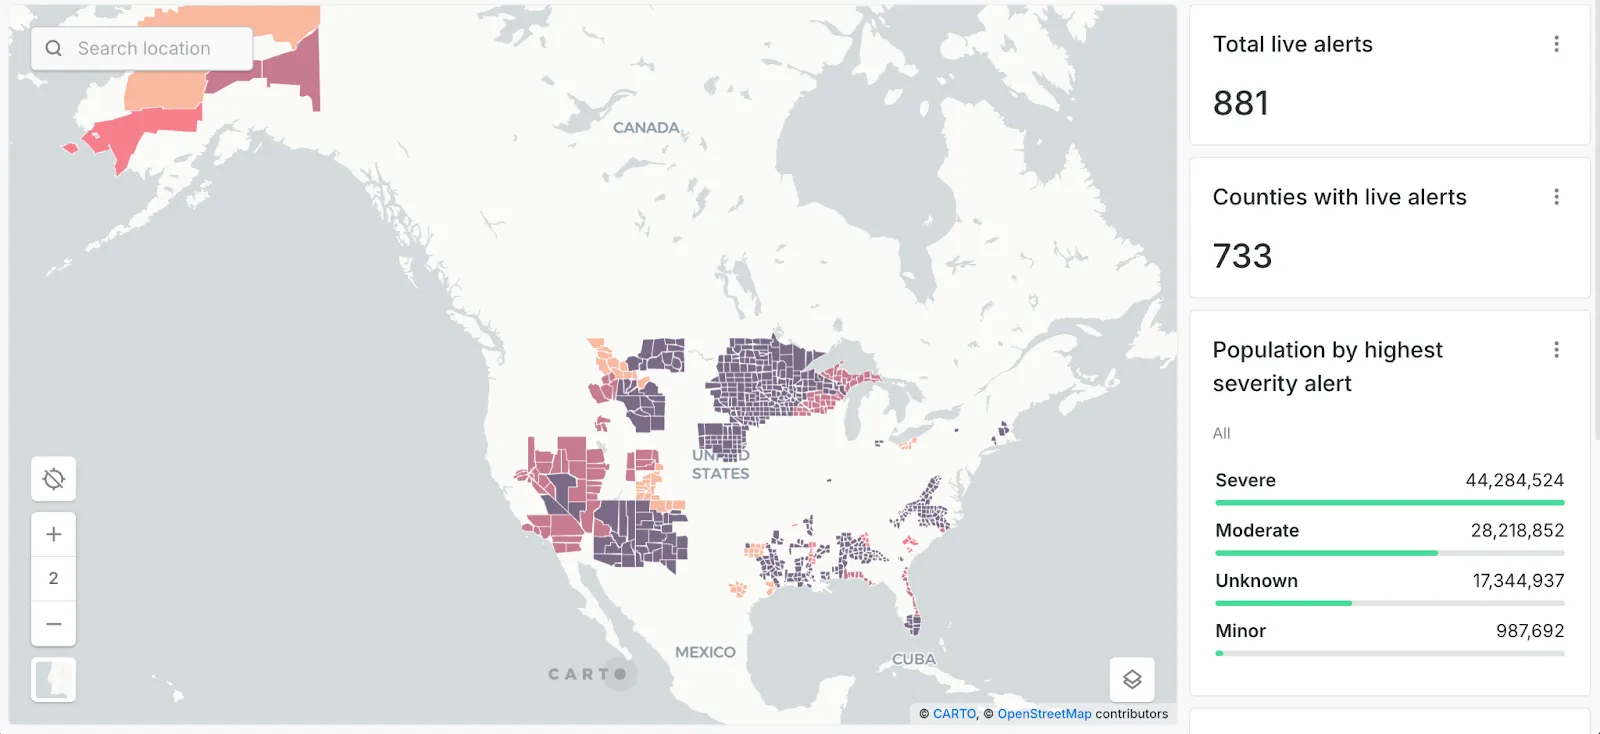
2. Automate operational dashboards via scheduled or API executions
For teams that rely on dashboards to monitor evolving metrics - such as service disruptions or environmental changes - automation is essential. By scheduling a Workflow to run at regular intervals, you can refresh your data pipeline and then use the Create Builder Map to automatically update the Builder map to reflect that output. This ensures decision-makers always see the most up-to-date geospatial picture.
In the video above, the new component is being used to productionize the creation of a live weather alerts dashboard. Once the user sets up and schedules the Workflow and uses the Create Builder Map component to integrate this with a map, their job is done - no tedious, time-consuming manual updates! You can explore the live results of this analysis below, or open in full-screen here.
Want to learn more about how you can leverage real-time analytics for your organization? Check out our webinar It’s time to go real-time: live spatial analytics with CARTO.
3. Standardize map production across teams
Organizations with multiple teams often need to produce maps with consistent formats, styles, and layers. By embedding a Create Builder Map component in standardized workflows, you ensure that every team’s output follows the same styling rules, legends, widgets, and branding – without manual setup.
4. Ensure visual consistency across repeat analyses
If you're running recurring analyses (e.g., weekly customer segmentation, quarterly site selection), re-generating the same map manually can introduce inconsistencies. The Builder Map component ensures every iteration is styled the same way and uses the correct widgets and layers - critical for comparing results over time.
In the example below, the user already has a map which shows cell tower density across Washington state. They use the Create Builder map to easily and quickly duplicate this for another state to support a different regional management team. All styling and map elements - such as widgets and pop-ups - are retained in the process.
5. Turn complex workflows into compelling visualizations
Great geospatial storytelling often requires more than just showing the end result - it means layering in the context: the data inputs and supporting layers that help users understand how you got there.
The Create Builder Map component streamlines this by allowing you to define all necessary map layers as part of your Workflow, so they’re automatically included and updated with every execution. You no longer need to manually add, update and configure each one in Builder. This makes it far easier to create rich, interactive visualizations that reflect the full journey of your analysis - perfect for sharing results in reports, presentations, or public dashboards.
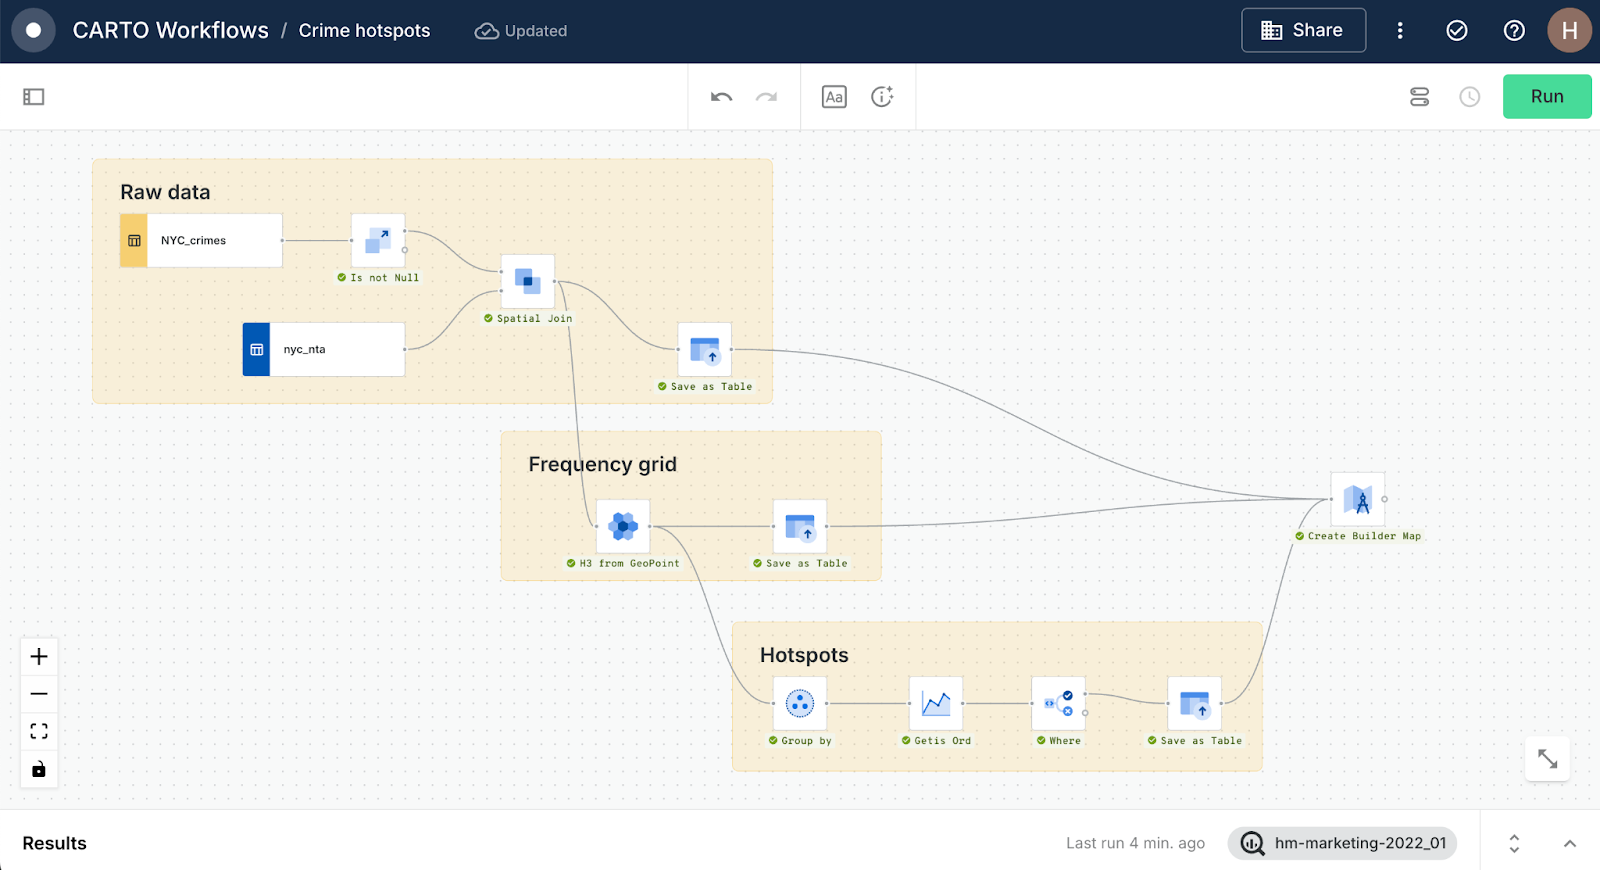
Here’s an example of what that might look like in action. The Workflow above calculates hotspots from NYC crime locations. Rather than just creating a map showing just these hotspots, the user has connected all three stages of the analysis - raw data, a frequency grid and the hotspots themselves - to a Create Builder Map component.
This helps users of the final dashboard (see below, or open full-screen here) validate the results of the analysis, without the map creator having to individually add layers to the map.
.webp)
Please note real-time updates to this map were paused on 23rd May 2025.
Conclusion
By linking your workflows directly to Builder maps, you’re not just automating map creation – you’re creating dynamic, always-updated visual layers that evolve as your data does. Whether you’re delivering dashboards to stakeholders or running daily pipelines, this integration ensures your maps are never out of date – they’re always reflecting the latest insights.