


CARTO AI Agents now integrated with Oracle Generative AI
CARTO AI Agents are now integrated with Oracle Generative AI, enabling secure, governed Agentic GIS and scalable geospatial AI in Oracle Cloud.


Unleash the Power of Snowflake with our Latest Connector
Snowflake users can now easily import large spatial datasets from the cloud into CARTO, becoming the first Location Intelligence platform with native support.

Data Observatory: Thousands of Spatial Datasets On Demand
We are excited to announce a new release of CARTO's Data Observatory giving users the ability to explore, subscribe, & manage thousands of spatial datasets.


Improvements to CARTO’s Direct SQL Connectivity
Our Direct SQL Connector now allows easy connection to apps such as Tableau & Power BI using native PostgreSQL connectors, & from SaaS solutions, such as Looker


How to Analyze & Visualize Spatial Data in Databricks
Explore examples of Databricks & CARTO together as part of a collaborative Data Science process including visualizing Big Data sets & creating ETL pipelines.

Dstillery Behavioral Spatial Data available in CARTO's Data Observatory
Dstillery's Behavioral Spatial Data is available through CARTO's Data Observatory to provide market segmentation & geomarketing insights.

Experian's WorldView Spatial Data available in CARTO's Data Observatory
Experian's WorldView Spatial Data is available through CARTO's Data Observatory to provide socio-demographic & consumer spending insights

What is Fleet Management & Best Spatial Practices
What is Fleet Management & how can Location Intelligence be used to improve efficiency, reduce costs, & provide compliance? We explore.


Spatial Data Scientist of the Year Award
At #SDSC20 the first winner of the Spatial Data Scientist of the Year award will be announced. Submit your nomination today!

#SDSC20 Speakers & Full Agenda Now Available
The Spatial Data Science Conference 2020 brings together leaders from industry, government, & academia for five days of talks on the latest technologies & techniques.

Improving Healthcare Access with BigQuery Tiler
Identifying high impact health facility locations with CARTO's BigQuery Tiler & open-sourced geospatial Big Data.
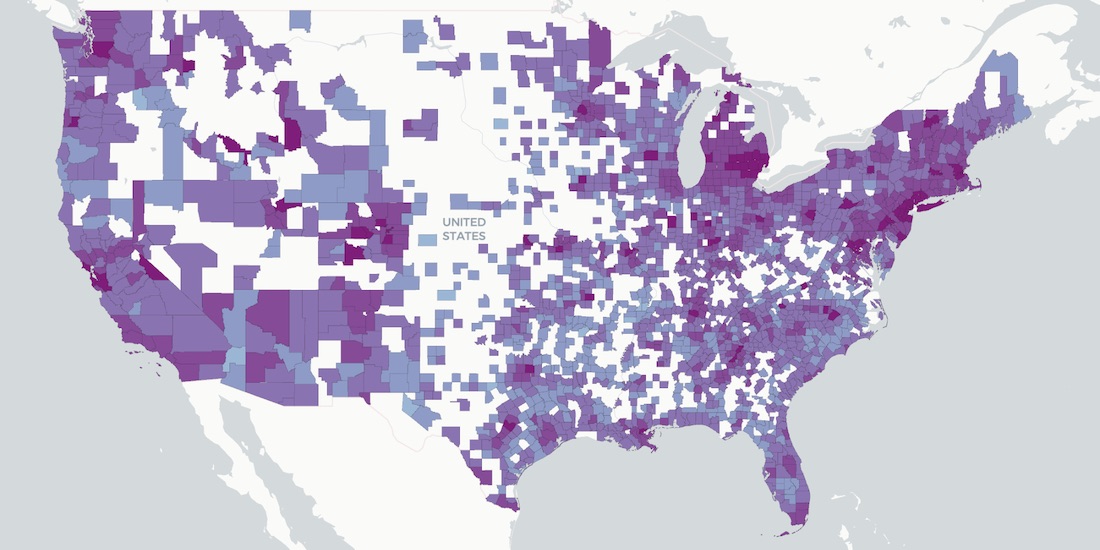

How Socioeconomic Factors relate to Mobility during COVID-19
A detailed geospatial analysis of how changes & regional disparity in human mobility during the COVID-19 lockdown can be related to socioeconomic indicators.

Announcing CARTO & Thinking Machines partnership
We are excited to announce that Thinking Machines a Data Science consulting firm specializing in geospatial, are now CARTO partners.

Academy
CARTO AI Agents now integrated with Oracle Generative AI
CARTO AI Agents are now integrated with Oracle Generative AI, enabling secure, governed Agentic GIS and scalable geospatial AI in Oracle Cloud.

Spatial Analytics in 2026: What's Changing?
Explore how AI, cloud-native tools, and evolving skills are reshaping spatial analytics in 2026, based on insights from 200+ geospatial experts.


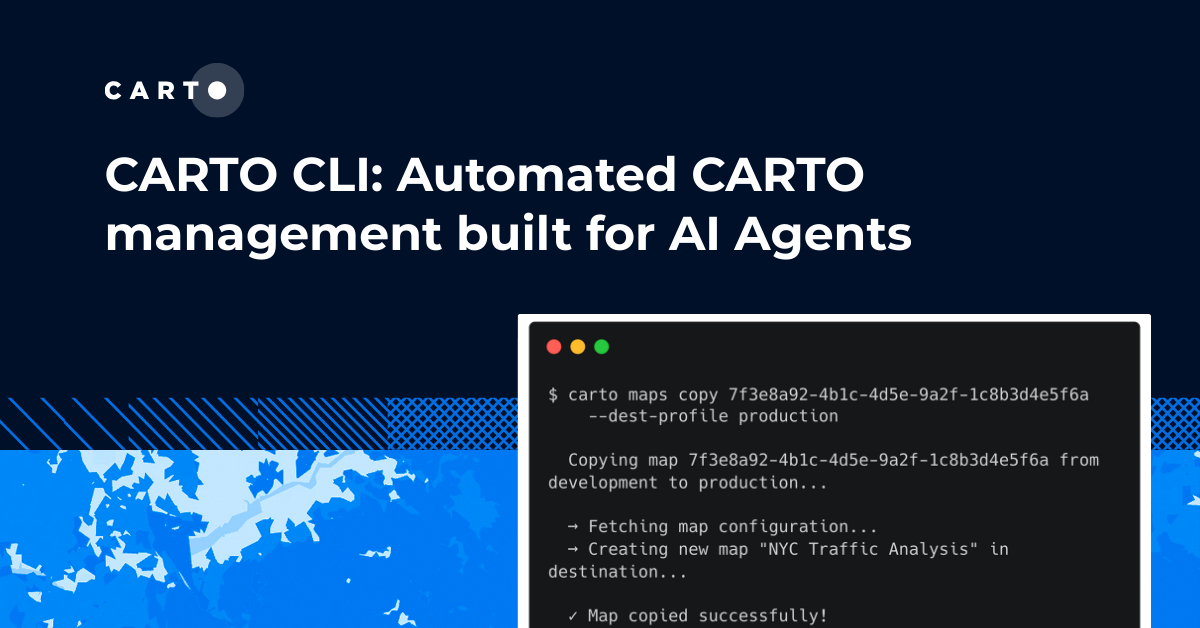
CARTO CLI: Automated CARTO management built for AI Agents
Meet the CARTO CLI: a command-line interface that unifies human expertise, automated pipelines & AI agents into one geospatial operating model.