Use cases


Fuel Shortage UK Maps & What Location Data Can Tell Us
Earlier this year many petrol stations in some parts of the UK ran out of fuel. Discover what location data can tell us about the real story behind the long queues.


CARTO selected for AI4Cities Phase 2 Sustainable Mobility Project
We are pleased to announce that we have been selected to participant in phase 2 of AI4Cities, a project to help cities accelerate their transition towards carbon neutrality


Climate Change & Extreme Weather: Hurricane, Wildfire, & Flood Maps
Climate change is contributing to extreme weather with increasing bursts of hurricanes, wildfires, & floods. See how maps can help plot, predict, & protect.
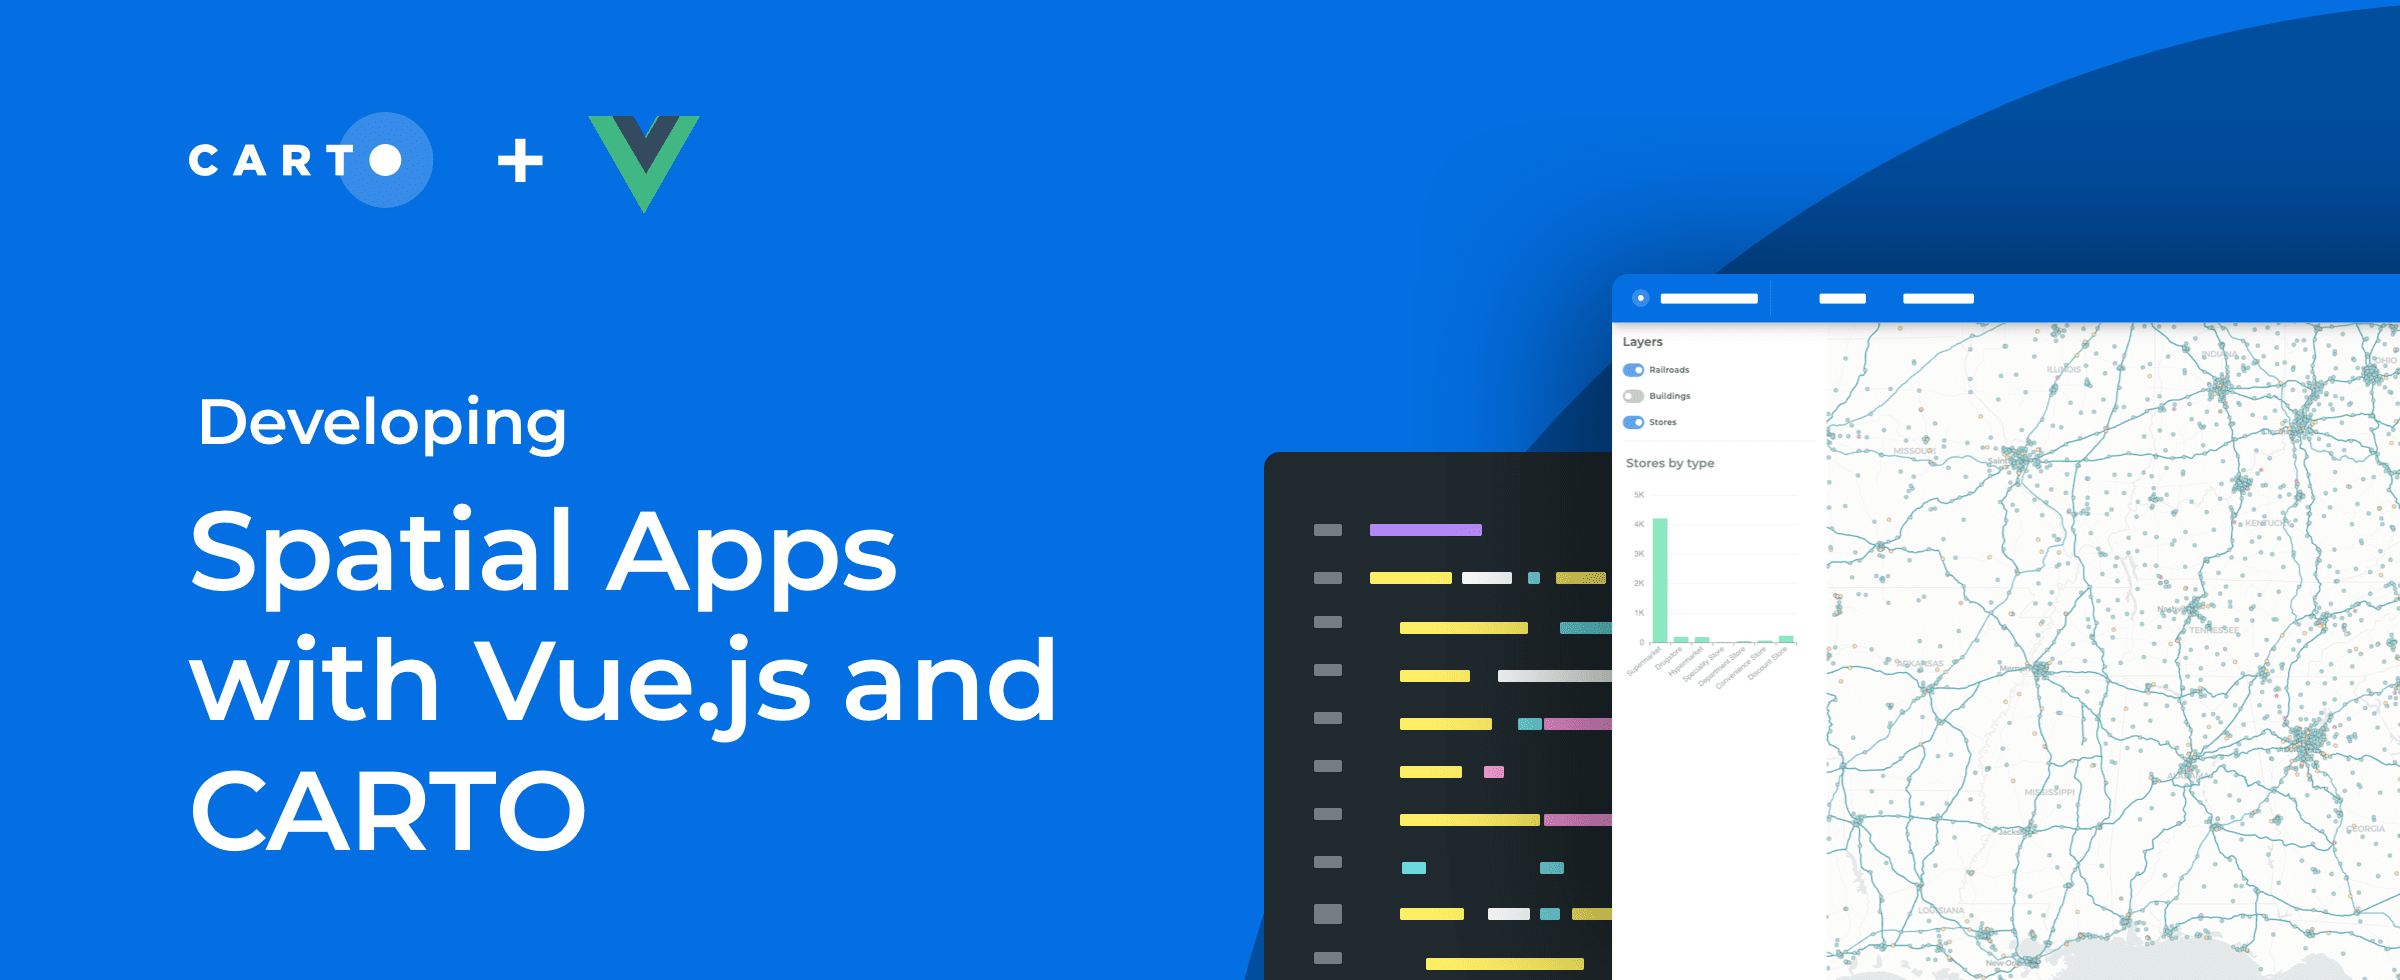

How to Build Scalable Spatial Apps with Vue.js & CARTO
Developing spatial apps with Vue.js? Check out our guide to how easy it is to integrate Vue.js applications with CARTO for deck.gl

Using Location Intelligence to Ease the Supply Chain Crisis
The disruption of global trade flows & a shortage of drivers has led to a global supply chain crisis. Read how Location Intelligence can be a road out of the crisis.


Canary Islands Volcano: Mapping La Palma Lava Flow & Damage
We use Spatial Data Science & CARTO to analyze & predict the damage caused by the eruption of the volcano on La Palma in the Spanish Canary Islands

Capturing the Sensitivity of National Wind Energy Potential to Local Siting Challenges
Wind energy is poised to be a significant contributor to national decarbonization goals, while there is enough wind available to power the nation, local siting challenges could have national implications. See how NREL is using location intelligence to better understand wind potential and it’s interaction with national clean energy targets.

A Look Back at 18 Months of COVID Grants & Maps
18 months since CARTO made it’s platform free to public & private sector organizations fighting coronavirus, we look back at some of the hundreds of grants.


Uncovering Site Selection Strategies using Point of Interest Data
Discover how Point of Interest (POI) data can be used to uncover site selection strategies of leading brands in the US including McDonald's, Starbucks, & Subway

Making Human Mobility Models Fair, Inclusive, & Private
Discover our Scientific Committee's latest insights when they gathered recently to discuss human mobility data topics including representation, bias, & privacy.

How to Build a Tree Equity Index & Dashboard using BigQuery
Lack of trees is linked to higher temperatures & more violent crime. Discover how to use the BigQuery Spatial Extension & CARTO for React to build a tree score dashboard.

Z Score Visualization: How to Identify Hotspots with BigQuery
Index, or Z Scores, have often been used in geospatial analytics to identify hotspots & rank locations. Discover how to visualize them using Google BigQuery.

Academy
.jpg)
Telco dashboards: Turning accessible data into actionable insights
Discover how CARTO enhances data accessibility, empowering decision-makers with actionable insights to improve network access for senior citizens and communities.

The first 5 maps everyone needs to make with CARTO
New to CARTO? Start with these 5 essential maps! Learn how to analyze proximity, work with big data, integrate real-time updates, and leverage AI-driven insights.

Unlock raster analytics & visualizations - now in your lakehouse!
Unlock raster analytics in your lakehouse! Analyze & visualize raster data natively in CARTO for unmatched scalability, efficiency & cost savings.