

Capturing the Sensitivity of National Wind Energy Potential to Local Siting Challenges


Onshore wind energy is among the fastest growing utility-scale renewable energy technologies in the world. With falling costs usage is on the rise with wind generation capacity increasing by a factor of almost 75 in the past two decades. With global capacity from onshore wind energy projected to reach nearly 750 GW by next year tens of thousands of turbines will need to be accurately sited by developers looking to achieve their maximum potential and profitability.
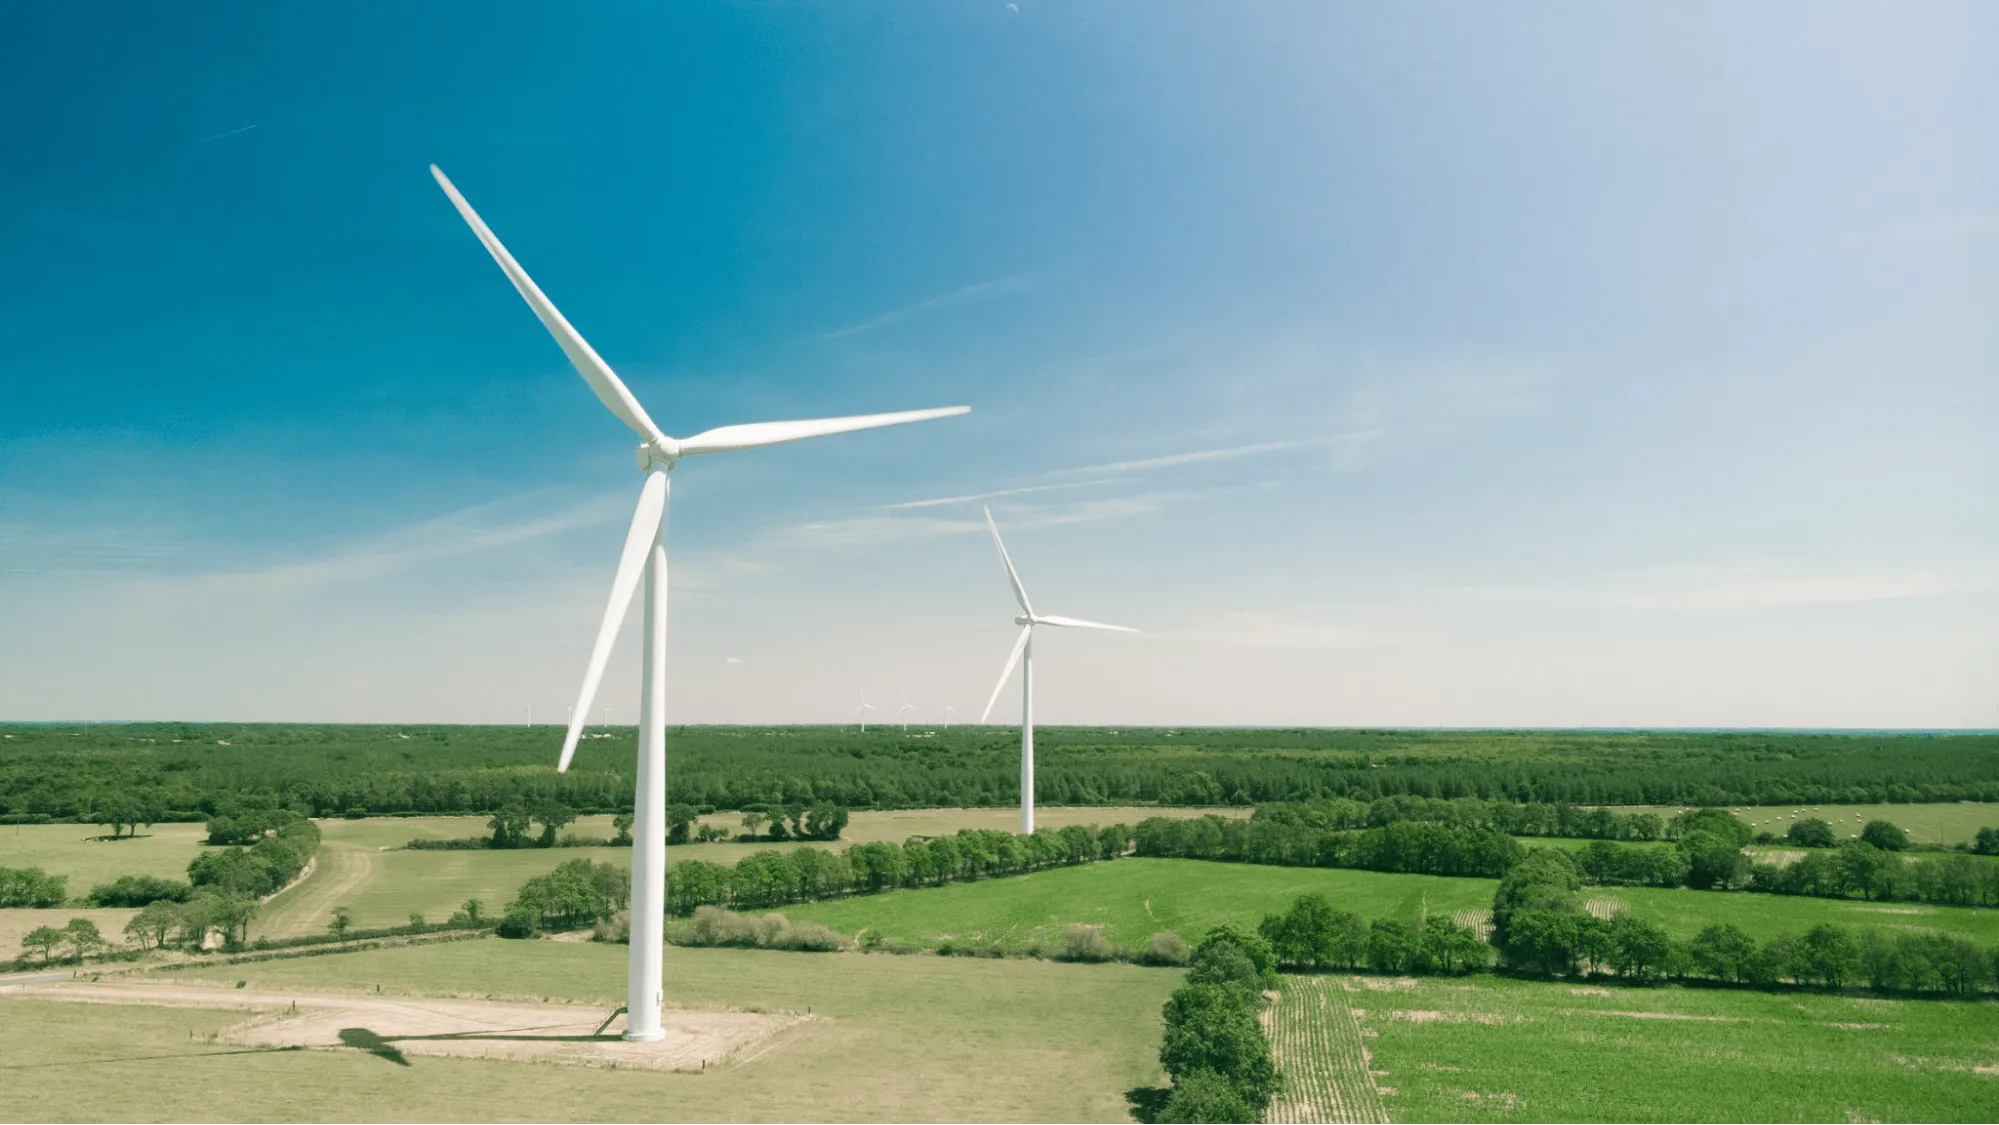
Wind farms are facilities made up of a group of high-power wind turbines connected to the power grid and are located in places that usually have a sufficient amount of wind available land and access to the power grid.
How else can Spatial be used in the Utilities Industry? Discover Next-Gen Use Cases
The National Renewable Energy Laboratory (NREL) specializes in the research and development of renewable energy energy efficiency energy systems integration and sustainable transportation. As a federally funded research and development center they are transforming energy through research development commercialization and deployment of renewable energy within the US. At CARTO Locations Anthony Lopez a Senior Researcher & Spatial Data Scientist at NREL talked about how Renewable Energy can be advanced through Spatial Analysis and Visualization.
More recently Anthony along with colleagues from the NREL (including Trieu Mai Matthew Mowers Eric Lantz Dylan Harrison-Atlas Travis Williams & Galen Maclaurin) released two research papers exploring siting challenges for wind technology and the implications for decarbonizing the electric grid.
In this post we take a look at some of the results from the first paper and how NREL are providing supply curve data and interactive maps to the research community.
Renewable Energy Supply Curves
Supply curves characterize the quantity quality and cost of renewable resources. Often developed within a scenario framework they capture a range of drivers that influence renewable energy potential. This foundational information serves as the basis for a variety of analysis and modeling applications including the interactions of wind energy project siting resource potential and power system evolution.
Wind Supply Curves
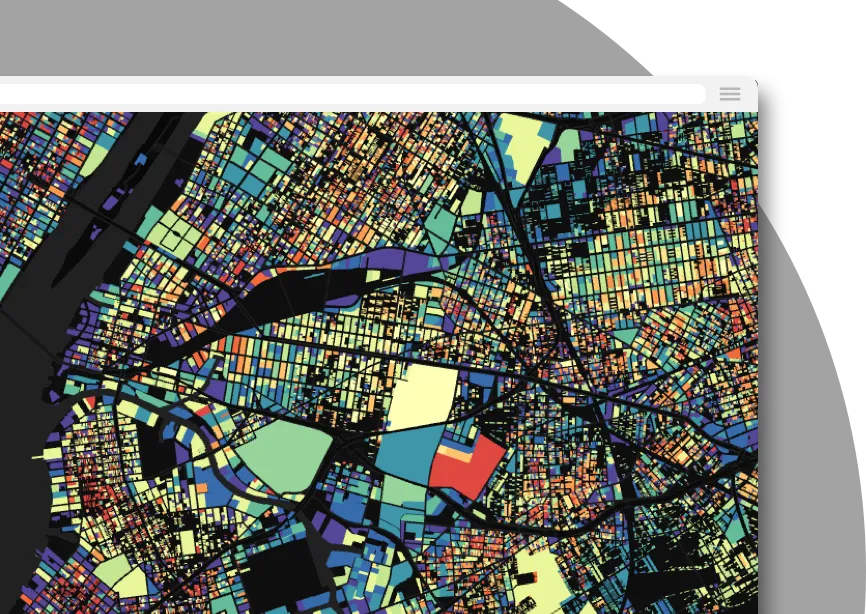
The interactive map below shows wind supply curves which characterize the quantity quality and cost of land-based wind resources. The geospatial data can be downloaded from the NREL’s website.
Solar Supply Curves
The interactive map below shows solar supply curves which characterize the quantity quality and cost of solar photovoltaic (PV) resources. The geospatial data can be downloaded from the NREL’s website.
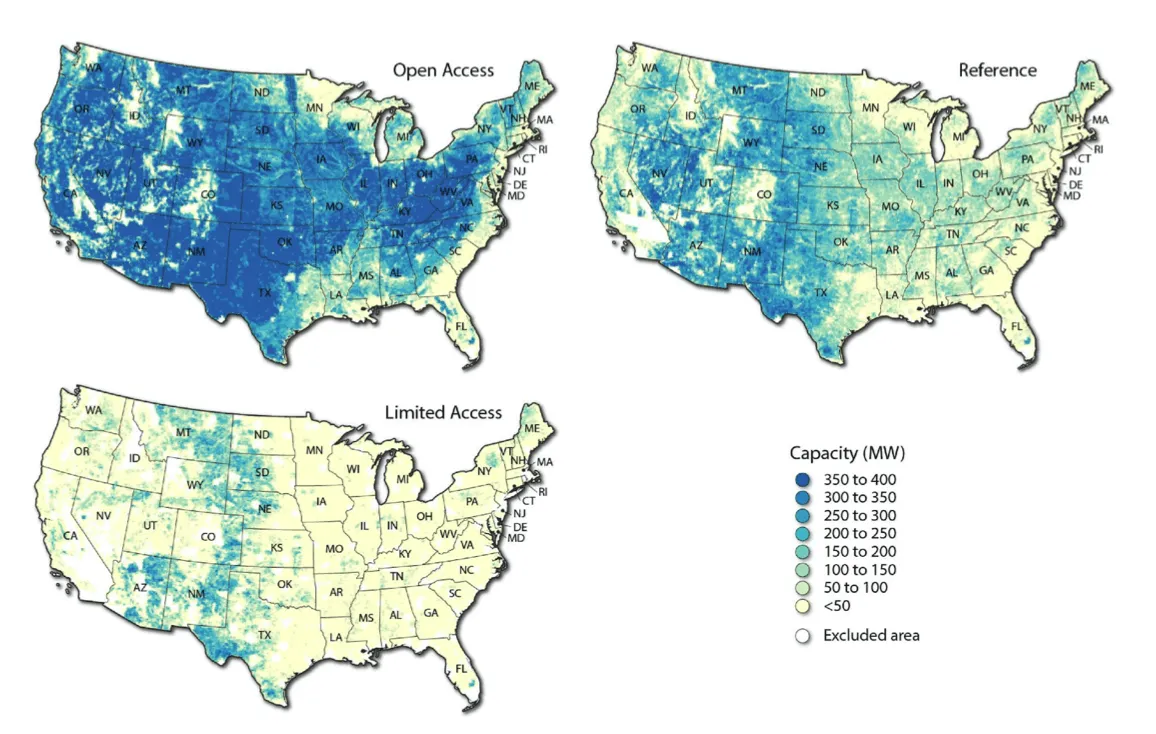
In their approach to determine plausible locations for future wind farm developments the team of researchers were able to look at where turbines could be placed in relation to roads buildings waterways and other obstructions. Given the variation in state and local rules on how closely turbines can be placed to existing structures the team also analyzed three scenarios:
- The “reference case” is similar to current rules and has room for 7 827 gigawatts of wind energy capacity which is about 65 times the current level.
- The “open access” scenario shows minimal local restrictions and has room for 15 175 gigawatts which is about 110 times the current level.
- The “limited access” scenario shows heightened restrictions and has room for 2 280 gigawatts or 19 times the current level.
These scenarios were visualized within the report in order to show the extent of the restrictions and the developable onshore wind capacity:
Wind Deployment Scenarios
{% include icons/icon-quotes.svg %} The interactions of wind energy project siting resource potential and power system evolution are critical to understand given interest in high renewable energy systems particularly as wind costs have fallen and grid operators implement solutions to manage variable generation.
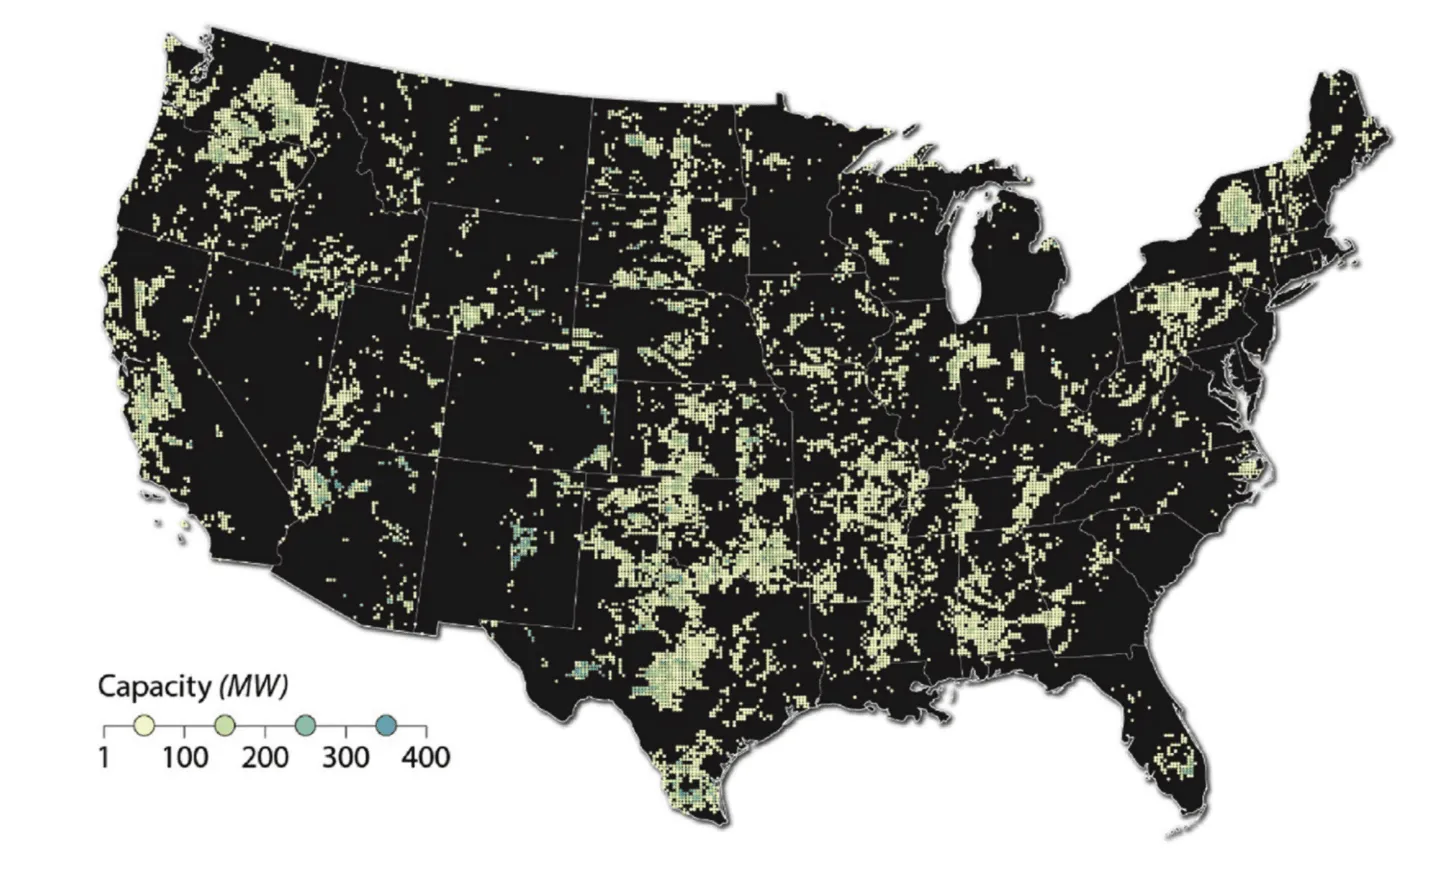
Siting restrictions can also affect regional wind development and the team also used these scenarios to analyze installed wind capacity in a scenario where onshore wind is prescribed to be 40% in 2050 using their flagship capacity expansion model The Regional Energy Deployment System (ReEDS). Of the numerous scenarios analyzed and visualized the limited access scenario revealed a spatially dispersed wind development requiring more power plants with smaller capacity:
Overall the analysis concluded that “despite the vast U.S. onshore wind resource potential siting restrictions can have a measurable impact on the future development of wind.”
In particular “different siting regimes lead to variations in future wind capacity with the greatest impacts observed under scenarios with high demand for clean energy. With the tightest emissions limit modeled 2050 onshore wind capacity varied by +7% (49 GW) in the least-restrictive siting regime to a decrease of 37% (270 GW) under the most-constrained case.”
Want to get started? Sign up for a free account


