Posts by
Jesús Rodrigo Melchor


New to CARTO: Gloval Analytics’ housing data
See Gloval Analytics' data from CARTO's Data Observatory in action, including real estate, energy performance and environmental risk use cases
How to Build a Tree Equity Index & Dashboard using BigQuery
Lack of trees is linked to higher temperatures & more violent crime. Discover how to use the BigQuery Spatial Extension & CARTO for React to build a tree score dashboard.
How to Visualize Urban Growth with Spatial Analytics in BigQuery
How has your city or urban area grown? Discover how to create an Urban Growth visualization using open data & CARTO's Spatial Analytics in BigQuery.
How to Improve Retail Trade Area Accuracy with Mobility Data
Read how to improve retail trade area accuracy by moving beyond buffers & drive times to using spatial analysis & human mobility data
React to the Changing Face of Retail DIY with Behavioral Data
With COVID-19 causing dramatic shifts in consumer spending behavior, DIY & other retailers can leverage geospatial data to discover new revenue opportunities.
CARTO BigQuery Tiler Upgrade Gives Speed & Feature Boost
Read about new features to CARTO BigQuery Tiler: the fastest, most convenient, & cost effective way to visualize spatial Big Data & generate Tilesets for the web
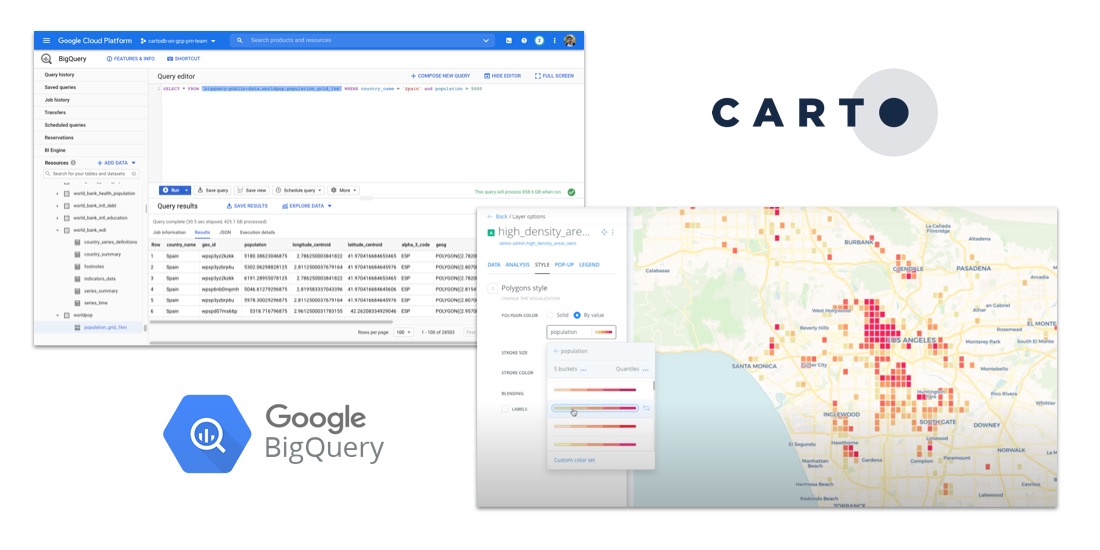
How to Analyze Google BigQuery Data in CARTO
Learn how to visualize geospatial Big Data hosted in Google BigQuery by creating a CARTO instance on the Google Cloud Platform & using our BigQuery Connector.
CARTO + Placekey: Cloud Native Spatial Linkability
Learn more about our integration with Placekey, enabling universal standard identifiers for any physical place to be used with spatial analysis & visualization.
Improving Healthcare Access with BigQuery Tiler
Identifying high impact health facility locations with CARTO's BigQuery Tiler & open-sourced geospatial Big Data.
Where Do Expats Invest in Property on the Spanish Coast?
See how idealista used geospatial analysis & real estate location data to uncover fascinating insights on coastal property demand in Spain
CARTO & Google Cloud Announce Partnership
CARTO is now a Google Cloud Partner & available on the Google Cloud Platform Marketplace enabling analysis & visualization within a rich ecosystem.
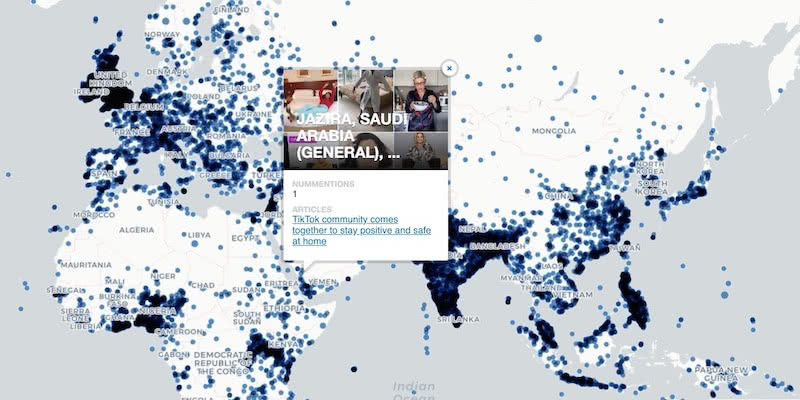
Google BigQuery Visualization: Mapping Big Spatial Data
The GDELT Project describe how to use Google BigQuery to visualize their dataset of online news coverage focusing on COVID-19
Google Analytics Spatial Data Visualized with BigQuery
Our partner Liveli takes a look at how to visualize spatial data from Google Analytics using BigQuery, gaining deeper insights from website traffic.
What Geospatial Analysis tells us about Meatpacking & COVID-19
One of our partners, makepath, describe how to use multiple open source spatial libraries for COVID-19 analysis focusing on the US meatpacking industry.
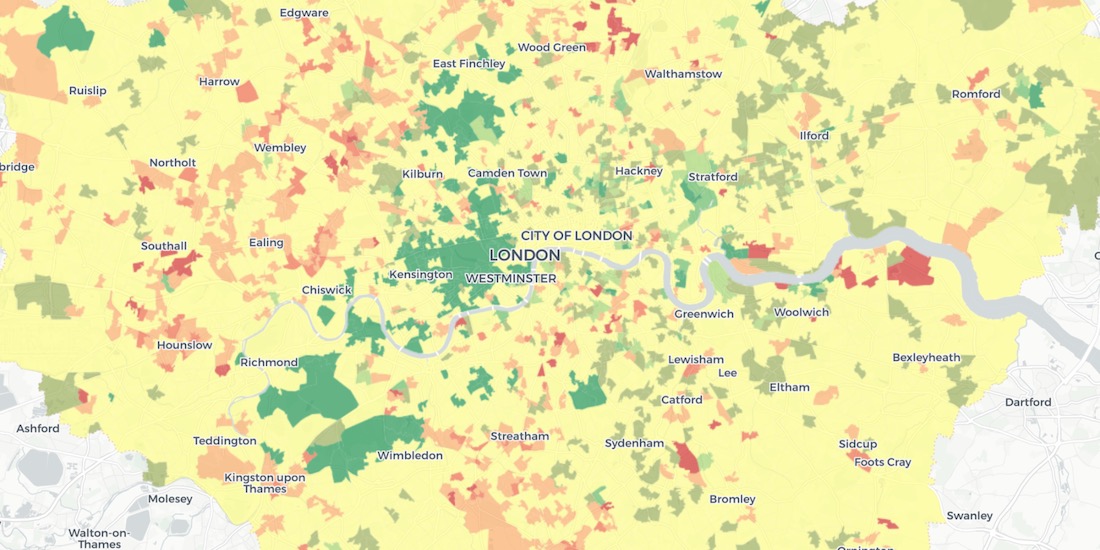
Using Spatial Analysis to Measure UK Gentrification
Read how Spatial Analysis & Machine Learning were used by researchers at UCL to understand neighborhood real estate changes & shape policy making in cities.
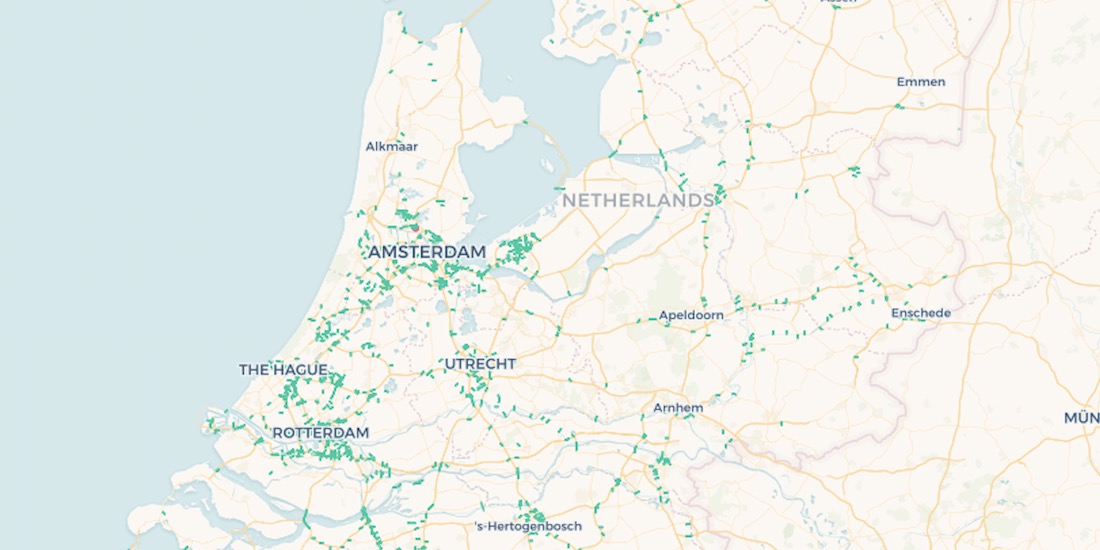
10,000 Dutch Bridges: A Foray into Using BigQuery Connector
Explore how to use our Google BigQuery connector to import large public datasets for geospatial analysis.
CARTO + Kepler.gl: Two Tools, One Workflow
Kepler.gl and CARTO users can now work seamlessly across both tools. Our integration adds a new cloud storage feature to Kepler.gl, allowing users to share and save maps privately using CARTO.
5 Facts: Out of Home Advertising in 2020
5 facts that show that Out Of Home is the future of the advertising industry
US Social Determinants of Health Atlas - Map of the Month
Leveraging Spatial Analysis techniques, researchers from the University of Chicago and the AHA worked to define and visualize the social determinants of health in America.
Real Estate Market Analysis: Top 5 Data Streams
Real Estate Market Analysis needs to be data-driven, and given the spatial nature of Real Estate investment, you want the data that you are leaning on to be spatial data
Data Visualization: The Spread of Coronavirus
Visualizing data in emergency situations, like the spread of coronavirus, can provide decision makers with the insight needed to inform rapid response plans.
Enrich Spatial Analysis with Landgrid's Nationwide Parcel Data
Landgrid brings their nationwide parcel data, which Boasts over 143 million land parcels across 2,800 counties, to the CARTO Data Observatory
Top 3 Insights from The State of Spatial Data Science 2020
Discover key insights from our survey of how enterprise leaders from industries like Real Estate, Financial Services, Advertising and more are engaging with Spatial Data Science in 2020
Speed up your spatial analysis with CARTOframes 1.0
CARTOframes is the go-to tool for powering analysis with spatial insights and efficiently working with spatial data and spatial models
Emerging Technology - Impacts on Location Intelligence
From Autonomous Vehicles, to Digital Twin, to Human Augmentation, new technology is set to change the world and the Location Intelligence industry is no different.
Top Location Intelligence and Spatial Stories
Celebrating the top stories, tips and tricks, tech updates, and of course, cool maps from around the worlds of Location Intelligence and Spatial Data Science
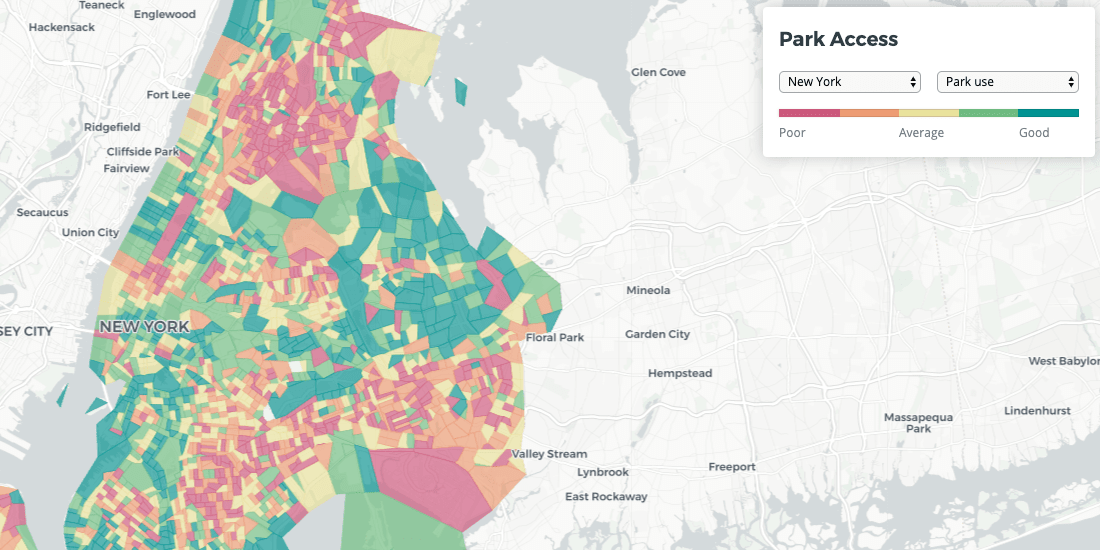
Quantifying Park Use in American Cities: Spatial Models and Novel Measures
Learn how cities can use spatial modeling to more accurately assess park use to inform planning and facilities decisions
Spatial Solutions for the SDGs - COP25
In anticipation of COP25, we wanted to explore some of the ways that spatial data analysis can help to achieve the SDGs and invite you to several events to discover it yourself!
Google Fusion Tables Turndown: An Alternative to Keep Mapping
If you're trying to find a Google Fusion Tables alternative, CARTO has you covered. Keep mapping and much more with our full stack Location Intelligence platform.
Announcing #SDSC20 - Where Will You Join Us?
Through dozens of sessions exploring the impacts of powerful analysis, SDSC exemplified why Spatial is so important - but also made clear that Spatial is just getting started
Mapping Your Salesforce Data: CARTO in Einstein Analytics
CARTO's Salesforce Lightning app component works seamlessly with Salesforce, integrating complete mapping capabilities with Einstein Analytics Dashboards
Data Events to Enjoy - Winter 2019
Enjoy this list of several interesting events for data scientists, analysts, developers, academics, and other spatial professionals
Spatial Analysis for Tourism in Partnership with Andorra
CARTO is partnering with Andorra's ACTUA program and MIT to deliver deeper insights on the country's burgeoning tourism industry
Equal Earth Projection in CARTO!
Developed in 2018, the popular Equal Earth Projection is now available to users in CARTO!
PostGIS 3.0.0 Just Released
With a lot of enhancements, bug fixes, and several new features, the release of PostGIS 3.0.0 brings improved speed and performance to CARTO users
Spatial Data Simplified: Introducing Data Observatory 2.0
We’re introducing Data Observatory 2.0, the latest version of our spatial data repository that will make spatial data more accessible and faster to manipulate for Data Scientists and Analysts across the globe.
Spatial Leaders from Around the Globe Converge on SDSC19
The Spatial Data Science Conference 2019 brings together leaders from industry, government, and academia for a day of panels and discussions on the latest technologies and techniques.
Retail Revenue Prediction Models with Spatial Data Science
Predicting store revenues is critical, allowing retail leaders to stay agile, make informed decisions around current store operations, and plan the most effective new openings. The most accurate prediction models include the location component.
Inside CARTO Engineering: Configuration Management Makeover
In order to achieve our plan of being the leading location intelligence platform, we continually invest in our infrastructure to provide the best service to our client. Today we are telling a success story about how we revamped our configuration management system
Forrester Includes CARTO Among Location Intelligence Platform Providers In Now Tech Report
CARTO recognized as a leader in Forrester’s Location Intelligence report, highlighting its platform’s advanced spatial capabilities and data-driven decision support.
Introducing Our Location Data Streams Catalog
Location Data Streams allow you to access both open data and premium data from market leaders.
Upgrading our Core Platform to PostgreSQL 11
In order to meet our users' increasing performance needs, during the following weeks we will be upgrading our software stack to be based on PostgreSQL 11 and PostGIS 2.5.
CARTO acquires Geographica to expand its professional services offering
We are pleased to announce that we have acquired one of our leading partners, Geographica
Improving Healthcare Access with Spatial Data Models
An investigation of healthcare access across America, built on new spatial data science techniques
Must-Follow Twitter Accounts for Spatial Data Science
This year's CARTO twitter guide features 50 twitter accounts to follow for those looking to dive specifically into Twitter's Spatial Data Science community
Announcing Discovery 2019: The Location Intelligence Summit
Recap Europe's top Spatial Summit in Madrid, June 6th, 2019. Keynotes by experts in Location Intelligence, GIS, data analytics & more.
Airship 2.0 is here
Explore features, Histogram widget enhancements, Time Series widget, and seamless CARTO VL integration. Elevate your Location Intelligence with Airship 2.0.
Mapping Segregation - MIT's Atlas of Inequality
Explore The Atlas of Inequality, a project revealing behavioral patterns and segregation impacts, led by MIT and Universidad Carlos III de Madrid.
Mapping Geoawesomeness' Top 100 Companies and Startups
Our team used CARTO VL and Airship to map the Geoawesomeness Top 100 Geospatial Companies and Startups list
Meet us at MWC: 1 Month To Go
we're getting very excited to attend this year's edition of the GSMA's flagship conference, Mobile World Congress - the world's largest exhibition for the mobile and telecommunications industry.
Faster, Stronger Smart Cities with Location Intelligence
The market for “Smart Cities” solutions is expected to more than double over the next five years, from $308bn in 2018 to $717bn in 2023. With growth driving greater innovation …
Faster, Stronger Smart Cities with Location Intelligence
The proliferation of Location Intelligence solutions is a big part of Smart Cities growth. Cities uniquely benefit from a deeper understanding of 'where,' in areas from disaster relief and health services, to traffic optimization, and more.
Mobile Data 101: Challenges and Best Practices
Understand the challenges and best practices for effectively using GPS and Telco data.
Examining Potential Impact of H-1B Reform with Data Visualizations
USCIS started accepting 2018 H-1B Visa applications in 2017. Explore potential impacts of the proposed H.R.670 bill on the tech industry and American economy.
CARTO is now part of the Github Student Developer Pack!
CARTO is now part of the Github Student Developer Pack! Empowering student developers with cutting-edge location intelligence tools.
How The New York City Mayor’s Office takes a real-time pulse of the city with its interactive dashboard
5 Things You Can’t Miss at #MWC17
Discover must-see events at MWC 2017, from new tech showcases to expert-led sessions. Explore how mobile and location intelligence are shaping the future.
Spreading Location Intelligence all around the world
Thanks to our Partners for a year of growth in location intelligence! Join our network, explore projects, and anticipate more in 2017. Happy Data Mapping!
Harvard Explores Digital Prosperity in Latin America
Smart cities thrive through collaboration. Discover how municipal governments, citizens, universities, and businesses drive sustainability in Latin America.
Spotify gets into the Groove with Musical Cities
Take a look how Spotify leverages CARTO to create the Musical Cities map, revealing distinctive music preferences across 1,000 cities worldwide.
UNICEF takes a shot at a healthier world
Discover how CARTO's technology is aiding UNICEF's global health efforts, improving vaccination rates by optimizing clinic locations in Kenya.
CARTO Expands Operations to Washington, D.C.
CARTO expands to Washington D.C., joining Refraction in Reston Town Center, with opportunities for growth and new team members.
Mapping the historical biodiversity of the Solomon Islands with the American Museum of Natural History
Charting New Terrain in eCommerce with Pitney Bowes
CARTO partners with Pitney Bowes to integrate location intelligence into global commerce, enhancing data visualization and analysis
Creating Animated Maps with CARTO Builder
Explore the power of Torque.js, offering innovative geospatial data aggregation for both time and space. Animate and analyze data trends effortlessly!
Hurricane Season 2016: Locating Resiliency in Sandy's Aftermath
CARTO aids NYC's Mayor's Office in tackling climate change, visualizing risks, and preventing disasters like Hurricane Sandy. Explore OneNYC's efforts.
The Revolution will be Visualized: CARTO joins PREP
Discover CARTO's role in the Partnership for Resilience and Preparedness (PREP), empowering global climate resilience planning.
CARTO’s Open Data Week 2016 Preview
Immerse yourself in the world of Open Data at CARTO's Madrid event! Engage with global innovators, explore workshops, and join discussions.
Geospatial Learning Across the Curriculum at NYU
NYU collaborates with CARTO to enhance GIS learning, enabling students to utilize location intelligence across disciplines.
Boom or Bust! What Enigma’s newest project tells us about the economy of North Dakota
Explore Enigma's Boom or Bust project, delving into North Dakota's economy using CARTO for compelling visual storytelling.
Creating Category Maps with CARTO Builder
Learn to create Data-Driven Maps with CARTO Builder! Color-code geospatial features by category effortlessly. Improve decision-making now!
CartoDB to CARTO: the Back Story to our New Brand
Discover the rebranding of CartoDB into CARTO, a cloud-native platform enhancing location intelligence and spatial data analysis capabilities.
Connect and learn with CARTO in September
Explore groundbreaking spatial analysis & visualization innovations by CARTO. Join us at events worldwide & dive into data insights. Discover more!


.png)

.png)


