Improving Healthcare Access with Spatial Data Models


America's urban-rural divide looms large in modern American discourse across varied and diverse fields and arenas. The nation's rural areas as designated by the US Census Bureau make up 97% of America's total landmass but are home to less than 20% of the population. The ramifications of the divide permeate politics social issues housing and job markets and more.
Healthcare Access and the Urban-Rural Divide
Healthcare and the access to it is one such area that appears to be impacted by the growing urban-rural divide. The widely reported doctor shortage in sparsely populated rural areas has created what the National Rural Health Association calls "health care disparities (that) impede rural Americans in their struggle to lead normal healthy lives."
While proposed solutions to the challenges posed by this issue have been presented by policymakers elected officials urban planners and more the problem remains largely unresolved. The limitations in these solutions often are caused by:
- Computational limitations of traditional GIS tools and resources
- Modeling that doesn't fully take into account either the spatial component of the problem or the nature of patient decisions
In an effort to overcome these shortfalls Postdoctoral Fellow Jamie Saxon and research assistant Daniel Snow from the University of Chicago's Center for Spatial Data Science have released the results of their work presenting new methodologies and models based on spatial data science techniques to better assess healthcare accessibility in the U.S. You can read their paper here.
RAAM - A new way to model real healthcare accessibility
Rudimentary methodologies for looking at accessibility are largely naive looking simply at the ratio of patients per physician by county. This ignores patient agency and how the accessibility question will transcend such borders.
A better but still limited methodology is the two-step floating catchment area method to assess access and allow for some incorporation of patient preference. But this too has some shortcomings:
- No response to congestion or busier doctors
- Demand for physicians is based off of a fixed patient origin as opposed to recognizing possible work and home origins
- Floating catchment areas still have sharp cutoffs at their edges
- This method still accommodates only a single travel mode and does not scale to the national level
In order to address these shortcomings Saxon and Snow constructed their Rational Agent Access Model (RAAM). This model can incorporate multiple travel modes multiple origins and competition between physician locations and can scale to the national level. The video above shares Saxon and Snow's talk introducing the work at the 2018 Spatial Data Science Conference.
The RAAM model is based on an agent-based simulation where agents (or patients) are selecting the location that minimizes their cost which is the sum of a congestion cost (based on physician demand per capita) and travel cost (based off of the agent's home or work origin). Acquiring that transit cost nationally involves computing 130 million Origin-Destination pairs.
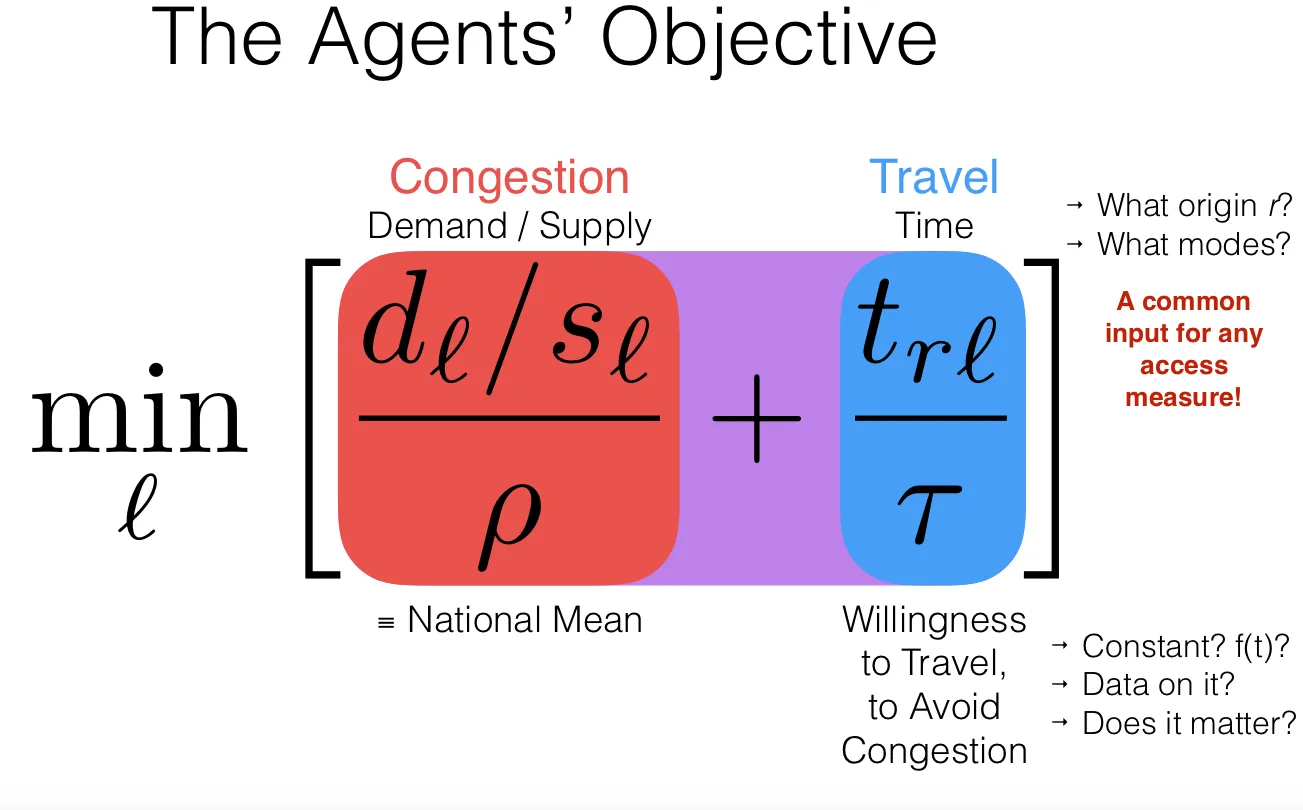
The advantages of this RAAM model over floating catchment areas includes the incorporation and separability of multiple costs (congestion and travel time) extensibility to multiple origins and travel modes and the elimination of catchment edges. The latter point is contingent upon the scalability of this method.
Want to incorporate spatial components into your data science workflow? Learn how from our recent webinar!
Methods: Building a National Origin-Destination Matrix
In order to show the feasibility of the RAAM model Saxon and Snow sought to model the entire United States which posed a slight challenge. While the data required to determine congestion costs was more readily available the burden of calculating the travel costs was higher requiring an OD Matrix of the whole country.
They shared the pipeline to create this OD matrix in their talk at the Spatial Data Science Conference:
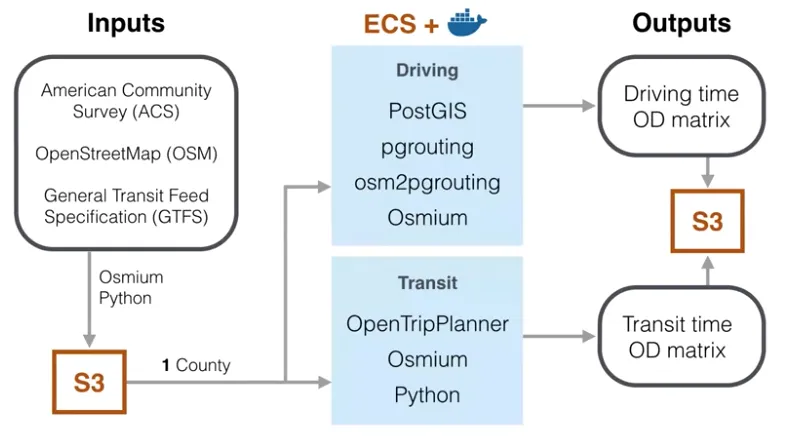
They created origins and destinations as the centroids of geometry for every census tract in the country. While the model can be done at a more granular level the tract level was the most granular level they could get with accurate data related to congestion.
Using one docker container per county allowed them to run the model for the whole country in approximately 2 hours. Running the model for all 70 000+ census tracts was also computationally inexpensive costing about $20 using Amazon Web Services.
Visualizing Healthcare Access and Costs and Drawing Conclusions
By combining the results of the RAAM model across every county in the country provides a distinct picture of healthcare access. The below map visualizes that access and quantifies it allowing users to narrow down by the combined cost of care and it's deviation from the national mean.
The results show interesting patterns with areas in Utah and Southern Texas showing the highest cost for accessing care. In more deeply examining the results Saxon and Snow note that tying higher cost (in terms of transit and congestion) for care thematically to the urban-rural divide is actually too simplistic. The model shows plenty of areas with low population density where patients are not incurring higher costs. Intersecting census data actually showed that a more determinant factor of higher cost is education level with a positive correlation between lower education levels and higher care costs.
Spatial Data Science to Better Understand Access
The RAAM model used here by Saxon and Snow uses modern spatial data science methods open source tools and multiple data streams to create a cost effective solution for looking more closely and accurately at healthcare access. This same model can be applied to improve any access measure that uses the common floating catchment area method such as access to jobs public services and more.
This is just one example where by applying the latest techniques and technologies spatial data scientists can help us to improve our understanding of our world and to solve the problems that we face as a society.