

Map of The Month: Mapping Urban Transit in Santiago, Chile


Every now and then at CARTO we see incredible maps that tell important stories about cities organizations our world and people. We spotted this one from one of our users in Chile and decided to find out the story behind it.
As a transportation engineer Ariel López seeks solutions for some of the most common transit problems and challenges that impact our cities. He found that the engineer's approach observing transit flows through a purely scientific lens was ignoring a wider social context.
It is this deficiency in approach that led him first to a Masters in Urban Planning to his recent doctoral research on Mobility with MOVYT. His desire to incorporate the wider human context is also what led him to create his Map of Travel in Greater Santiago.
Transportation problems are urban problems andthey must be addressed in a multisystemic and interdisciplinary manner.
- Ariel López
Mapping the Human Factors Behind Transit in Santiago Chile
Using origin-destination matrices Ariel mapped out over 18 million trips taken during a normal work day in Chile. His data includes information on transport method (public private or non-motorized) whether a highway was taken the time each trip was made distance travelled and gender of the traveller.
Mobile data is unlocking a new wave of insight across hundreds of industries. Learn how from our webinar!
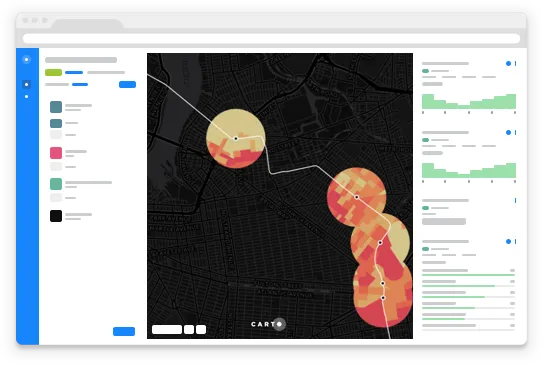
Ariel designed his map with the idea that it would be more than just a data visualization and instead would give users the opportunity to explore transit factors and draw new insights. CARTO enables this interactivity via widgets included for the above data sets allowing users to filter and drill into travel at different times and via different means painting a distinct picture of transit systems in a modern city.
By looking at only private transit for instance you can see that during a typical workday men take half a million more trips via car than women do. You can also see the private vehicle transit densely packed along Santiago's major transit corridors and even more densely packed in the commune of Las Condes home to many of the nation's economic elite.
The map also allows users to look at how residents travel on foot. By selecting only non-motorized trips we can home in on the city's almost 7 million walking trips per day. Looking at the histogram at the bottom of the map showing time of day we can see that these walking trips peak around mid-day and at 6 pm. During these times many of the walking trips take place in Downtown Santiago but perhaps the walk home after work is longer than the walk to lunch as the average walking trip time is slightly shorter during the lunch rush.
Investigating Urban Mobility with Location Intelligence
Ariel noted in his early research as an engineer that looking at mobility through the lens of physics left him wanting more. Location Intelligence has allowed him to insert the human element in the form of anonymized and aggregated data while staying quantitative and meeting scientific standards. The above examples answer two of the near limitless questions that can be investigated and answered with this more holistic approach.
Want to build your own Location Intelligence application?
Schedule some time with our experts!


