What's New in CARTO - Q3 2024


As we transition from one quarter to the next and get ready for a Fall packed with new projects and events, it’s time for us to recap and share with you some of the exciting new enhancements we have released in the CARTO Platform during the last few months. Keep reading to explore what’s new across Visualization & App Development, Analytics & AI, and Enterprise, Security & Compliance.
Our goal at CARTO is to provide our users with the most advanced geospatial platform where they can run advanced spatial analytics and build interactive maps and apps at a huge scale. All of this happens directly on top of the leading data warehouses in a truly cloud-native architecture - and we really mean “cloud native.” Our analytics platform does not require users to “sync” (i.e. transfer) or cache their data into any additional system; all queries and processing is pushed down directly on the natively-connected data warehouse.
The security and governance of our users’ data has always been and continues to be our main priority. We believe that the governance of your data assets should only happen in the data warehouse; and for this, quarter over quarter, we continue developing more advanced and secure protocols to run CARTO on top of those platforms, allowing you to operate based on your established data access policies. This past quarter we have added support for viewer credentials in Snowflake connections, access to audit logs, and several enhancements in how you can manage your assets and users - keep reading to learn more!
In the visualization and analytics areas we keep supercharging the leading cloud data warehouses with more advanced capabilities to operate with geospatial data, optimizing them for scale, security and control. We are also developing some very unique AI capabilities that we are very excited to start putting them in the hands of our users.
Now, let’s take a look at the most recent developments in the CARTO Platform! Remember to check our What’s New page to keep up to date with our product releases.
Visualization & App Development
Dynamic aggregation of point data into H3 cells and clusters
Helps you to… uncover trends from noisy data by aggregating large point datasets to multi-resolution grids and clusters.
CARTO Builder now allows for two additional options for dynamic point data aggregation, using either H3 Spatial Indexes or grouping points into clusters! These new features allow you to gain deeper insights and uncover trends from your massive scale point-based datasets more effectively. The benefits of these new dynamic aggregation options include:
- Enhance performance by reducing rendering times due to the lightweight nature of Spatial Indexes.
- Identify hotspots and areas of interest with greater clarity.
- Simplify data complexity by aggregating data into meaningful patterns.
Enhanced layer panel and support for multiple spatial data columns in Builder
Helps you to… streamline map creation with an improved layer configuration UI.
This quarter we introduced an enhanced version of the layer configuration panel in CARTO Builder, making the experience of creating maps in Builder even more enjoyable and efficient.
The redesigned panel features a cleaner layout and includes a new 'Data' section at the top. In this new section, you can now define the spatial definition of the source linked to your layer. This is especially useful if your source contains multiple spatial columns or if Builder cannot recognize the spatial column by default. Learn more about the spatial definition of your sources here. Also, explore our updated documentation section for layers to get the most out of this update.
Support for framework-agnostic widgets in your deck.gl applications
We see an increasing number of developers using CARTO + deck.gl to scale and accelerate their cloud-native geospatial visualizations. Now, thanks to the new CARTO widgets, they can also add scalable, interactive charts and widgets to their applications. We love this because it enables you to:
- Build your favorite chart combining CARTO’s scalable and flexible data models with the custom UI of your choice.
- Easily sync your widgets with a deck.gl map or use your widgets as fully interactive filters, always leveraging your cloud data warehouse.
- Fully compatible with your favorite JS framework (React, Angular, Vue…)
We're excited to see what you build! — To get started, head over to the technical documentation or check the new examples for CARTO Widgets.
Analytics & AI
CARTO’s AI Agents for conversational analysis on maps now in private preview
Helps you to… fully democratize spatial analyses by allowing users to "speak to their maps."
We are very excited to announce that one of our most recent developments, the AI Agent for Builder maps, is now available in private preview. Editor users can now build an AI Agent connected to a map and provide a conversational interface to their map viewers to address spatial questions quickly and intuitively with natural language.
CARTO AI Agents eliminate the traditional barriers of complexity that have limited map application use to geospatial experts, making spatial analysis accessible to users of all technical backgrounds. Contact your CARTO representative if you would like to have this exciting new feature enabled in your organization.
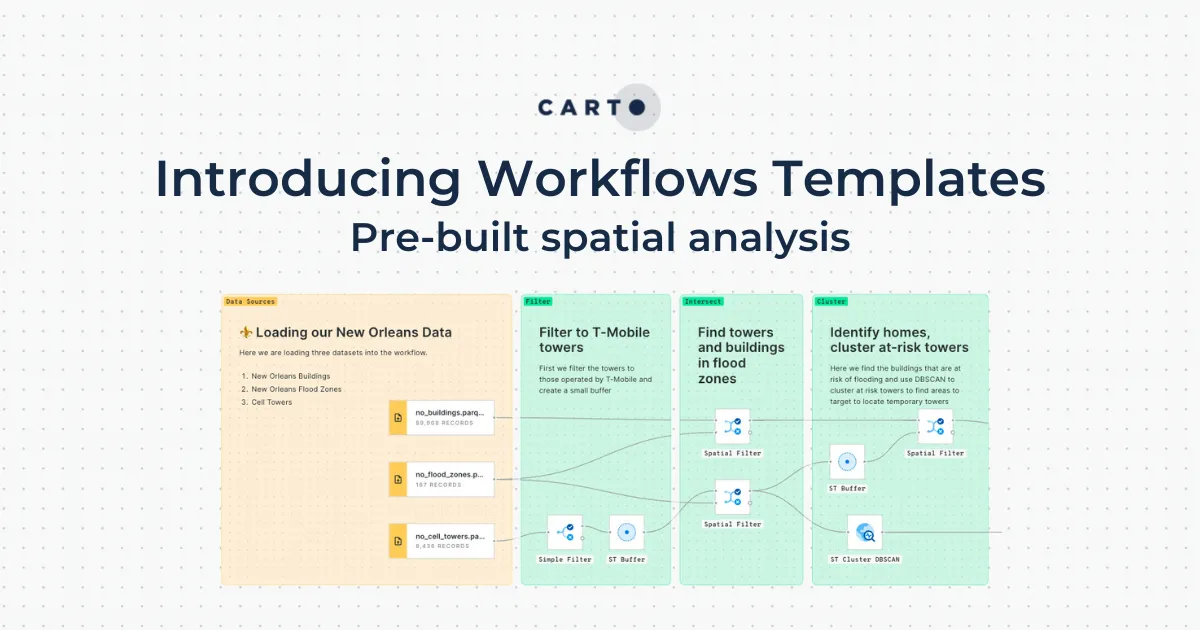
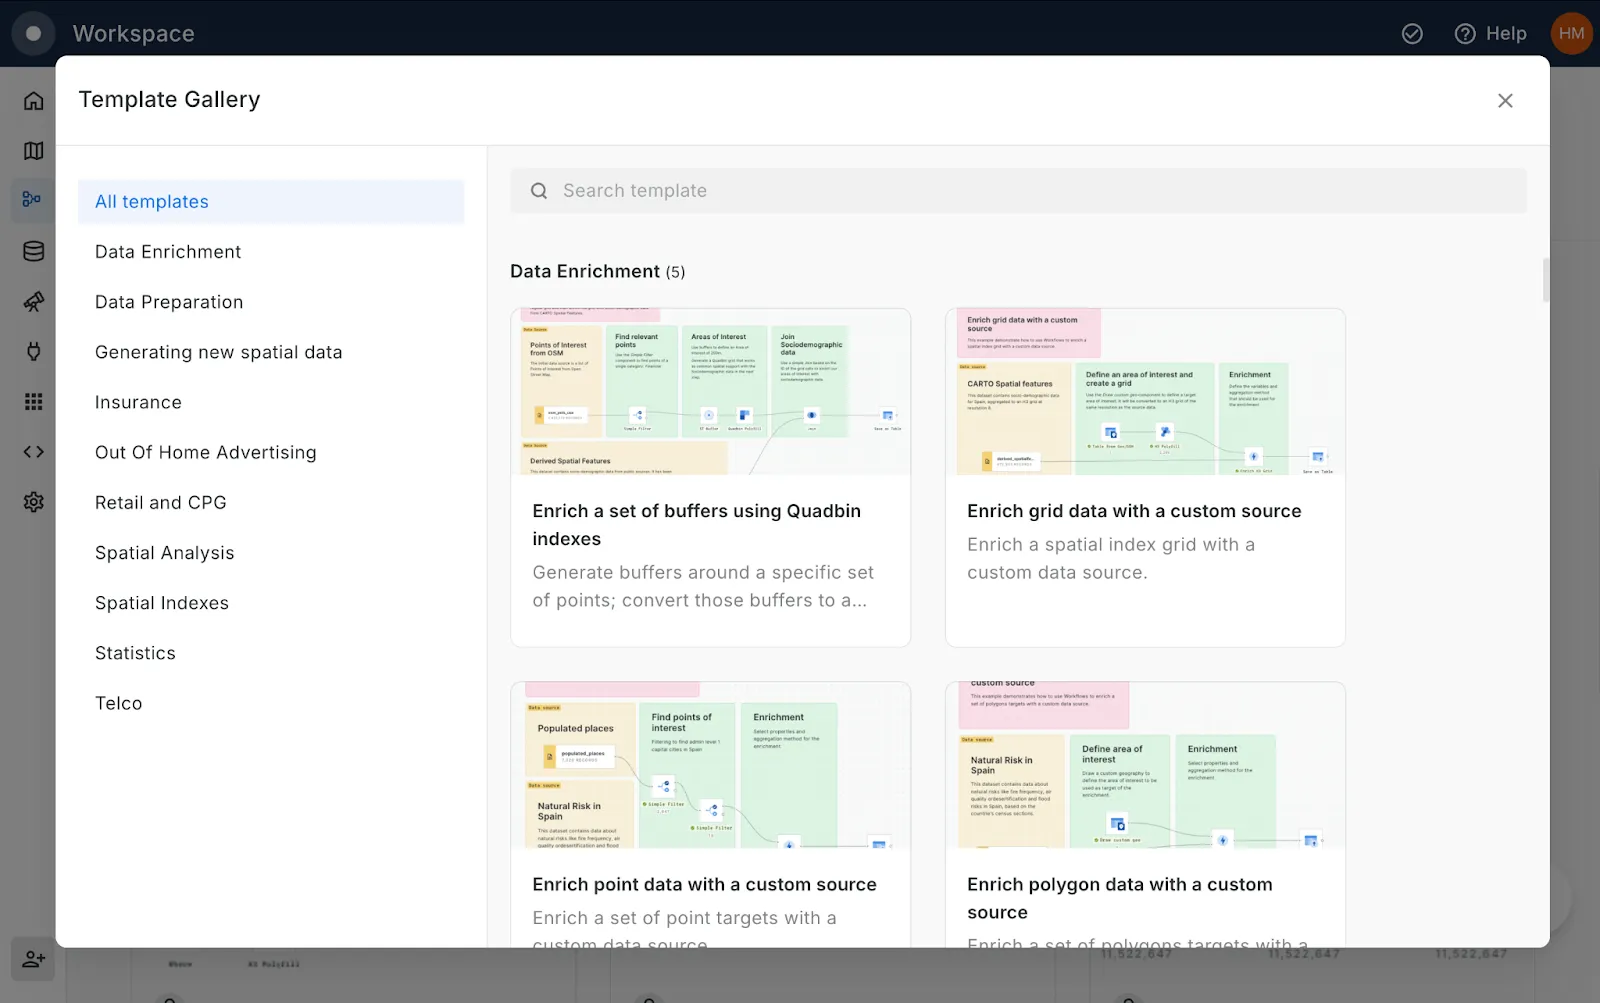
Workflows templates now available directly in the CARTO Workspace
Helps you to… create geospatial analytics workflows faster and more efficiently.
We’ve integrated our collection of Workflow Templates directly into CARTO Workspace. These templates are a collection of pre-built analyses for you to adapt to your use case, rather than spend time building from scratch. They range from common processes - such as data preparation and enrichment - to complex pipelines specific to industries, such as flood risk assessments and underwriting for insurers.
Easily leverage these from your workspace by heading to the Workflows tab and selecting ‘New Workflow > From Template’ within the Workspace.
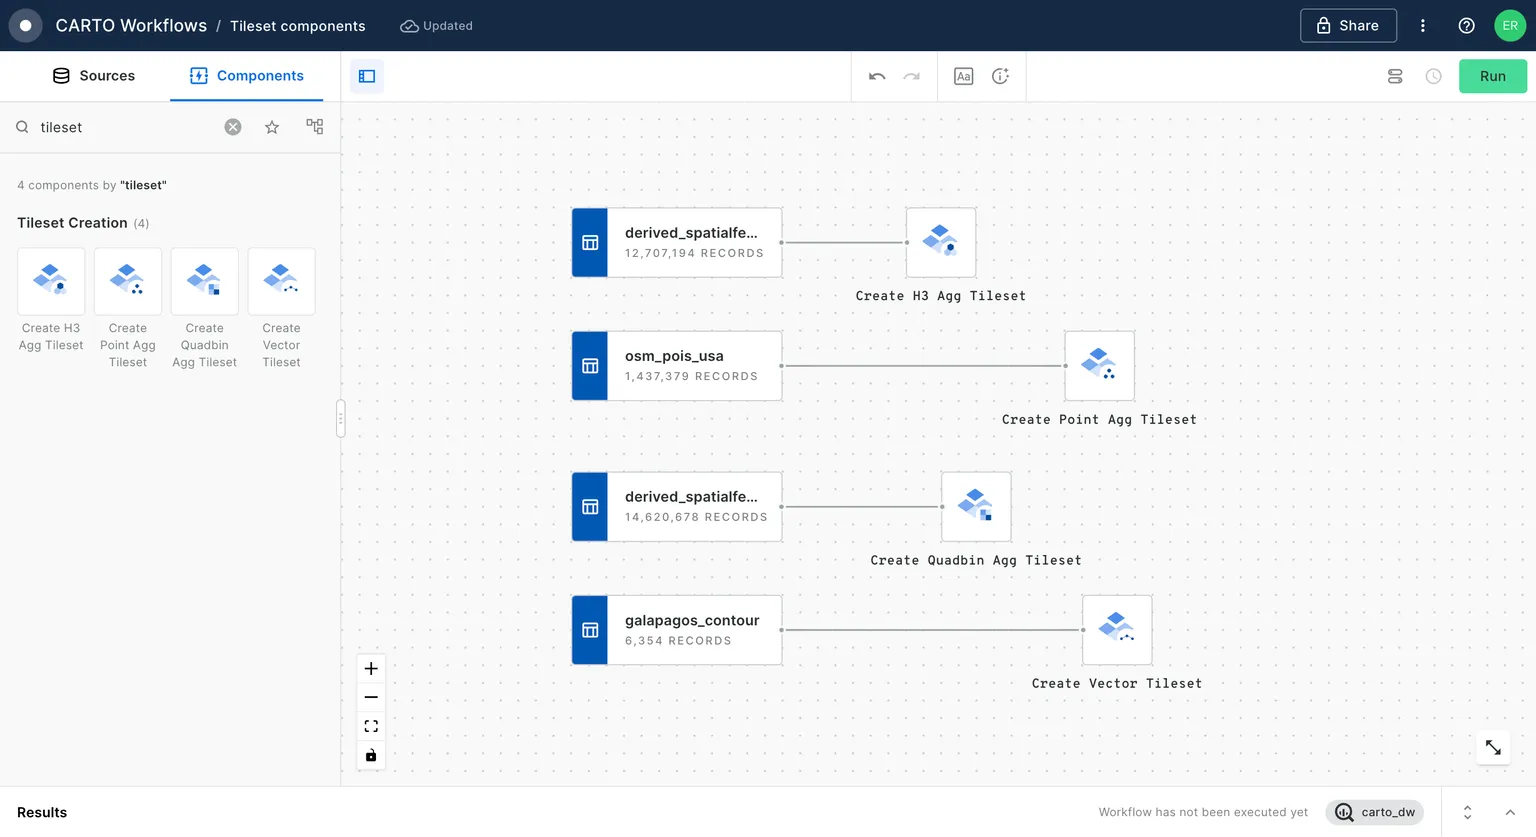
New Workflows components for creating tilesets
Helps you to… easily create tilesets for visualizing large spatial datasets, without any code!
This quarter we introduced new components in Workflows for generating different types of tilesets, making it easier to process and visualize massive datasets:
- Vector Tilesets: Smoothly handle point, line, or polygon data.
- Point Aggregation Tilesets: Aggregate dense point data to understand patterns at different zoom levels
- H3 and Quadbin Aggregation Tilesets: create highly efficient tilesets by aggregating data to hexagonal or square Spatial Index grids.
Improved Workflows data transfer functions
Helps you to… securely manage data transfers in workflows.
Workflows now offers enhanced security features to improve governance when transferring and sharing data:
- Custom bucket locations for exporting data, ensuring that users maintain control over where their data is sent.
- Email without attachments, allowing for flexible email-based workflow automation without compromising data security.
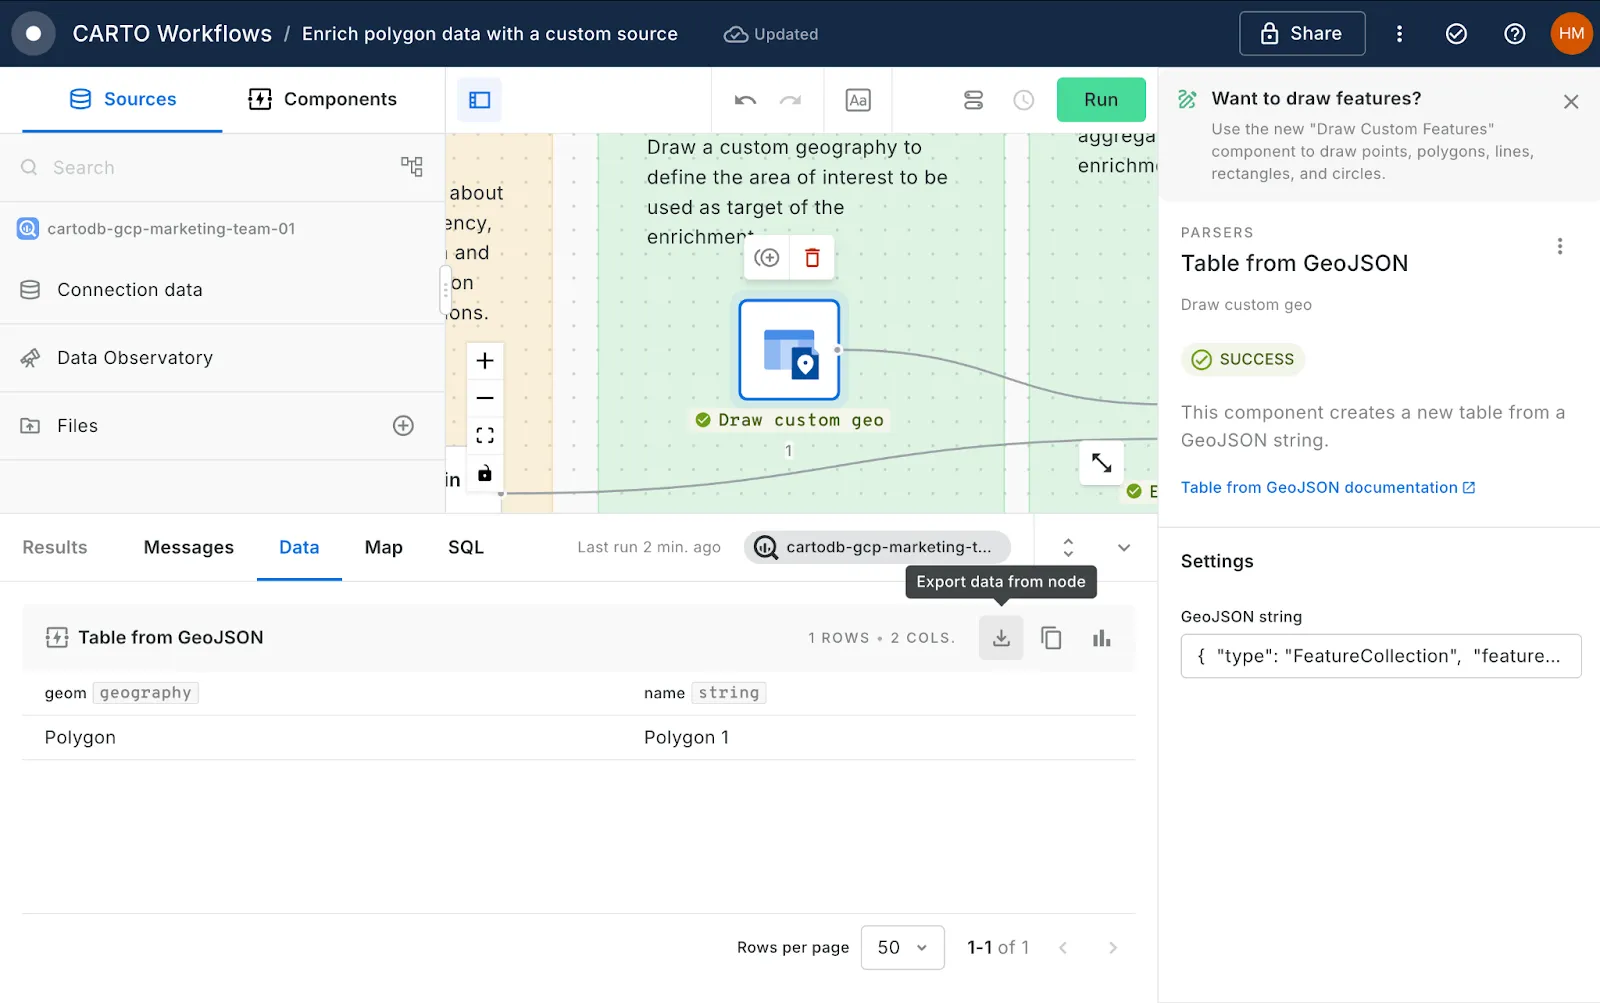
- Export data from any workflow node in the Data tab (see below) to easily extract any table from your workflow.
Enterprise, security & compliance
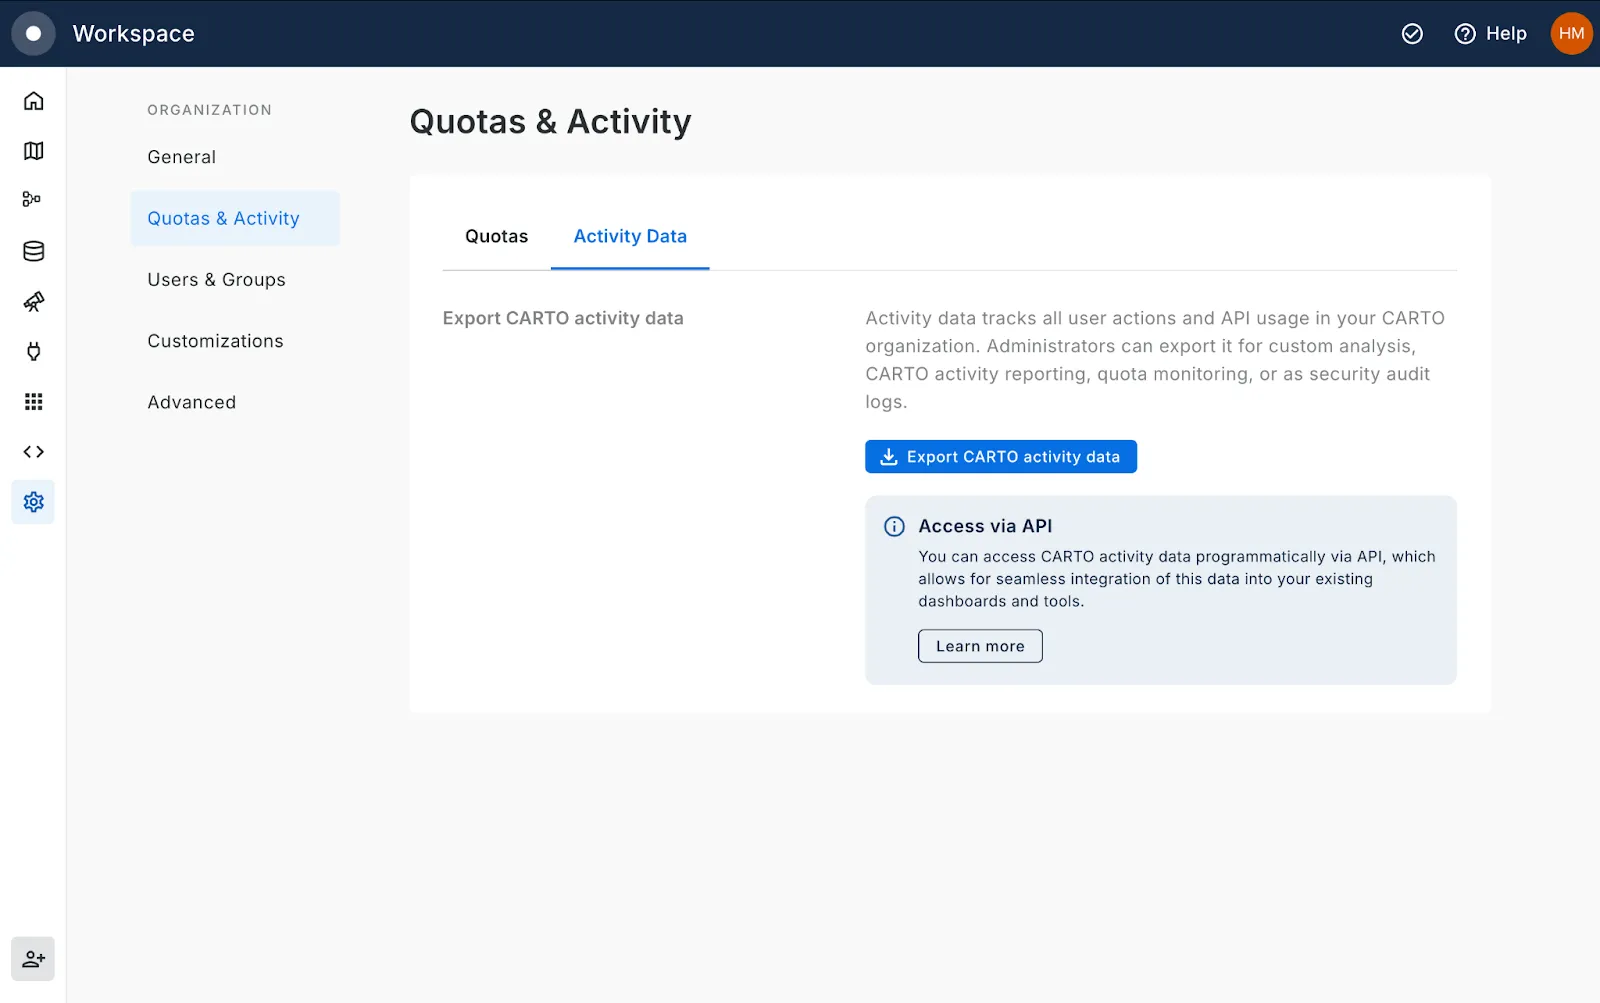
Introducing CARTO Activity data
Helps you to… monitor, audit and optimize the use of your CARTO organization.
As organizations roll out CARTO to different teams and larger groups of users, it becomes increasingly important for administrators to understand and monitor how their organization is using CARTO, and this is now easy, powerful and flexible thanks to the new CARTO Activity Data feature. This includes insights into weekly active users, workflow usage, and quota consumption. By analyzing this data, organizations can optimize their use of CARTO and better manage resources.
You can find this in the CARTO Workspace under Settings > Quotas & Activity.
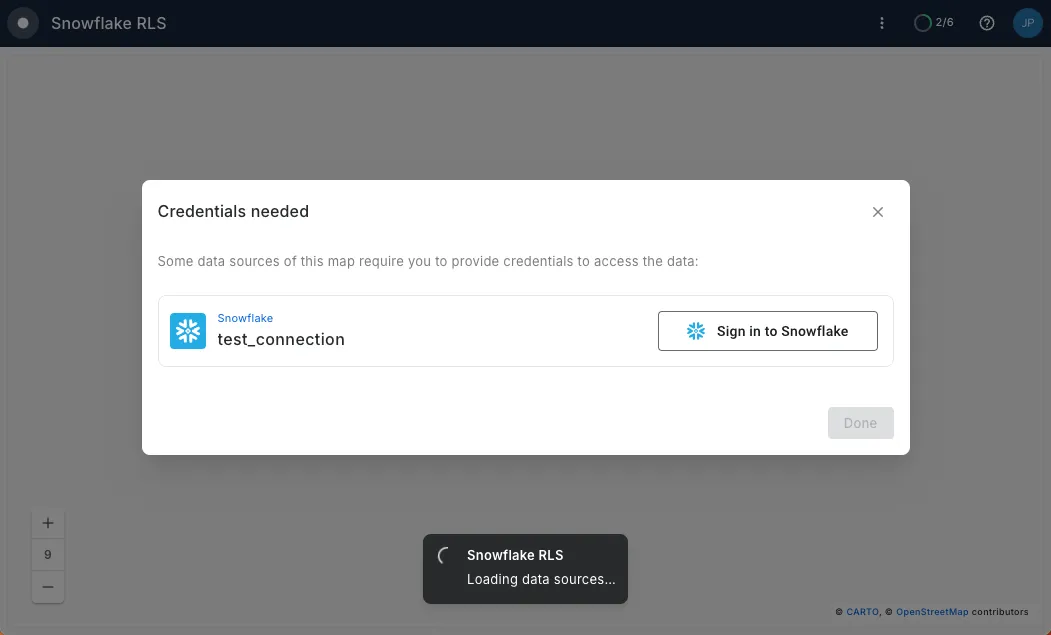
Support for enforcing viewer credentials in Snowflake OAuth connections
Helps you to… enforce stricter access controls and improve security when sharing maps.
For added security, users can now require viewer credentials for Snowflake OAuth connections. This ensures that data security policies - such as row-level security are enforced - offering more controlled access for team members and clients interacting with your data.
---
We are really excited by this wave of new enhancements and features, which we hope you will find valuable for getting the most out of your spatial data. To stay up to date on our most recent product releases remember to regularly check our What’s New page, and follow us on LinkedIn for announcements!
If you are looking for help to get started with your spatial analysis in CARTO, our Academy is full of useful resources for you.